Races in Bothell, Washington (WA) Detailed Stats
Data:
Races - White alone (%)
Races - White alone (% change since 2000)
Races - Black alone (%)
Races - Black alone (% change since 2000)
Races - American Indian alone (%)
Races - American Indian alone (% change since 2000)
Races - Asian alone (%)
Races - Asian alone (% change since 2000)
Races - Hispanic (%)
Races - Hispanic (% change since 2000)
Races - Native Hawaiian and Other Pacific Islander alone (%)
Races - Native Hawaiian and Other Pacific Islander alone (% change since 2000)
Races - Two or more races(%)
Races - Two or more races(% change since 2000)
Races - Other race alone (%)
Races - Other race alone (% change since 2000)
Racial diversity
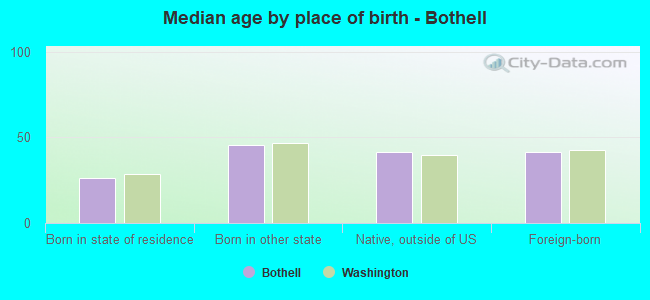
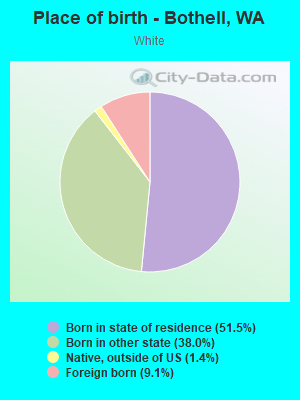
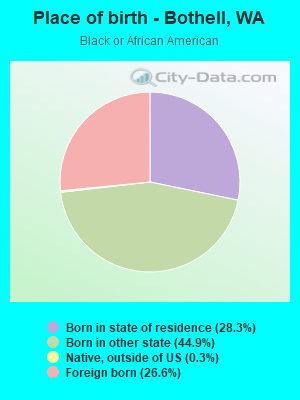
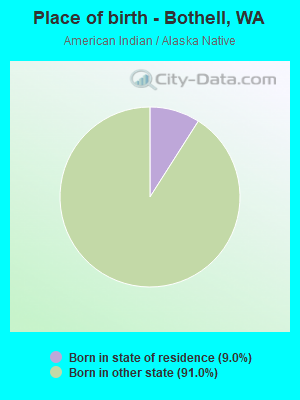
Place of birth - Born in state of residence (%)
Place of birth - Born in state of residence (%) - White
Place of birth - Born in state of residence (%) - Black or African American
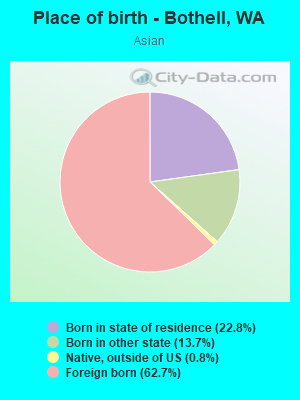
Place of birth - Born in state of residence (%) - Asian
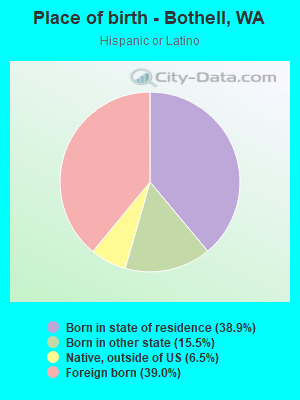
Place of birth - Born in state of residence (%) - Hispanic or Latino
Place of birth - Born in state of residence (%) - American Indian and Alaska Native
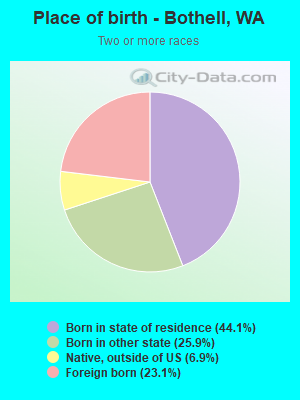
Place of birth - Born in state of residence (%) - Multirace
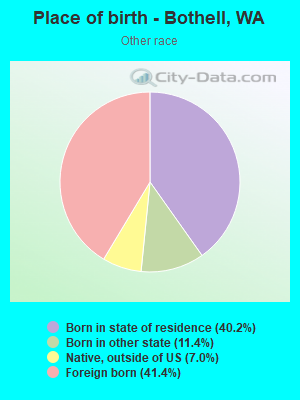
Place of birth - Born in state of residence (%) - Other Race
Place of birth - Born in other state (%)
Place of birth - Born in other state (%) - White
Place of birth - Born in other state (%) - Black or African American
Place of birth - Born in other state (%) - Asian
Place of birth - Born in other state (%) - Hispanic or Latino
Place of birth - Born in other state (%) - American Indian and Alaska Native
Place of birth - Born in other state (%) - Multirace
Place of birth - Born in other state (%) - Other Race
Place of birth - Native, outside of US (%)
Place of birth - Native, outside of US (%) - White
Place of birth - Native, outside of US (%) - Black or African American
Place of birth - Native, outside of US (%) - Asian
Place of birth - Native, outside of US (%) - Hispanic or Latino
Place of birth - Native, outside of US (%) - American Indian and Alaska Native
Place of birth - Native, outside of US (%) - Multirace
Place of birth - Native, outside of US (%) - Other Race
Place of birth - Foreign born (%)
Place of birth - Foreign born (%) - White
Place of birth - Foreign born (%) - Black or African American
Place of birth - Foreign born (%) - Asian
Place of birth - Foreign born (%) - Hispanic or Latino
Place of birth - Foreign born (%) - American Indian and Alaska Native
Place of birth - Foreign born (%) - Multirace
Place of birth - Foreign born (%) - Other Race
Residents speaking English at home (%)
Residents speaking English at home - Born in the United States (%)
Residents speaking English at home - Native, born elsewhere (%)
Residents speaking English at home - Foreign born (%)
Residents speaking Spanish at home (%)
Residents speaking Spanish at home - Born in the United States (%)
Residents speaking Spanish at home - Native, born elsewhere (%)
Residents speaking Spanish at home - Foreign born (%)
Residents speaking other language at home (%)
Residents speaking other language at home - Born in the United States (%)
Residents speaking other language at home - Native, born elsewhere (%)
Residents speaking other language at home - Foreign born (%)
Marital status - Never married (%)
Marital status - Now married (%)
Marital status - Separated (%)
Marital status - Widowed (%)
Marital status - Divorced (%)
Ancestries Reported - Arab (%)
Ancestries Reported - Czech (%)
Ancestries Reported - Danish (%)
Ancestries Reported - Dutch (%)
Ancestries Reported - English (%)
Ancestries Reported - French (%)
Ancestries Reported - French Canadian (%)
Ancestries Reported - German (%)
Ancestries Reported - Greek (%)
Ancestries Reported - Hungarian (%)
Ancestries Reported - Irish (%)
Ancestries Reported - Italian (%)
Ancestries Reported - Lithuanian (%)
Ancestries Reported - Norwegian (%)
Ancestries Reported - Polish (%)
Ancestries Reported - Portuguese (%)
Ancestries Reported - Russian (%)
Ancestries Reported - Scotch-Irish (%)
Ancestries Reported - Scottish (%)
Ancestries Reported - Slovak (%)
Ancestries Reported - Subsaharan African (%)
Ancestries Reported - Swedish (%)
Ancestries Reported - Swiss (%)
Ancestries Reported - Ukrainian (%)
Ancestries Reported - United States (%)
Ancestries Reported - Welsh (%)
Ancestries Reported - West Indian (%)
Ancestries Reported - Other (%)
Geographical mobility - Same house 1 year ago (%)
Geographical mobility - Same house 1 year ago (%) - White
Geographical mobility - Same house 1 year ago (%) - Black or African American
Geographical mobility - Same house 1 year ago (%) - Asian
Geographical mobility - Same house 1 year ago (%) - Hispanic or Latino
Geographical mobility - Same house 1 year ago (%) - American Indian and Alaska Native
Geographical mobility - Same house 1 year ago (%) - Multirace
Geographical mobility - Same house 1 year ago (%) - Other Race
Geographical mobility - Moved within same county (%)
Geographical mobility - Moved within same county (%) - White
Geographical mobility - Moved within same county (%) - Black or African American
Geographical mobility - Moved within same county (%) - Asian
Geographical mobility - Moved within same county (%) - Hispanic or Latino
Geographical mobility - Moved within same county (%) - American Indian and Alaska Native
Geographical mobility - Moved within same county (%) - Multirace
Geographical mobility - Moved within same county (%) - Other Race
Geographical mobility - Moved from different county within same state (%)
Geographical mobility - Moved from different county within same state (%) - White
Geographical mobility - Moved from different county within same state (%) - Black or African American
Geographical mobility - Moved from different county within same state (%) - Asian
Geographical mobility - Moved from different county within same state (%) - Hispanic or Latino
Geographical mobility - Moved from different county within same state (%) - American Indian and Alaska Native
Geographical mobility - Moved from different county within same state (%) - Multirace
Geographical mobility - Moved from different county within same state (%) - Other Race
Geographical mobility - Moved from different state (%)
Geographical mobility - Moved from different state (%) - White
Geographical mobility - Moved from different state (%) - Black or African American
Geographical mobility - Moved from different state (%) - Asian
Geographical mobility - Moved from different state (%) - Hispanic or Latino
Geographical mobility - Moved from different state (%) - American Indian and Alaska Native
Geographical mobility - Moved from different state (%) - Multirace
Geographical mobility - Moved from different state (%) - Other Race
Geographical mobility - Moved from abroad (%)
Geographical mobility - Moved from abroad (%) - White
Geographical mobility - Moved from abroad (%) - Black or African American
Geographical mobility - Moved from abroad (%) - Asian
Geographical mobility - Moved from abroad (%) - Hispanic or Latino
Geographical mobility - Moved from abroad (%) - American Indian and Alaska Native
Geographical mobility - Moved from abroad (%) - Multirace
Geographical mobility - Moved from abroad (%) - Other Race
Place of birth for the foreign-born population - Ireland (%)
Place of birth for the foreign-born population - Denmark (%)
Place of birth for the foreign-born population - Norway (%)
Place of birth for the foreign-born population - Sweden (%)
Place of birth for the foreign-born population - United Kingdom (%)
Place of birth for the foreign-born population - England (%)
Place of birth for the foreign-born population - Scotland (%)
Place of birth for the foreign-born population - Other Northern Europe (%)
Place of birth for the foreign-born population - Austria (%)
Place of birth for the foreign-born population - Belgium (%)
Place of birth for the foreign-born population - France (%)
Place of birth for the foreign-born population - Germany (%)
Place of birth for the foreign-born population - Netherlands (%)
Place of birth for the foreign-born population - Switzerland (%)
Place of birth for the foreign-born population - Other Western Europe (%)
Place of birth for the foreign-born population - Greece (%)
Place of birth for the foreign-born population - Italy (%)
Place of birth for the foreign-born population - Portugal (%)
Place of birth for the foreign-born population - Spain (%)
Place of birth for the foreign-born population - Other Southern Europe (%)
Place of birth for the foreign-born population - Albania (%)
Place of birth for the foreign-born population - Belarus (%)
Place of birth for the foreign-born population - Bosnia and Herzegovina (%)
Place of birth for the foreign-born population - Bulgaria (%)
Place of birth for the foreign-born population - Croatia (%)
Place of birth for the foreign-born population - Czechoslovakia (%)
Place of birth for the foreign-born population - Hungary (%)
Place of birth for the foreign-born population - Latvia (%)
Place of birth for the foreign-born population - Lithuania (%)
Place of birth for the foreign-born population - North Macedonia (Macedonia) (%)
Place of birth for the foreign-born population - Moldova (%)
Place of birth for the foreign-born population - Poland (%)
Place of birth for the foreign-born population - Romania (%)
Place of birth for the foreign-born population - Russia (%)
Place of birth for the foreign-born population - Serbia (%)
Place of birth for the foreign-born population - Ukraine (%)
Place of birth for the foreign-born population - Other Eastern Europe (%)
Place of birth for the foreign-born population - China (%)
Place of birth for the foreign-born population - Hong Kong (%)
Place of birth for the foreign-born population - Taiwan (%)
Place of birth for the foreign-born population - Japan (%)
Place of birth for the foreign-born population - Korea (%)
Place of birth for the foreign-born population - Other Eastern Asia (%)
Place of birth for the foreign-born population - Afghanistan (%)
Place of birth for the foreign-born population - Bangladesh (%)
Place of birth for the foreign-born population - India (%)
Place of birth for the foreign-born population - Iran (%)
Place of birth for the foreign-born population - Kazakhstan (%)
Place of birth for the foreign-born population - Nepal (%)
Place of birth for the foreign-born population - Pakistan (%)
Place of birth for the foreign-born population - Sri Lanka (%)
Place of birth for the foreign-born population - Uzbekistan (%)
Place of birth for the foreign-born population - Other South Central Asia (%)
Place of birth for the foreign-born population - Burma (%)
Place of birth for the foreign-born population - Cambodia (%)
Place of birth for the foreign-born population - Indonesia (%)
Place of birth for the foreign-born population - Laos (%)
Place of birth for the foreign-born population - Malaysia (%)
Place of birth for the foreign-born population - Philippines (%)
Place of birth for the foreign-born population - Singapore (%)
Place of birth for the foreign-born population - Thailand (%)
Place of birth for the foreign-born population - Vietnam (%)
Place of birth for the foreign-born population - Other South Eastern Asia (%)
Place of birth for the foreign-born population - Armenia (%)
Place of birth for the foreign-born population - Iraq (%)
Place of birth for the foreign-born population - Israel (%)
Place of birth for the foreign-born population - Jordan (%)
Place of birth for the foreign-born population - Kuwait (%)
Place of birth for the foreign-born population - Lebanon (%)
Place of birth for the foreign-born population - Saudi Arabia (%)
Place of birth for the foreign-born population - Syria (%)
Place of birth for the foreign-born population - Turkey (%)
Place of birth for the foreign-born population - Yemen (%)
Place of birth for the foreign-born population - Other Western Asia (%)
Place of birth for the foreign-born population - Eritrea (%)
Place of birth for the foreign-born population - Ethiopia (%)
Place of birth for the foreign-born population - Kenya (%)
Place of birth for the foreign-born population - Somalia (%)
Place of birth for the foreign-born population - Uganda (%)
Place of birth for the foreign-born population - Zimbabwe (%)
Place of birth for the foreign-born population - Other Eastern Africa (%)
Place of birth for the foreign-born population - Cameroon (%)
Place of birth for the foreign-born population - Congo (%)
Place of birth for the foreign-born population - Democratic Republic of Congo (Zaire) (%)
Place of birth for the foreign-born population - Other Middle Africa (%)
Place of birth for the foreign-born population - Egypt (%)
Place of birth for the foreign-born population - Morocco (%)
Place of birth for the foreign-born population - Sudan (%)
Place of birth for the foreign-born population - Other Northern Africa (%)
Place of birth for the foreign-born population - South Africa (%)
Place of birth for the foreign-born population - Other Southern Africa (%)
Place of birth for the foreign-born population - Cabo Verde (%)
Place of birth for the foreign-born population - Ghana (%)
Place of birth for the foreign-born population - Liberia (%)
Place of birth for the foreign-born population - Nigeria (%)
Place of birth for the foreign-born population - Senegal (%)
Place of birth for the foreign-born population - Sierra Leone (%)
Place of birth for the foreign-born population - Other Western Africa (%)
Place of birth for the foreign-born population - Australia (%)
Place of birth for the foreign-born population - New Zealand (%)
Place of birth for the foreign-born population - Fiji (%)
Place of birth for the foreign-born population - Micronesia (%)
Place of birth for the foreign-born population - Bahamas (%)
Place of birth for the foreign-born population - Barbados (%)
Place of birth for the foreign-born population - Cuba (%)
Place of birth for the foreign-born population - Dominica (%)
Place of birth for the foreign-born population - Dominican Republic (%)
Place of birth for the foreign-born population - Grenada (%)
Place of birth for the foreign-born population - Haiti (%)
Place of birth for the foreign-born population - Jamaica (%)
Place of birth for the foreign-born population - St. Vincent and the Grenadines (%)
Place of birth for the foreign-born population - Trinidad and Tobago (%)
Place of birth for the foreign-born population - West Indies (%)
Place of birth for the foreign-born population - Other Caribbean (%)
Place of birth for the foreign-born population - Belize (%)
Place of birth for the foreign-born population - Costa Rica (%)
Place of birth for the foreign-born population - El Salvador (%)
Place of birth for the foreign-born population - Guatemala (%)
Place of birth for the foreign-born population - Honduras (%)
Place of birth for the foreign-born population - Mexico (%)
Place of birth for the foreign-born population - Nicaragua (%)
Place of birth for the foreign-born population - Panama (%)
Place of birth for the foreign-born population - Other Central America (%)
Place of birth for the foreign-born population - Argentina (%)
Place of birth for the foreign-born population - Bolivia (%)
Place of birth for the foreign-born population - Brazil (%)
Place of birth for the foreign-born population - Chile (%)
Place of birth for the foreign-born population - Colombia (%)
Place of birth for the foreign-born population - Ecuador (%)
Place of birth for the foreign-born population - Guyana (%)
Place of birth for the foreign-born population - Peru (%)
Place of birth for the foreign-born population - Uruguay (%)
Place of birth for the foreign-born population - Venezuela (%)
Place of birth for the foreign-born population - Other South America (%)
Place of birth for the foreign-born population - Canada (%)
Place of birth for the foreign-born population - Other Northern America (%)
Place of birth for the foreign-born population - Other (%)
Latest news about races in Bothell, WA collected exclusively by city-data.com from local newspapers, TV, and radio stations
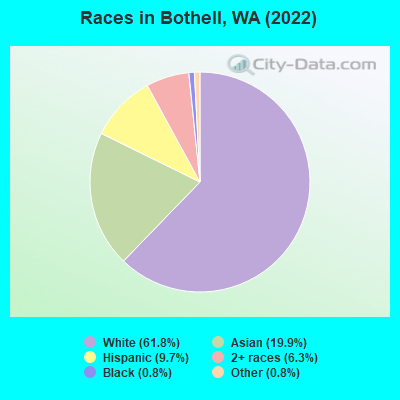
According to 2022 data, the most numerous races in Bothell, WA are White alone (29,769 residents), Hispanic (4,652 residents), and Asian alone (9,584 residents). 69.9% of Bothell residents speak English at home. 23.0% of Bothell, WA residents are foreign-born (13.3% born in Asia, 4.6% born in Latin America, 2.8% born in Europe), which is 34.7% greater than the foreign-born rate of 15.0% across the entire state of Washington.
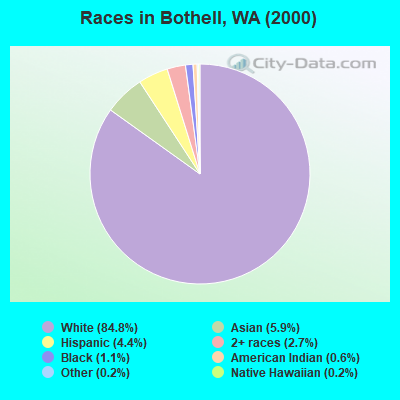
Race distribution in Bothell
2000 2022
4,652,490 78.9% White alone 441,509 7.5% Hispanic 319,401 5.4% Asian alone 184,631 3.1% Black alone 175,926 3.0% Two or more races 85,396 1.4% American Indian alone 22,779 0.4% Native Hawaiian and Other 11,989 0.2% Other race alone
4,941,456 63.5% White alone 1,093,313 14.0% Hispanic 755,832 9.7% Asian alone 523,448 6.7% Two or more races 299,537 3.8% Black alone 69,024 0.9% American Indian alone 52,231 0.7% Native Hawaiian and Other 50,945 0.7% Other race alone
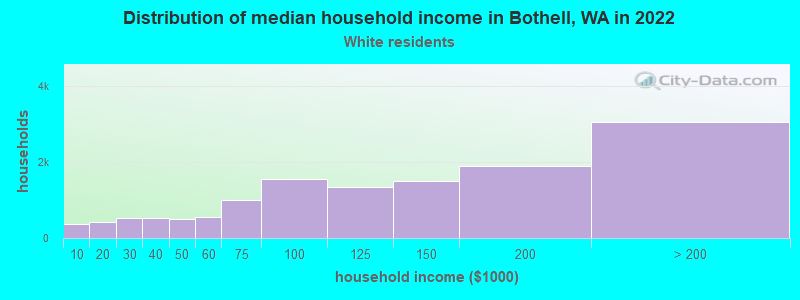
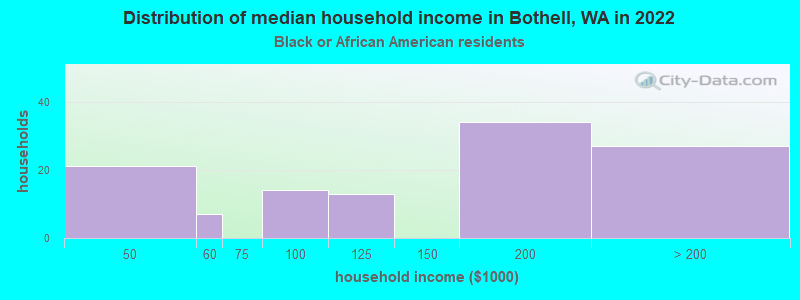
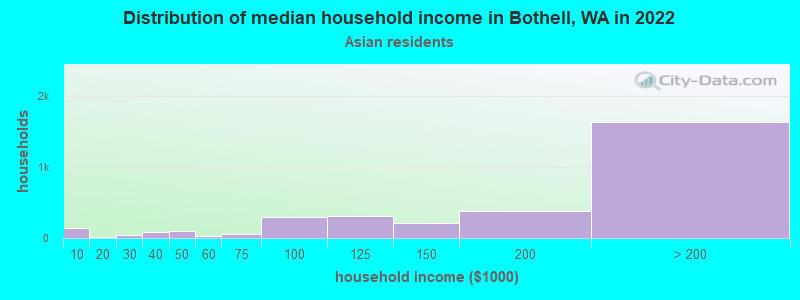
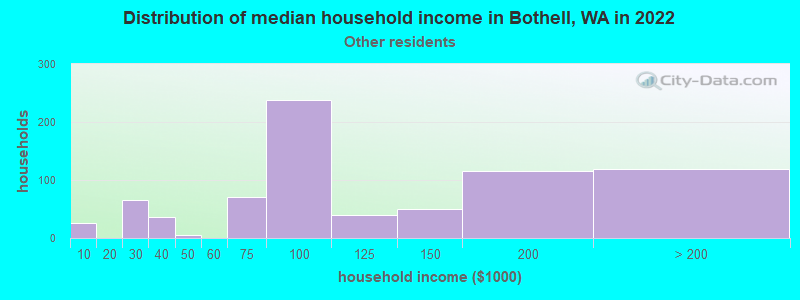
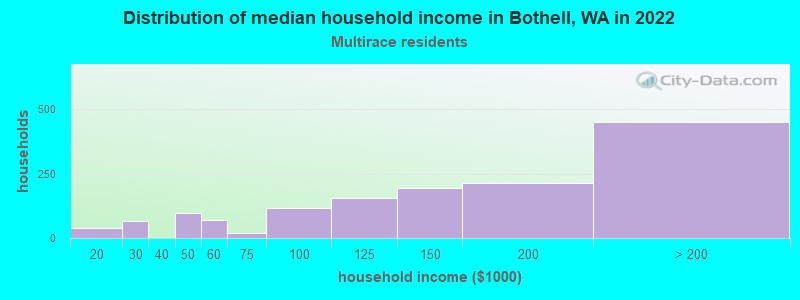
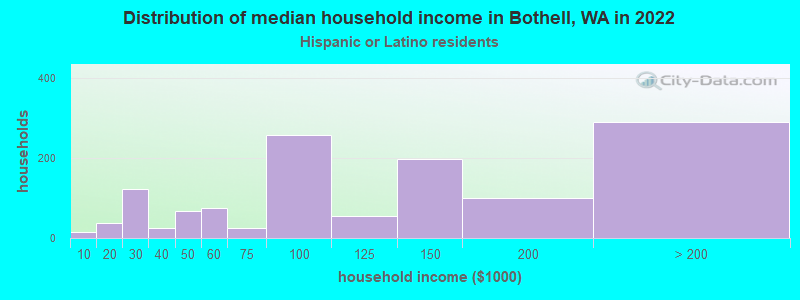
Income and house value in Bothell Median household income in 2022 $122,615 White non-Hispanic householders$159,275 Black householders$196,728 Asian householders$96,764 Some other race householders$138,507 Two or more races householders$99,145 Hispanic or Latino race householdersMedian 2022 house value over $1,000,000 White Non-Hispanic householders$968,574 Black or African American householders$823,503 American Indian or Alaska Native householders over $1,000,000 Asian householders$968,574 Native Hawaiian and other Pacific Islander householders$885,062 Two or more races householdersover $1,000,000 Hispanic or Latino householders
Median age by race in Bothell
41.1 Median age for White residents40.9 41.2 30.5 Median age for Black or African American residents35.7 25.4 75.2 Median age for American Indian / Alaska Native residents-658,092,175.1 -631,249,999.4 36.0 Median age for Asian residents36.1 35.6 -653,927,812.5 Median age for Native Hawaiian / Pacific Islander residents-664,509,168.7 -651,945,320.1 35.2 Median age for Other race residents34.5 43.6 28.5 Median age for Two or more races residents28.8 31.4 41.5 Median age for White alone residents41.1 42.7 30.5 Median age for Hispanic or Latino residents34.6 22.9
Owner/renter occupied households by race in Bothell
House owners and renters - White residents 8,455 63.7% Owner occupied4,821 36.3% Renter occupiedHouse owners and renters - Black or African American residents 27 25.6% Owner occupied80 74.4% Renter occupiedHouse owners and renters - American Indian / Alaska Native residents 29 100.0% Renter occupiedHouse owners and renters - Asian residents 2,586 79.3% Owner occupied673 20.7% Renter occupiedHouse owners and renters - Other race residents 161 20.6% Owner occupied621 79.4% Renter occupiedHouse owners and renters - Two or more races residents 807 56.8% Owner occupied614 43.2% Renter occupiedHouse owners and renters - White alone residents 8,444 64.4% Owner occupied4,672 35.6% Renter occupiedHouse owners and renters - Hispanic or Latino residents 319 24.4% Owner occupied988 75.6% Renter occupied
Language usage in Bothell
English speakers - Total 69.9% of residents of Bothell speak English at home.
8.0% of residents speak Spanish at home 2,400 65.3% Speak English very well1,273 34.7% Speak English less than very well22.0% of residents speak other language at home 6,939 68.9% Speak English very well3,126 31.1% Speak English less than very well
English speakers - Born in the United States 92.5% of residents of Bothell speak English at home.
3.0% of residents speak Spanish at home 271 63.9% Speak English very well153 36.1% Speak English less than very well4.6% of residents speak other language at home 530 81.0% Speak English very well124 19.0% Speak English less than very well
English speakers - Native, born elsewhere 58.8% of residents of Bothell speak English at home.
30.8% of residents speak Spanish at home 287 100.0% Speak English very well13.0% of residents speak other language at home 121 100.0% Speak English very well
English speakers - Foreign-born 13.7% of residents of Bothell speak English at home.
17.0% of residents speak Spanish at home 858 45.9% Speak English very well1,012 54.1% Speak English less than very well69.7% of residents speak other language at home 5,026 65.4% Speak English very well2,655 34.6% Speak English less than very well
White (Caucasian) - Speak only English Native:
94.5% (24,883)Foreign-born:
22.8% (626)
White (Caucasian) - Speak another language Native:
5.5% (1,436)Foreign-born:
77.4% (2,122)
Black or African American - Speak only English Native:
95.5% (283)Foreign-born:
20.4% (23)
Black or African American - Speak another language Native:
4.7% (14)Foreign-born:
80.4% (89)
Asian - Speak only English Native:
57.6% (1,740)Foreign-born:
11.8% (716)
Asian - Speak another language Native:
42.2% (1,276)Foreign-born:
88.1% (5,328)
Other race - Speak only English Native:
45.1% (593)Foreign-born:
1.0% (9)
Other race - Speak another language Native:
55.0% (723)Foreign-born:
100.0% (922)
Two or more races - Speak only English Native:
80.0% (2,682)Foreign-born:
8.8% (104)
Two or more races - Speak another language Native:
20.6% (690)Foreign-born:
91.4% (1,079)
White alone - Speak only English Native:
95.8% (24,868)Foreign-born:
23.9% (614)
White alone - Speak another language Native:
4.2% (1,097)Foreign-born:
77.5% (1,987)
Hispanic or Latino - Speak only English Native:
41.2% (1,077)Foreign-born:
2.4% (44)
Hispanic or Latino - Speak another language Native:
59.7% (1,562)Foreign-born:
98.0% (1,780)
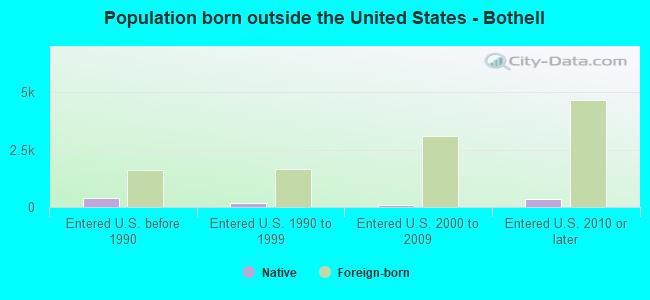
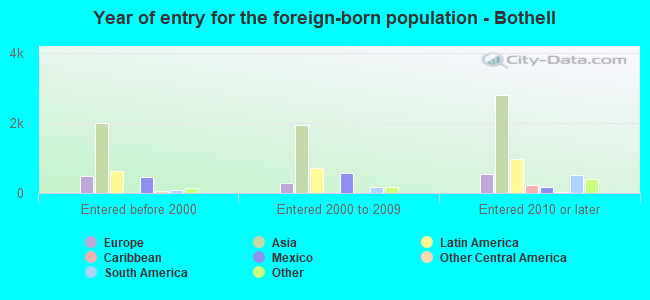
Foreign-born residents in Bothell 11,068 residents are foreign born (13.3% Asia , 4.6% Latin America , 2.8% Europe ).
This city:
23.0%Washington:
14.9%
Marital status for residents in Bothell Marital status - White (Caucasian) population 15 years and over
Males 30.9% Never married60.5% Now married0.1% Separated2.0% Widowed6.4% DivorcedFemales 24.4% Never married54.3% Now married1.0% Separated8.4% Widowed12.0% DivorcedWomen who gave birth in the past 12 months Now married:
79.9% (195)Unmarried:
20.1% (49)
Women who did not give birth in the past 12 months Now married:
53.3% (3,553)Unmarried:
46.7% (3,117)
Marital status - Black or African American population 15 years and over
Males 28.9% Never married66.9% Now married0.0% Separated0.0% Widowed4.2% DivorcedFemales 64.8% Never married32.7% Now married0.0% Separated0.0% Widowed2.5% DivorcedWomen who did not give birth in the past 12 months Now married:
22.2% (31)Unmarried:
77.8% (107)
Marital status - American Indian / Alaska Native population 15 years and over
Males 100.0% Never married0.0% Now married0.0% Separated0.0% Widowed0.0% DivorcedFemales 11.1% Never married0.0% Now married0.0% Separated0.0% Widowed88.9% DivorcedWomen who gave birth in the past 12 months Now married:
0.0% (0)Unmarried:
100.0% (4)
Marital status - Asian population 15 years and over
Males 20.5% Never married77.8% Now married0.4% Separated0.0% Widowed1.4% DivorcedFemales 14.4% Never married78.8% Now married0.4% Separated2.6% Widowed3.9% DivorcedWomen who gave birth in the past 12 months Now married:
100.0% (129)Unmarried:
0.0% (0)
Women who did not give birth in the past 12 months Now married:
78.0% (2,171)Unmarried:
22.0% (614)
Marital status - Other race population 15 years and over
Males 50.2% Never married36.7% Now married0.3% Separated3.7% Widowed9.0% DivorcedFemales 32.3% Never married57.5% Now married0.0% Separated2.7% Widowed7.5% DivorcedWomen who did not give birth in the past 12 months Now married:
41.0% (198)Unmarried:
59.0% (284)
Marital status - Two or more races population 15 years and over
Males 29.7% Never married62.2% Now married5.1% Separated0.5% Widowed2.5% DivorcedFemales 28.2% Never married58.5% Now married2.8% Separated2.1% Widowed8.4% DivorcedWomen who gave birth in the past 12 months Now married:
100.0% (160)Unmarried:
0.0% (0)
Women who did not give birth in the past 12 months Now married:
54.2% (638)Unmarried:
45.8% (538)
Marital status - White alone, not Hispanic / Latino population 15 years and over
Males 30.9% Never married60.3% Now married0.1% Separated2.1% Widowed6.5% DivorcedFemales 24.0% Never married54.1% Now married1.0% Separated8.6% Widowed12.2% DivorcedWomen who gave birth in the past 12 months Now married:
85.2% (191)Unmarried:
14.8% (33)
Women who did not give birth in the past 12 months Now married:
52.8% (3,470)Unmarried:
47.2% (3,097)
Marital status - Hispanic or Latino population 15 years and over
Males 40.2% Never married50.4% Now married0.2% Separated2.3% Widowed6.9% DivorcedFemales 37.4% Never married52.6% Now married2.8% Separated0.0% Widowed7.2% DivorcedWomen who gave birth in the past 12 months Now married:
55.0% (23)Unmarried:
45.0% (19)
Women who did not give birth in the past 12 months Now married:
48.4% (588)Unmarried:
51.6% (626)
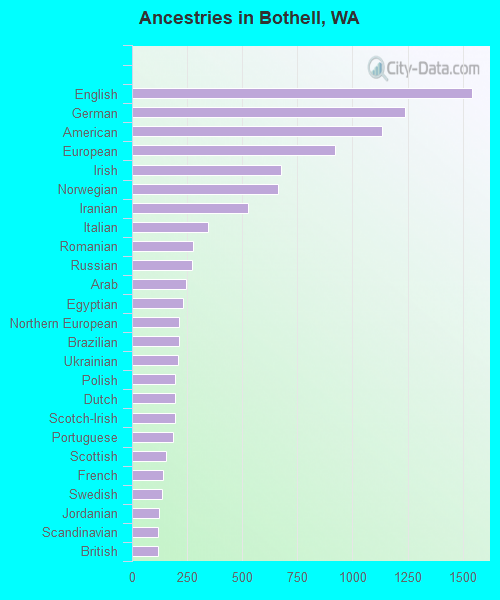
Ancestries in Bothell
1,542 6.8% English1,238 5.4% German1,133 5.0% American920 4.0% European677 3.0% Irish663 2.9% Norwegian527 2.3% Iranian344 1.5% Italian276 1.2% Romanian274 1.2% Russian246 1.1% Arab233 1.0% Egyptian214 0.9% Northern European211 0.9% Brazilian207 0.9% Ukrainian195 0.9% Polish193 0.8% Dutch193 0.8% Scotch-Irish187 0.8% Portuguese153 0.7% Scottish140 0.6% French138 0.6% Swedish123 0.5% Jordanian120 0.5% Scandinavian119 0.5% British108 0.5% Canadian107 0.5% Iraqi63 0.3% Israeli60 0.3% Turkish59 0.3% Eastern European55 0.2% Kenyan54 0.2% Swiss53 0.2% Danish52 0.2% French Canadian49 0.2% Armenian44 0.2% Welsh36 0.2% Greek26 0.1% Czech23 0.1% Belgian21 0.09% Lebanese21 0.09% Finnish14 0.06% African11 0.05% Albanian11 0.05% Somali6 0.03% Lithuanian5 0.02% Croatian4 0.02% Pennsylvania German2 0.01% Ethiopian
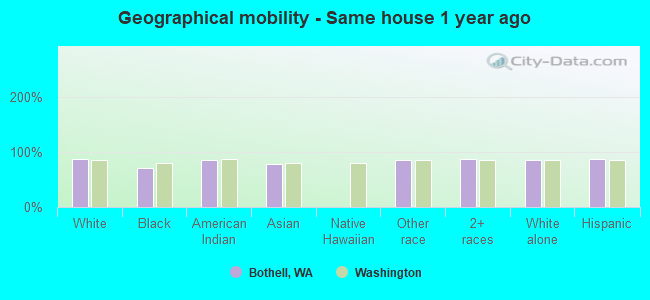
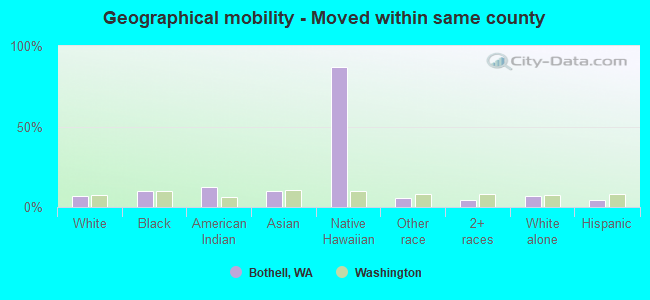
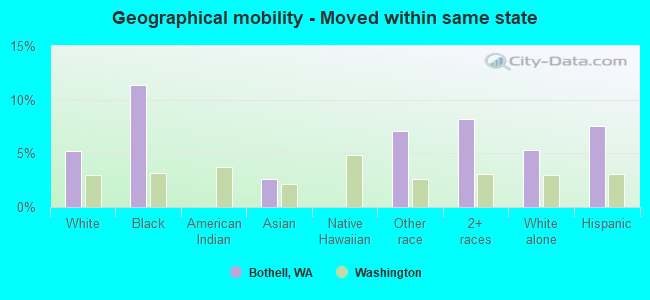
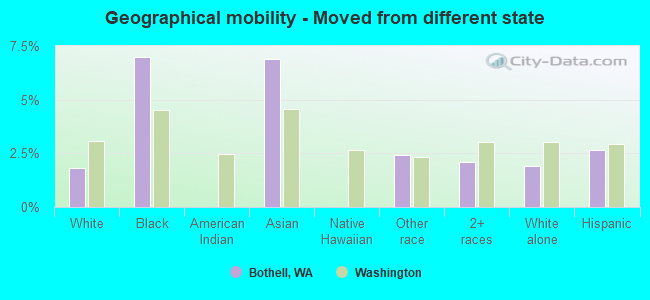
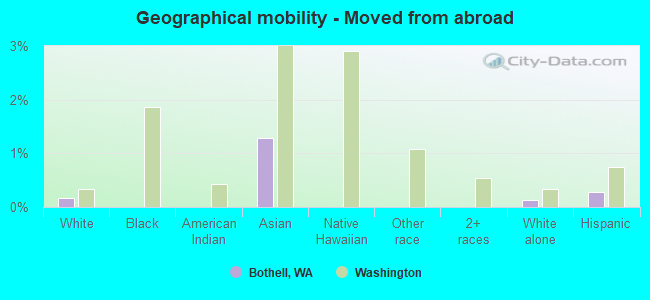
Geographical mobility in Bothell Same house 1 year ago 26,161 86.7% White (Caucasian)298 70.8% Black or African American26 86.3% American Indian / Alaska Native7,466 78.3% Asian1,889 85.1% Other race4,308 87.8% Two or more races25,549 86.2% White alone, not Hispanic / Latino4,012 86.9% Hispanic or LatinoMoved within same county 2,026 6.7% White / Caucasian43 10.2% Black or African American4 12.6% American Indian / Alaska Native975 10.2% Asian16 87.0% Native Hawaiian / Pacific Islander129 5.8% Other race204 4.2% Two or more races2,050 6.9% White alone, not Hispanic / Latino192 4.2% Hispanic or LatinoMoved within same state 1,563 5.2% White / Caucasian48 11.4% Black or African American245 2.6% Asian158 7.1% Other race404 8.2% Two or more races1,586 5.4% White alone, not Hispanic / Latino347 7.5% Hispanic or LatinoMoved from different state 544 1.8% White / Caucasian29 7.0% Black or African American657 6.9% Asian54 2.4% Other race102 2.1% Two or more races561 1.9% White alone, not Hispanic / Latino123 2.7% Hispanic or LatinoMoved from abroad 49 0.2% White123 1.3% Asian38 0.1% White alone, not Hispanic / Latino13 0.3% Hispanic or Latino
Children Nativity (place of birth) in Bothell
Children under 6 years - Living with two parents Both parents native 1,279 100.0% NativeBoth parents foreign-born 956 92.9% Native73 7.1% Foreign-bornOne native, one foreign-born parent 278 100.0% NativeChildren under 6 years - Living with one parent Native parent 350 100.0% NativeForeign-born parent 25 100.0% NativeChildren 6 to 17 years - Living with two parents Both parents native 2,938 99.7% Native10 0.3% Foreign-bornBoth parents foreign-born 2,263 85.2% Native395 14.8% Foreign-bornOne native, one foreign-born parent 790 100.0% NativeChildren 6 to 17 years - Living with one parent Native parent 983 100.0% NativeForeign-born parent 275 54.9% Native226 45.1% Foreign-born
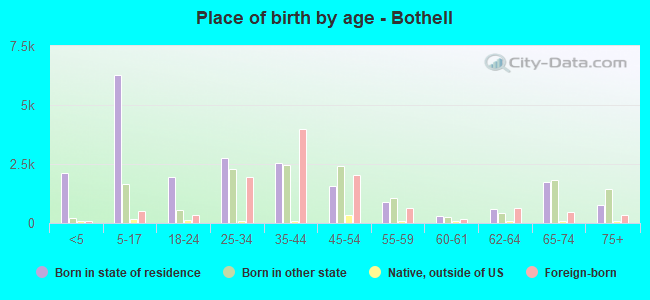
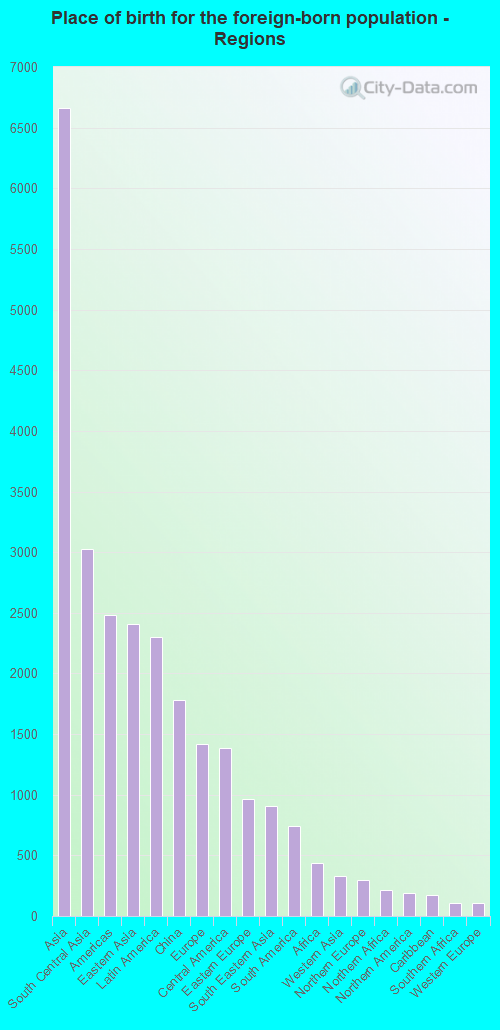
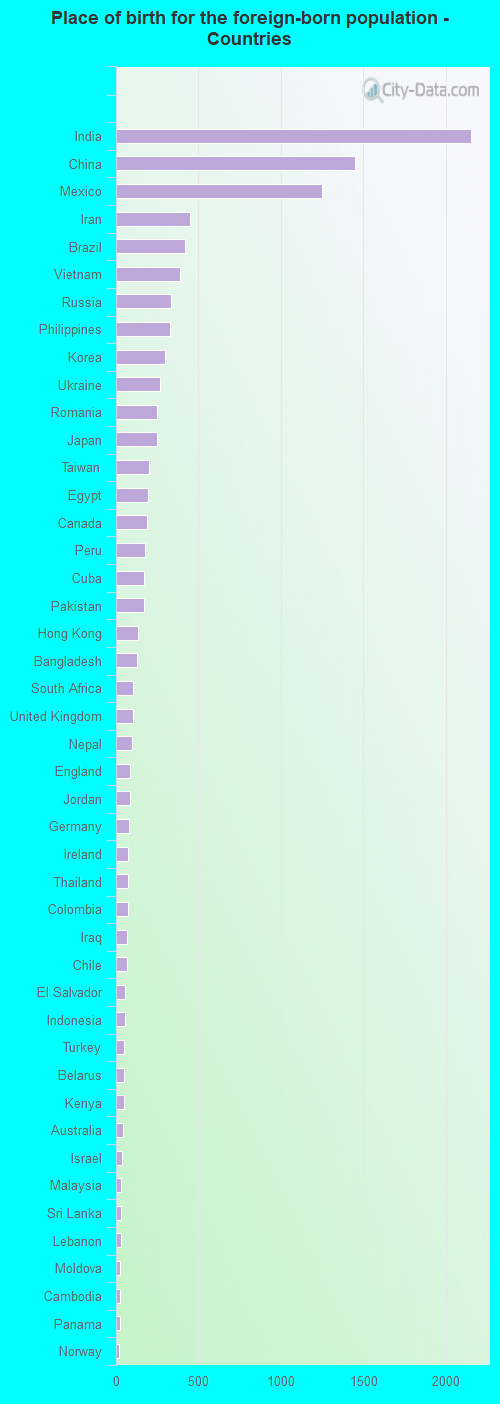
Place of birth for residents in Bothell 6,666 Asia3,027 South Central Asia2,483 Americas2,406 Eastern Asia2,297 Latin America1,781 China1,418 Europe1,384 Central America963 Eastern Europe906 South Eastern Asia741 South America439 Africa326 Western Asia295 Northern Europe217 Northern Africa186 Northern America171 Caribbean106 Southern Africa105 Western Europe59 Oceania51 Eastern Africa40 Australia and New Zealand Subregion19 Middle Africa15 Western Africa5 Southern Europe2,155 India1,449 China1,247 Mexico448 Iran418 Brazil389 Vietnam331 Russia330 Philippines295 Korea266 Ukraine251 Romania246 Japan198 Taiwan192 Egypt186 Canada176 Peru171 Cuba167 Pakistan134 Hong Kong126 Bangladesh106 South Africa102 United Kingdom97 Nepal84 England83 Jordan77 Germany74 Ireland72 Thailand72 Colombia65 Iraq65 Chile56 El Salvador53 Indonesia48 Turkey47 Belarus47 Kenya40 Australia35 Israel32 Malaysia30 Sri Lanka28 Lebanon25 Moldova23 Cambodia23 Panama20 Norway19 Congo18 Armenia17 Belgium16 Saudi Arabia16 Yemen15 Nigeria14 Bulgaria14 Costa Rica12 Albania12 Nicaragua12 Sweden12 Kuwait11 Belize10 Czechoslovakia10 France9 Honduras9 Venezuela8 Guatemala6 Laos5 Spain4 Ethiopia4 Poland
Grandparents responsible for own grandchildren in Bothell
Grandparents (30 to 59 years) White / Caucasian 11 12.2% Responsible for grandchildren79 87.8% Not responsible for grandchildrenAsian 7 100.0% Responsible for grandchildrenWhite alone, not Hispanic / Latino 11 11.2% Responsible for grandchildren87 88.8% Not responsible for grandchildrenGrandparents (60 years and over) White / Caucasian 71 31.1% Responsible for grandchildren157 68.9% Not responsible for grandchildrenAsian 13 14.1% Responsible for grandchildren80 85.9% Not responsible for grandchildrenWhite alone, not Hispanic / Latino 70 30.6% Responsible for grandchildren159 69.4% Not responsible for grandchildren