Races in Bountiful, Utah (UT) Detailed Stats
Data:
Races - White alone (%)
Races - White alone (% change since 2000)
Races - Black alone (%)
Races - Black alone (% change since 2000)
Races - American Indian alone (%)
Races - American Indian alone (% change since 2000)
Races - Asian alone (%)
Races - Asian alone (% change since 2000)
Races - Hispanic (%)
Races - Hispanic (% change since 2000)
Races - Native Hawaiian and Other Pacific Islander alone (%)
Races - Native Hawaiian and Other Pacific Islander alone (% change since 2000)
Races - Two or more races(%)
Races - Two or more races(% change since 2000)
Races - Other race alone (%)
Races - Other race alone (% change since 2000)
Racial diversity
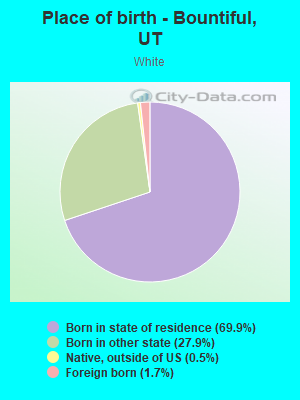
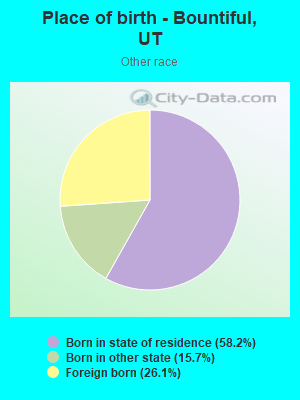
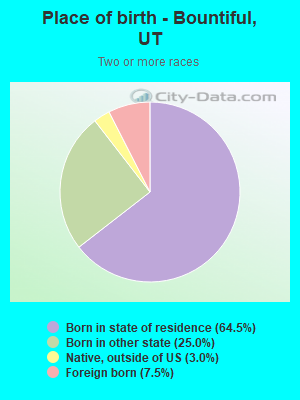
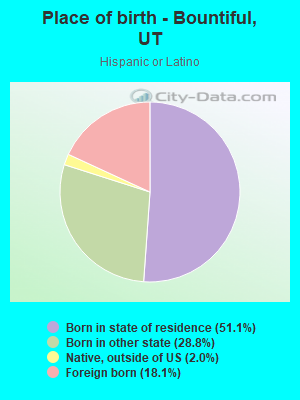
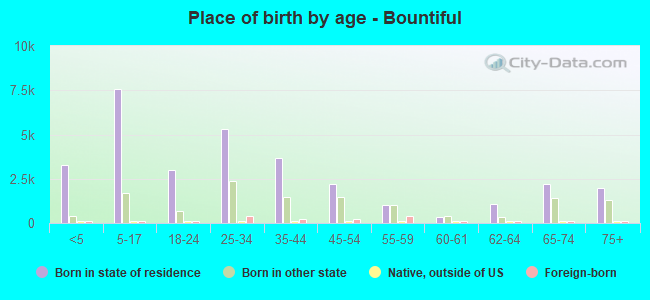
Place of birth - Born in state of residence (%)
Place of birth - Born in state of residence (%) - White
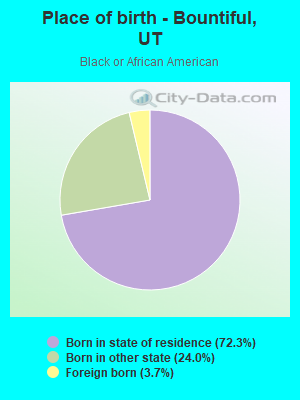
Place of birth - Born in state of residence (%) - Black or African American
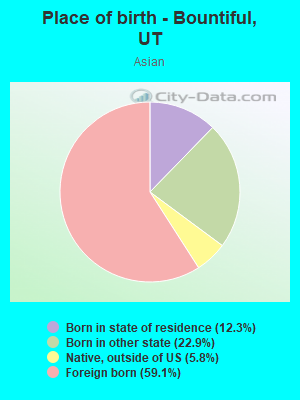
Place of birth - Born in state of residence (%) - Asian
Place of birth - Born in state of residence (%) - Hispanic or Latino
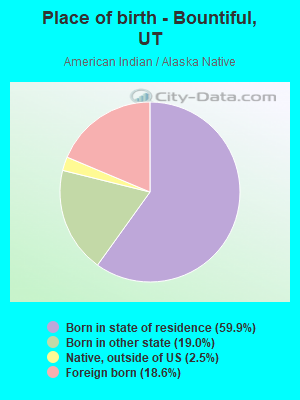
Place of birth - Born in state of residence (%) - American Indian and Alaska Native
Place of birth - Born in state of residence (%) - Multirace
Place of birth - Born in state of residence (%) - Other Race
Place of birth - Born in other state (%)
Place of birth - Born in other state (%) - White
Place of birth - Born in other state (%) - Black or African American
Place of birth - Born in other state (%) - Asian
Place of birth - Born in other state (%) - Hispanic or Latino
Place of birth - Born in other state (%) - American Indian and Alaska Native
Place of birth - Born in other state (%) - Multirace
Place of birth - Born in other state (%) - Other Race
Place of birth - Native, outside of US (%)
Place of birth - Native, outside of US (%) - White
Place of birth - Native, outside of US (%) - Black or African American
Place of birth - Native, outside of US (%) - Asian
Place of birth - Native, outside of US (%) - Hispanic or Latino
Place of birth - Native, outside of US (%) - American Indian and Alaska Native
Place of birth - Native, outside of US (%) - Multirace
Place of birth - Native, outside of US (%) - Other Race
Place of birth - Foreign born (%)
Place of birth - Foreign born (%) - White
Place of birth - Foreign born (%) - Black or African American
Place of birth - Foreign born (%) - Asian
Place of birth - Foreign born (%) - Hispanic or Latino
Place of birth - Foreign born (%) - American Indian and Alaska Native
Place of birth - Foreign born (%) - Multirace
Place of birth - Foreign born (%) - Other Race
Residents speaking English at home (%)
Residents speaking English at home - Born in the United States (%)
Residents speaking English at home - Native, born elsewhere (%)
Residents speaking English at home - Foreign born (%)
Residents speaking Spanish at home (%)
Residents speaking Spanish at home - Born in the United States (%)
Residents speaking Spanish at home - Native, born elsewhere (%)
Residents speaking Spanish at home - Foreign born (%)
Residents speaking other language at home (%)
Residents speaking other language at home - Born in the United States (%)
Residents speaking other language at home - Native, born elsewhere (%)
Residents speaking other language at home - Foreign born (%)
Marital status - Never married (%)
Marital status - Now married (%)
Marital status - Separated (%)
Marital status - Widowed (%)
Marital status - Divorced (%)
Ancestries Reported - Arab (%)
Ancestries Reported - Czech (%)
Ancestries Reported - Danish (%)
Ancestries Reported - Dutch (%)
Ancestries Reported - English (%)
Ancestries Reported - French (%)
Ancestries Reported - French Canadian (%)
Ancestries Reported - German (%)
Ancestries Reported - Greek (%)
Ancestries Reported - Hungarian (%)
Ancestries Reported - Irish (%)
Ancestries Reported - Italian (%)
Ancestries Reported - Lithuanian (%)
Ancestries Reported - Norwegian (%)
Ancestries Reported - Polish (%)
Ancestries Reported - Portuguese (%)
Ancestries Reported - Russian (%)
Ancestries Reported - Scotch-Irish (%)
Ancestries Reported - Scottish (%)
Ancestries Reported - Slovak (%)
Ancestries Reported - Subsaharan African (%)
Ancestries Reported - Swedish (%)
Ancestries Reported - Swiss (%)
Ancestries Reported - Ukrainian (%)
Ancestries Reported - United States (%)
Ancestries Reported - Welsh (%)
Ancestries Reported - West Indian (%)
Ancestries Reported - Other (%)
Geographical mobility - Same house 1 year ago (%)
Geographical mobility - Same house 1 year ago (%) - White
Geographical mobility - Same house 1 year ago (%) - Black or African American
Geographical mobility - Same house 1 year ago (%) - Asian
Geographical mobility - Same house 1 year ago (%) - Hispanic or Latino
Geographical mobility - Same house 1 year ago (%) - American Indian and Alaska Native
Geographical mobility - Same house 1 year ago (%) - Multirace
Geographical mobility - Same house 1 year ago (%) - Other Race
Geographical mobility - Moved within same county (%)
Geographical mobility - Moved within same county (%) - White
Geographical mobility - Moved within same county (%) - Black or African American
Geographical mobility - Moved within same county (%) - Asian
Geographical mobility - Moved within same county (%) - Hispanic or Latino
Geographical mobility - Moved within same county (%) - American Indian and Alaska Native
Geographical mobility - Moved within same county (%) - Multirace
Geographical mobility - Moved within same county (%) - Other Race
Geographical mobility - Moved from different county within same state (%)
Geographical mobility - Moved from different county within same state (%) - White
Geographical mobility - Moved from different county within same state (%) - Black or African American
Geographical mobility - Moved from different county within same state (%) - Asian
Geographical mobility - Moved from different county within same state (%) - Hispanic or Latino
Geographical mobility - Moved from different county within same state (%) - American Indian and Alaska Native
Geographical mobility - Moved from different county within same state (%) - Multirace
Geographical mobility - Moved from different county within same state (%) - Other Race
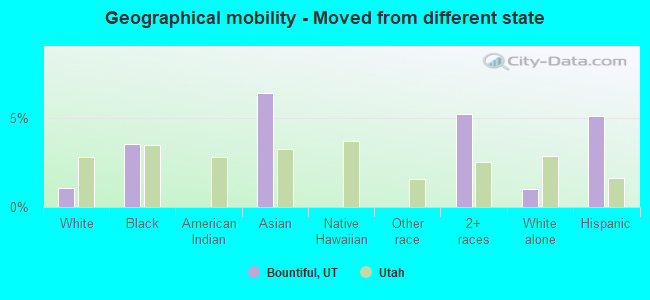
Geographical mobility - Moved from different state (%)
Geographical mobility - Moved from different state (%) - White
Geographical mobility - Moved from different state (%) - Black or African American
Geographical mobility - Moved from different state (%) - Asian
Geographical mobility - Moved from different state (%) - Hispanic or Latino
Geographical mobility - Moved from different state (%) - American Indian and Alaska Native
Geographical mobility - Moved from different state (%) - Multirace
Geographical mobility - Moved from different state (%) - Other Race
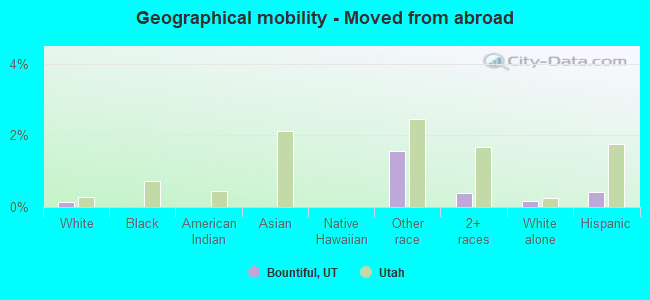
Geographical mobility - Moved from abroad (%)
Geographical mobility - Moved from abroad (%) - White
Geographical mobility - Moved from abroad (%) - Black or African American
Geographical mobility - Moved from abroad (%) - Asian
Geographical mobility - Moved from abroad (%) - Hispanic or Latino
Geographical mobility - Moved from abroad (%) - American Indian and Alaska Native
Geographical mobility - Moved from abroad (%) - Multirace
Geographical mobility - Moved from abroad (%) - Other Race
Place of birth for the foreign-born population - Ireland (%)
Place of birth for the foreign-born population - Denmark (%)
Place of birth for the foreign-born population - Norway (%)
Place of birth for the foreign-born population - Sweden (%)
Place of birth for the foreign-born population - United Kingdom (%)
Place of birth for the foreign-born population - England (%)
Place of birth for the foreign-born population - Scotland (%)
Place of birth for the foreign-born population - Other Northern Europe (%)
Place of birth for the foreign-born population - Austria (%)
Place of birth for the foreign-born population - Belgium (%)
Place of birth for the foreign-born population - France (%)
Place of birth for the foreign-born population - Germany (%)
Place of birth for the foreign-born population - Netherlands (%)
Place of birth for the foreign-born population - Switzerland (%)
Place of birth for the foreign-born population - Other Western Europe (%)
Place of birth for the foreign-born population - Greece (%)
Place of birth for the foreign-born population - Italy (%)
Place of birth for the foreign-born population - Portugal (%)
Place of birth for the foreign-born population - Spain (%)
Place of birth for the foreign-born population - Other Southern Europe (%)
Place of birth for the foreign-born population - Albania (%)
Place of birth for the foreign-born population - Belarus (%)
Place of birth for the foreign-born population - Bosnia and Herzegovina (%)
Place of birth for the foreign-born population - Bulgaria (%)
Place of birth for the foreign-born population - Croatia (%)
Place of birth for the foreign-born population - Czechoslovakia (%)
Place of birth for the foreign-born population - Hungary (%)
Place of birth for the foreign-born population - Latvia (%)
Place of birth for the foreign-born population - Lithuania (%)
Place of birth for the foreign-born population - North Macedonia (Macedonia) (%)
Place of birth for the foreign-born population - Moldova (%)
Place of birth for the foreign-born population - Poland (%)
Place of birth for the foreign-born population - Romania (%)
Place of birth for the foreign-born population - Russia (%)
Place of birth for the foreign-born population - Serbia (%)
Place of birth for the foreign-born population - Ukraine (%)
Place of birth for the foreign-born population - Other Eastern Europe (%)
Place of birth for the foreign-born population - China (%)
Place of birth for the foreign-born population - Hong Kong (%)
Place of birth for the foreign-born population - Taiwan (%)
Place of birth for the foreign-born population - Japan (%)
Place of birth for the foreign-born population - Korea (%)
Place of birth for the foreign-born population - Other Eastern Asia (%)
Place of birth for the foreign-born population - Afghanistan (%)
Place of birth for the foreign-born population - Bangladesh (%)
Place of birth for the foreign-born population - India (%)
Place of birth for the foreign-born population - Iran (%)
Place of birth for the foreign-born population - Kazakhstan (%)
Place of birth for the foreign-born population - Nepal (%)
Place of birth for the foreign-born population - Pakistan (%)
Place of birth for the foreign-born population - Sri Lanka (%)
Place of birth for the foreign-born population - Uzbekistan (%)
Place of birth for the foreign-born population - Other South Central Asia (%)
Place of birth for the foreign-born population - Burma (%)
Place of birth for the foreign-born population - Cambodia (%)
Place of birth for the foreign-born population - Indonesia (%)
Place of birth for the foreign-born population - Laos (%)
Place of birth for the foreign-born population - Malaysia (%)
Place of birth for the foreign-born population - Philippines (%)
Place of birth for the foreign-born population - Singapore (%)
Place of birth for the foreign-born population - Thailand (%)
Place of birth for the foreign-born population - Vietnam (%)
Place of birth for the foreign-born population - Other South Eastern Asia (%)
Place of birth for the foreign-born population - Armenia (%)
Place of birth for the foreign-born population - Iraq (%)
Place of birth for the foreign-born population - Israel (%)
Place of birth for the foreign-born population - Jordan (%)
Place of birth for the foreign-born population - Kuwait (%)
Place of birth for the foreign-born population - Lebanon (%)
Place of birth for the foreign-born population - Saudi Arabia (%)
Place of birth for the foreign-born population - Syria (%)
Place of birth for the foreign-born population - Turkey (%)
Place of birth for the foreign-born population - Yemen (%)
Place of birth for the foreign-born population - Other Western Asia (%)
Place of birth for the foreign-born population - Eritrea (%)
Place of birth for the foreign-born population - Ethiopia (%)
Place of birth for the foreign-born population - Kenya (%)
Place of birth for the foreign-born population - Somalia (%)
Place of birth for the foreign-born population - Uganda (%)
Place of birth for the foreign-born population - Zimbabwe (%)
Place of birth for the foreign-born population - Other Eastern Africa (%)
Place of birth for the foreign-born population - Cameroon (%)
Place of birth for the foreign-born population - Congo (%)
Place of birth for the foreign-born population - Democratic Republic of Congo (Zaire) (%)
Place of birth for the foreign-born population - Other Middle Africa (%)
Place of birth for the foreign-born population - Egypt (%)
Place of birth for the foreign-born population - Morocco (%)
Place of birth for the foreign-born population - Sudan (%)
Place of birth for the foreign-born population - Other Northern Africa (%)
Place of birth for the foreign-born population - South Africa (%)
Place of birth for the foreign-born population - Other Southern Africa (%)
Place of birth for the foreign-born population - Cabo Verde (%)
Place of birth for the foreign-born population - Ghana (%)
Place of birth for the foreign-born population - Liberia (%)
Place of birth for the foreign-born population - Nigeria (%)
Place of birth for the foreign-born population - Senegal (%)
Place of birth for the foreign-born population - Sierra Leone (%)
Place of birth for the foreign-born population - Other Western Africa (%)
Place of birth for the foreign-born population - Australia (%)
Place of birth for the foreign-born population - New Zealand (%)
Place of birth for the foreign-born population - Fiji (%)
Place of birth for the foreign-born population - Micronesia (%)
Place of birth for the foreign-born population - Bahamas (%)
Place of birth for the foreign-born population - Barbados (%)
Place of birth for the foreign-born population - Cuba (%)
Place of birth for the foreign-born population - Dominica (%)
Place of birth for the foreign-born population - Dominican Republic (%)
Place of birth for the foreign-born population - Grenada (%)
Place of birth for the foreign-born population - Haiti (%)
Place of birth for the foreign-born population - Jamaica (%)
Place of birth for the foreign-born population - St. Vincent and the Grenadines (%)
Place of birth for the foreign-born population - Trinidad and Tobago (%)
Place of birth for the foreign-born population - West Indies (%)
Place of birth for the foreign-born population - Other Caribbean (%)
Place of birth for the foreign-born population - Belize (%)
Place of birth for the foreign-born population - Costa Rica (%)
Place of birth for the foreign-born population - El Salvador (%)
Place of birth for the foreign-born population - Guatemala (%)
Place of birth for the foreign-born population - Honduras (%)
Place of birth for the foreign-born population - Mexico (%)
Place of birth for the foreign-born population - Nicaragua (%)
Place of birth for the foreign-born population - Panama (%)
Place of birth for the foreign-born population - Other Central America (%)
Place of birth for the foreign-born population - Argentina (%)
Place of birth for the foreign-born population - Bolivia (%)
Place of birth for the foreign-born population - Brazil (%)
Place of birth for the foreign-born population - Chile (%)
Place of birth for the foreign-born population - Colombia (%)
Place of birth for the foreign-born population - Ecuador (%)
Place of birth for the foreign-born population - Guyana (%)
Place of birth for the foreign-born population - Peru (%)
Place of birth for the foreign-born population - Uruguay (%)
Place of birth for the foreign-born population - Venezuela (%)
Place of birth for the foreign-born population - Other South America (%)
Place of birth for the foreign-born population - Canada (%)
Place of birth for the foreign-born population - Other Northern America (%)
Place of birth for the foreign-born population - Other (%)
Latest news about races in Bountiful, UT collected exclusively by city-data.com from local newspapers, TV, and radio stations
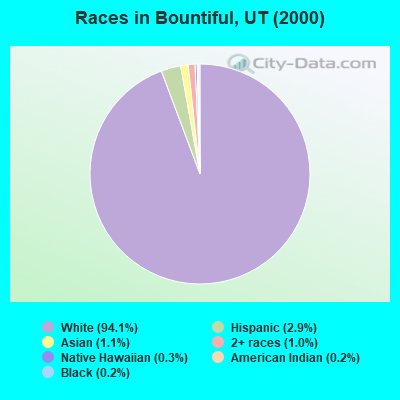
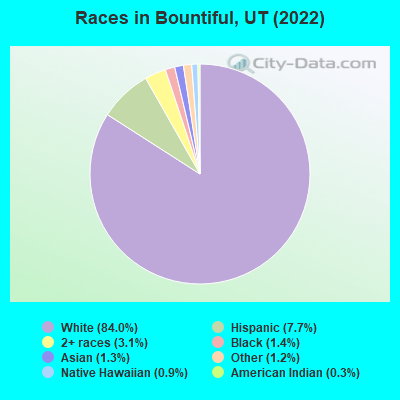
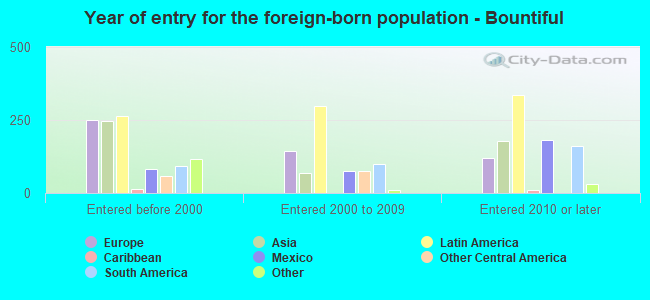
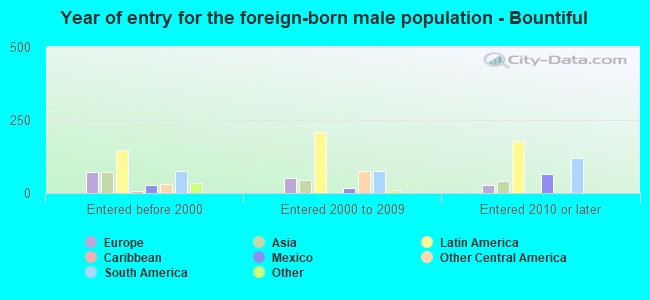
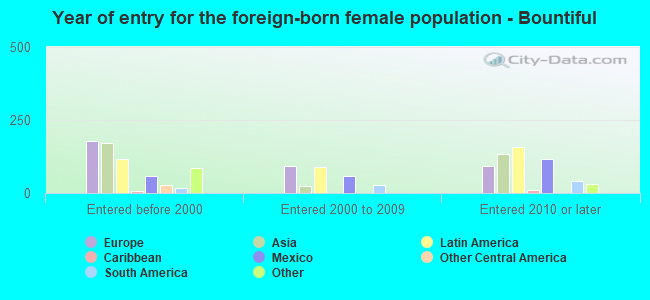
According to 2022 data, the most numerous races in Bountiful, UT are White alone (38,818 residents), Hispanic (3,546 residents), and Two or more races (1,417 residents). 89.6% of Bountiful residents speak English at home. 4.5% of Bountiful, UT residents are foreign-born (1.8% born in Latin America, 1.1% born in Europe, 1.0% born in Asia), which is 77.4% less than the foreign-born rate of 8.0% across the entire state of Utah.
Race distribution in Bountiful
2000 2022
1,904,265 85.3% White alone 201,559 9.0% Hispanic 36,483 1.6% Asian alone 31,308 1.4% Two or more races 26,663 1.2% American Indian alone 14,806 0.7% Native Hawaiian and Other 16,137 0.7% Black alone 1,948 0.09% Other race alone
2,557,466 75.6% White alone 512,086 15.1% Hispanic 119,308 3.5% Two or more races 82,388 2.4% Asian alone 36,978 1.1% Native Hawaiian and Other 34,873 1.0% Black alone 22,803 0.7% American Indian alone 14,898 0.4% Other race alone
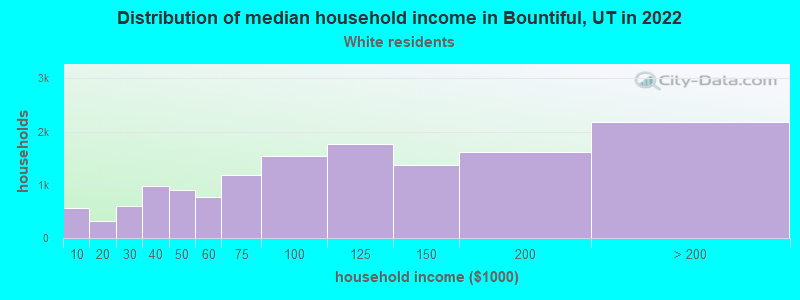
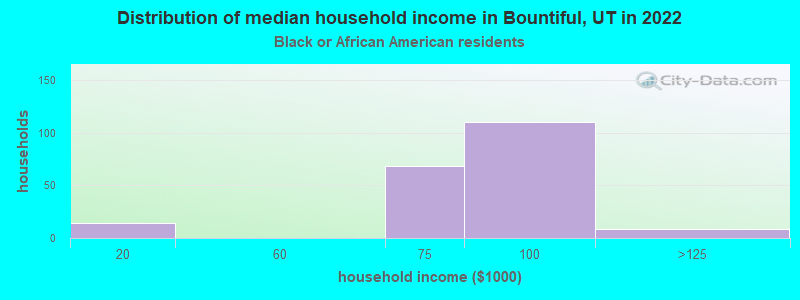
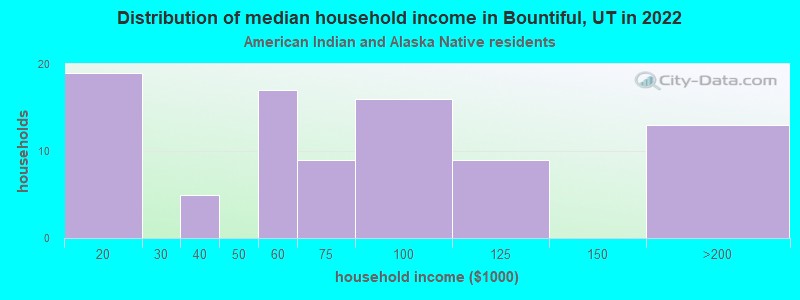
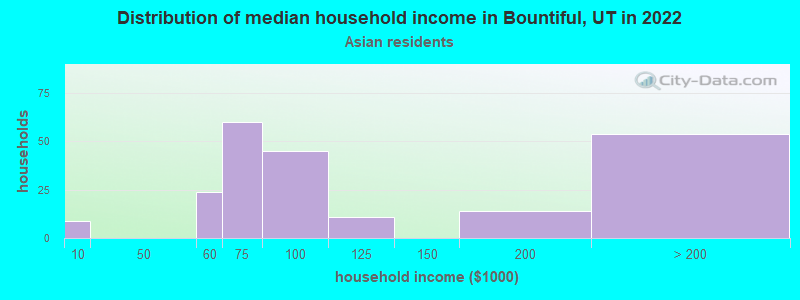
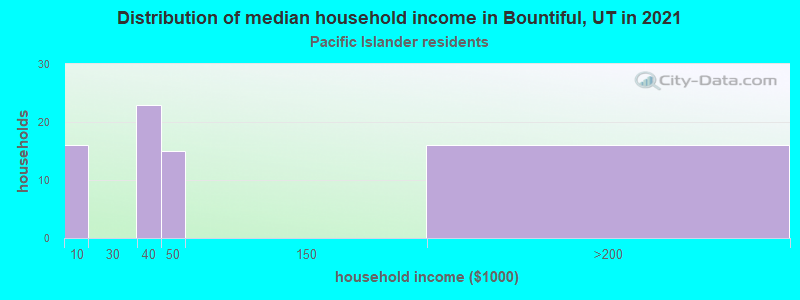
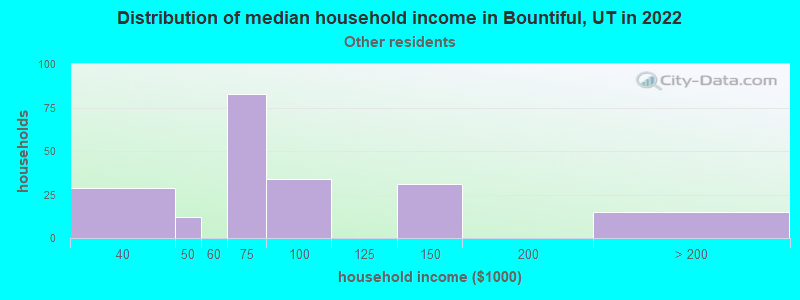
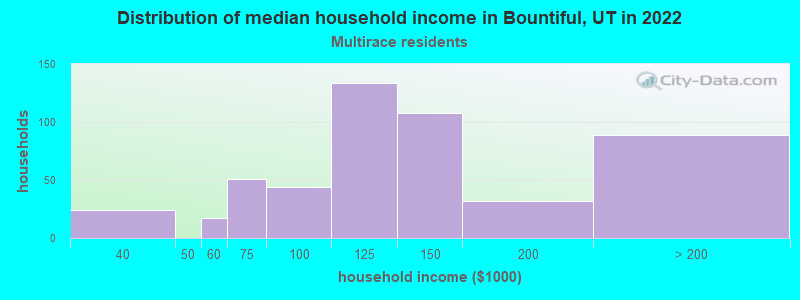
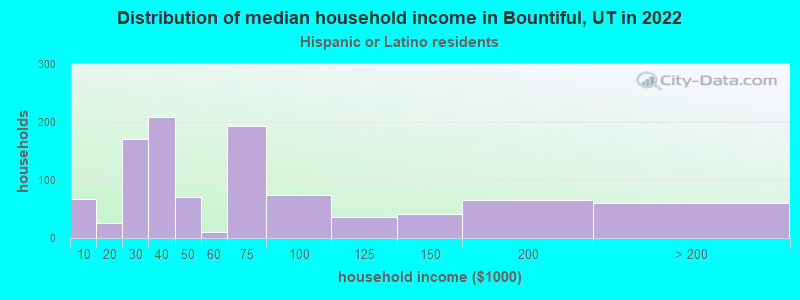
Income and house value in Bountiful Median household income in 2022 $102,267 White non-Hispanic householders$72,597 Black householders$83,980 American Indian and Alaska Native householders$80,399 Asian householders$48,372 Native Hawaiian and other Pacific Islander householders$62,190 Some other race householders$146,009 Two or more races householders$42,281 Hispanic or Latino race householdersMedian 2022 house value $564,651 White Non-Hispanic householders $691,658 Asian householders$439,884 Native Hawaiian and other Pacific Islander householders$519,863 Some other race householders$500,028 Two or more races householders$538,738 Hispanic or Latino householders
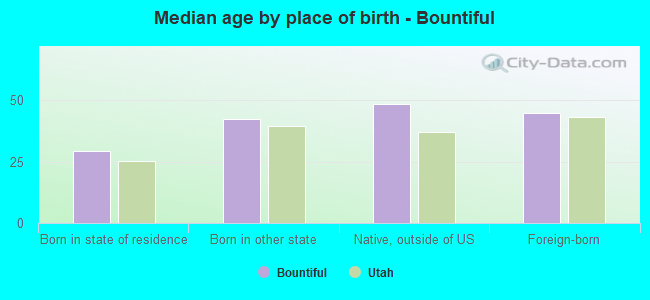
Median age by race in Bountiful
34.2 Median age for White residents34.4 34.4 19.9 Median age for Black or African American residents25.5 18.8 20.2 Median age for American Indian / Alaska Native residents26.3 13.4 41.0 Median age for Asian residents43.3 40.1 29.5 Median age for Native Hawaiian / Pacific Islander residents31.8 17.7 30.4 Median age for Other race residents30.6 27.2 23.0 Median age for Two or more races residents25.4 21.7 34.6 Median age for White alone residents34.3 35.0 23.2 Median age for Hispanic or Latino residents26.5 21.0
Owner/renter occupied households by race in Bountiful
House owners and renters - White residents 10,447 75.7% Owner occupied3,355 24.3% Renter occupiedHouse owners and renters - Black or African American residents 34 13.9% Owner occupied210 86.1% Renter occupiedHouse owners and renters - American Indian / Alaska Native residents 30 27.7% Owner occupied79 72.3% Renter occupiedHouse owners and renters - Asian residents 90 40.8% Owner occupied131 59.2% Renter occupiedHouse owners and renters - Native Hawaiian / Pacific Islander residents 38 51.3% Owner occupied36 48.7% Renter occupiedHouse owners and renters - Other race residents 114 51.4% Owner occupied108 48.6% Renter occupiedHouse owners and renters - Two or more races residents 158 38.2% Owner occupied256 61.8% Renter occupiedHouse owners and renters - White alone residents 10,377 78.2% Owner occupied2,887 21.8% Renter occupiedHouse owners and renters - Hispanic or Latino residents 263 27.6% Owner occupied688 72.4% Renter occupied
Language usage in Bountiful
English speakers - Total 89.6% of residents of Bountiful speak English at home.
5.4% of residents speak Spanish at home 2,012 87.1% Speak English very well297 12.9% Speak English less than very well5.4% of residents speak other language at home 2,094 91.2% Speak English very well203 8.8% Speak English less than very well
English speakers - Born in the United States 89.7% of residents of Bountiful speak English at home.
7.2% of residents speak Spanish at home 855 96.4% Speak English very well32 3.6% Speak English less than very well3.0% of residents speak other language at home 366 100.0% Speak English very well
English speakers - Native, born elsewhere 66.6% of residents of Bountiful speak English at home.
19.0% of residents speak Spanish at home 50 79.4% Speak English very well13 20.6% Speak English less than very well12.0% of residents speak other language at home 40 100.0% Speak English very well
English speakers - Foreign-born 16.1% of residents of Bountiful speak English at home.
35.1% of residents speak Spanish at home 382 68.3% Speak English very well177 31.7% Speak English less than very well54.7% of residents speak other language at home 740 85.1% Speak English very well130 14.9% Speak English less than very well
White (Caucasian) - Speak only English Native:
94.9% (35,039)Foreign-born:
17.5% (117)
White (Caucasian) - Speak another language Native:
5.1% (1,887)Foreign-born:
86.4% (580)
American Indian / Alaska Native - Speak another language Native:
23.4% (32)Foreign-born:
96.1% (38)
Asian - Speak only English Native:
32.3% (85)Foreign-born:
13.0% (50)
Asian - Speak another language Native:
100.0% (264)Foreign-born:
81.4% (315)
Native Hawaiian / Pacific Islander - Speak only English Native:
76.3% (271)Foreign-born:
74.0% (2)
Other race - Speak only English Native:
55.8% (347)Foreign-born:
38.0% (93)
Other race - Speak another language Native:
43.7% (272)Foreign-born:
72.3% (178)
Two or more races - Speak only English Native:
73.5% (1,510)Foreign-born:
10.3% (19)
Two or more races - Speak another language Native:
27.1% (558)Foreign-born:
90.9% (171)
White alone - Speak only English Native:
95.6% (33,847)Foreign-born:
26.8% (124)
White alone - Speak another language Native:
4.6% (1,628)Foreign-born:
83.6% (388)
Hispanic or Latino - Speak only English Native:
63.3% (1,684)Foreign-born:
11.3% (72)
Hispanic or Latino - Speak another language Native:
36.7% (976)Foreign-born:
88.3% (564)
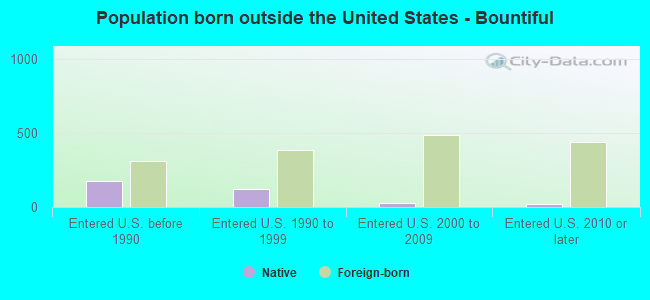
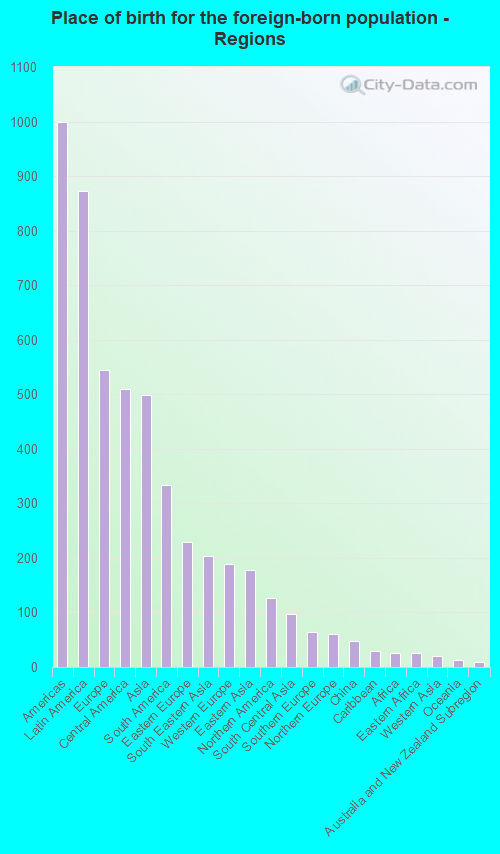
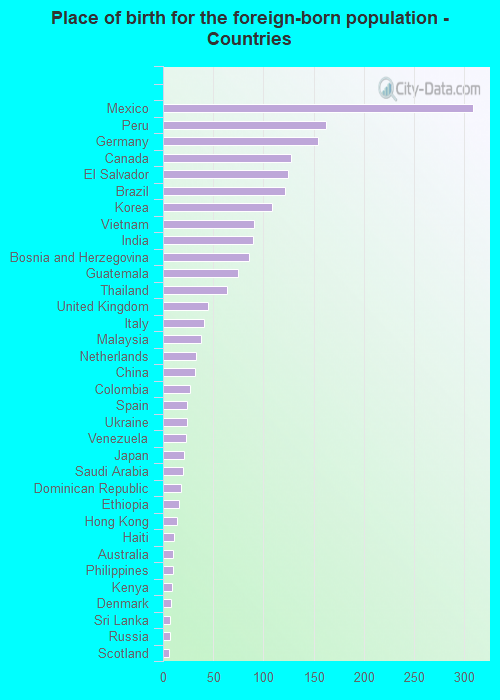
Foreign-born residents in Bountiful 2,084 residents are foreign born (1.8% Latin America , 1.1% Europe , 1.0% Asia ).
Marital status for residents in Bountiful Marital status - White (Caucasian) population 15 years and over
Males 24.8% Never married63.6% Now married0.8% Separated2.0% Widowed8.7% DivorcedFemales 23.4% Never married58.9% Now married1.1% Separated8.4% Widowed8.1% DivorcedWomen who gave birth in the past 12 months Now married:
100.0% (577)Unmarried:
0.0% (0)
Women who did not give birth in the past 12 months Now married:
55.6% (4,945)Unmarried:
44.4% (3,949)
Marital status - Black or African American population 15 years and over
Males 68.4% Never married25.2% Now married0.0% Separated0.0% Widowed6.5% DivorcedFemales 53.8% Never married38.6% Now married0.0% Separated0.0% Widowed7.6% DivorcedWomen who gave birth in the past 12 months Now married:
100.0% (58)Unmarried:
0.0% (0)
Women who did not give birth in the past 12 months Now married:
0.0% (0)Unmarried:
100.0% (118)
Marital status - American Indian / Alaska Native population 15 years and over
Males 44.4% Never married36.5% Now married0.0% Separated0.0% Widowed19.0% DivorcedFemales 82.4% Never married17.6% Now married0.0% Separated0.0% Widowed0.0% DivorcedWomen who gave birth in the past 12 months Now married:
100.0% (10)Unmarried:
0.0% (0)
Women who did not give birth in the past 12 months Now married:
6.2% (4)Unmarried:
93.8% (66)
Marital status - Asian population 15 years and over
Males 24.7% Never married66.7% Now married0.0% Separated0.0% Widowed8.6% DivorcedFemales 30.1% Never married54.5% Now married0.0% Separated9.7% Widowed5.8% DivorcedWomen who gave birth in the past 12 months Now married:
100.0% (12)Unmarried:
0.0% (0)
Women who did not give birth in the past 12 months Now married:
44.3% (116)Unmarried:
55.7% (146)
Marital status - Native Hawaiian / Pacific Islander population 15 years and over
Males 0.0% Never married100.0% Now married0.0% Separated0.0% Widowed0.0% DivorcedFemales 21.4% Never married38.5% Now married0.0% Separated0.0% Widowed40.2% DivorcedWomen who gave birth in the past 12 months Now married:
100.0% (20)Unmarried:
0.0% (0)
Women who did not give birth in the past 12 months Now married:
28.6% (17)Unmarried:
71.4% (43)
Marital status - Other race population 15 years and over
Males 50.7% Never married43.1% Now married0.0% Separated0.0% Widowed6.2% DivorcedFemales 11.0% Never married54.9% Now married0.0% Separated0.0% Widowed34.2% DivorcedWomen who did not give birth in the past 12 months Now married:
68.4% (112)Unmarried:
31.6% (52)
Marital status - Two or more races population 15 years and over
Males 48.4% Never married48.0% Now married0.0% Separated0.0% Widowed3.6% DivorcedFemales 52.5% Never married41.6% Now married0.0% Separated3.7% Widowed2.2% DivorcedWomen who gave birth in the past 12 months Now married:
100.0% (21)Unmarried:
0.0% (0)
Women who did not give birth in the past 12 months Now married:
34.4% (250)Unmarried:
65.6% (476)
Marital status - White alone, not Hispanic / Latino population 15 years and over
Males 24.9% Never married64.2% Now married0.8% Separated2.1% Widowed7.9% DivorcedFemales 22.8% Never married59.5% Now married1.2% Separated8.6% Widowed7.9% DivorcedWomen who gave birth in the past 12 months Now married:
100.0% (554)Unmarried:
0.0% (0)
Women who did not give birth in the past 12 months Now married:
56.4% (4,788)Unmarried:
43.6% (3,697)
Marital status - Hispanic or Latino population 15 years and over
Males 37.2% Never married45.4% Now married0.0% Separated0.0% Widowed17.4% DivorcedFemales 42.0% Never married39.6% Now married0.0% Separated5.0% Widowed13.4% DivorcedWomen who gave birth in the past 12 months Now married:
100.0% (28)Unmarried:
0.0% (0)
Women who did not give birth in the past 12 months Now married:
38.6% (323)Unmarried:
61.4% (513)
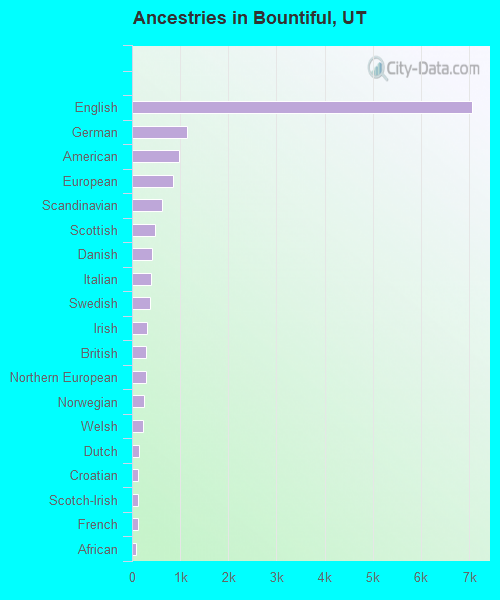
Ancestries in Bountiful
7,060 36.1% English1,151 5.9% German971 5.0% American851 4.4% European615 3.1% Scandinavian474 2.4% Scottish419 2.1% Danish386 2.0% Italian364 1.9% Swedish320 1.6% Irish294 1.5% British292 1.5% Northern European241 1.2% Norwegian229 1.2% Welsh148 0.8% Dutch132 0.7% Croatian126 0.6% Scotch-Irish120 0.6% French93 0.5% African61 0.3% Greek48 0.2% Serbian41 0.2% Ukrainian37 0.2% Polish30 0.2% Brazilian30 0.2% Canadian28 0.1% Swiss18 0.09% Lebanese18 0.09% Slavic17 0.09% Ethiopian16 0.08% Austrian15 0.08% Albanian15 0.08% Belgian15 0.08% Hungarian6 0.03% Australian5 0.03% Icelander2 0.01% Russian
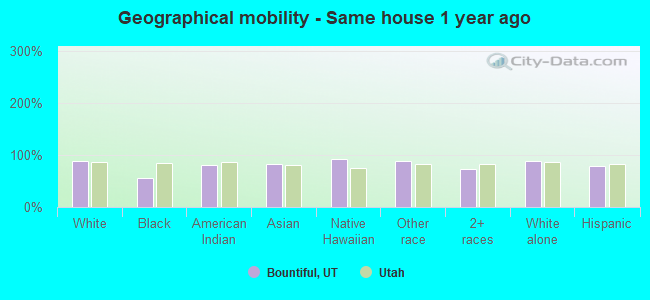
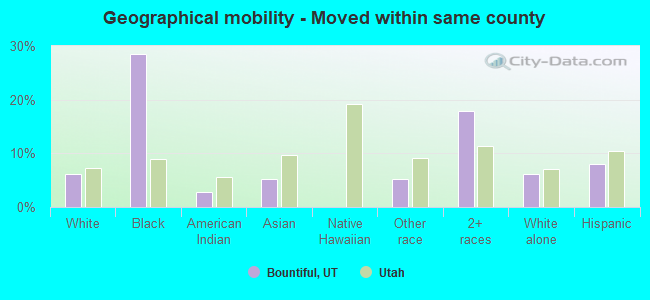
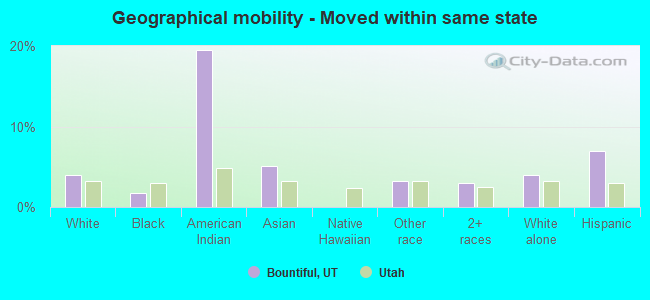
Geographical mobility in Bountiful Same house 1 year ago 35,501 88.3% White (Caucasian)291 56.6% Black or African American157 81.2% American Indian / Alaska Native563 83.3% Asian346 92.6% Native Hawaiian / Pacific Islander811 88.2% Other race1,790 73.4% Two or more races33,901 88.3% White alone, not Hispanic / Latino2,747 79.1% Hispanic or LatinoMoved within same county 2,464 6.1% White / Caucasian147 28.5% Black or African American6 2.8% American Indian / Alaska Native35 5.2% Asian49 5.3% Other race438 18.0% Two or more races2,395 6.2% White alone, not Hispanic / Latino279 8.0% Hispanic or LatinoMoved within same state 1,584 3.9% White / Caucasian9 1.7% Black or African American38 19.5% American Indian / Alaska Native34 5.1% Asian30 3.2% Other race73 3.0% Two or more races1,520 4.0% White alone, not Hispanic / Latino242 7.0% Hispanic or LatinoMoved from different state 435 1.1% White / Caucasian18 3.5% Black or African American43 6.4% Asian127 5.2% Two or more races383 1.0% White alone, not Hispanic / Latino177 5.1% Hispanic or LatinoMoved from abroad 61 0.2% White14 1.6% Other race9 0.4% Two or more races63 0.2% White alone, not Hispanic / Latino14 0.4% Hispanic or Latino
Children Nativity (place of birth) in Bountiful
Children under 6 years - Living with two parents Both parents native 3,554 100.0% NativeBoth parents foreign-born 30 52.6% Native27 47.4% Foreign-bornOne native, one foreign-born parent 149 100.0% NativeChildren under 6 years - Living with one parent Native parent 547 100.0% NativeForeign-born parent 24 100.0% NativeChildren 6 to 17 years - Living with two parents Both parents native 6,968 100.0% NativeBoth parents foreign-born 100 63.8% Native57 36.2% Foreign-bornOne native, one foreign-born parent 152 100.0% NativeChildren 6 to 17 years - Living with one parent Native parent 1,242 100.0% NativeForeign-born parent 131 49.2% Native135 50.8% Foreign-born
Grandparents responsible for own grandchildren in Bountiful
Grandparents (30 to 59 years) White / Caucasian 22 8.5% Responsible for grandchildren235 91.5% Not responsible for grandchildrenWhite alone, not Hispanic / Latino 25 10.3% Responsible for grandchildren219 89.7% Not responsible for grandchildrenGrandparents (60 years and over) White / Caucasian 28 7.2% Responsible for grandchildren358 92.8% Not responsible for grandchildrenWhite alone, not Hispanic / Latino 28 7.5% Responsible for grandchildren341 92.5% Not responsible for grandchildren