Races in Bourbonnais, Illinois (IL) Detailed Stats
Data:
Races - White alone (%)
Races - White alone (% change since 2000)
Races - Black alone (%)
Races - Black alone (% change since 2000)
Races - American Indian alone (%)
Races - American Indian alone (% change since 2000)
Races - Asian alone (%)
Races - Asian alone (% change since 2000)
Races - Hispanic (%)
Races - Hispanic (% change since 2000)
Races - Native Hawaiian and Other Pacific Islander alone (%)
Races - Native Hawaiian and Other Pacific Islander alone (% change since 2000)
Races - Two or more races(%)
Races - Two or more races(% change since 2000)
Races - Other race alone (%)
Races - Other race alone (% change since 2000)
Racial diversity
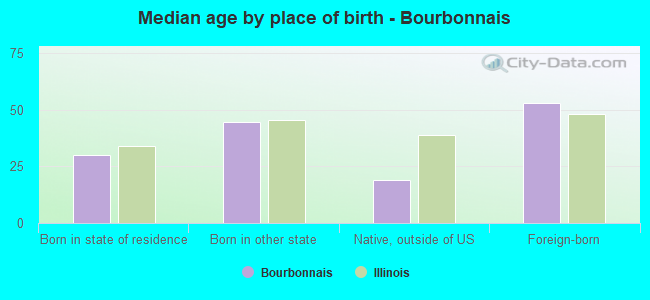
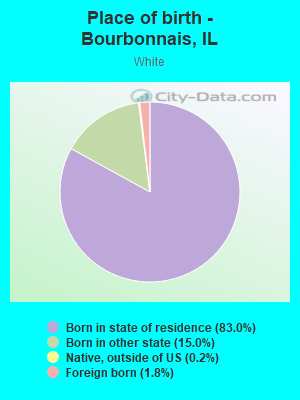
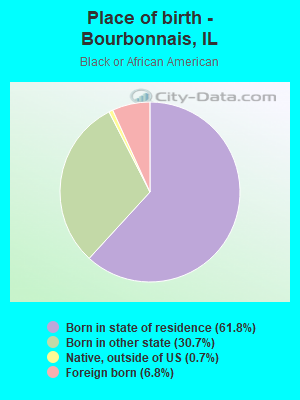
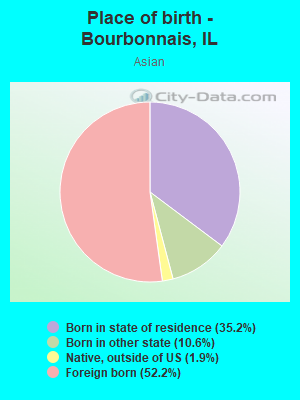
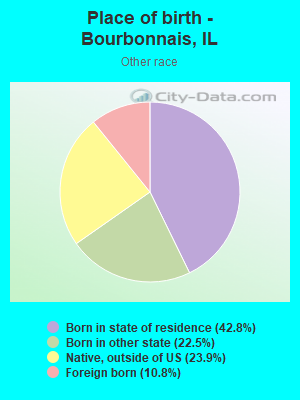
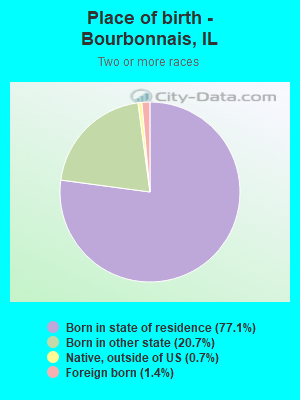
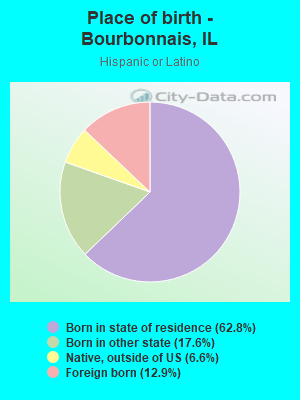
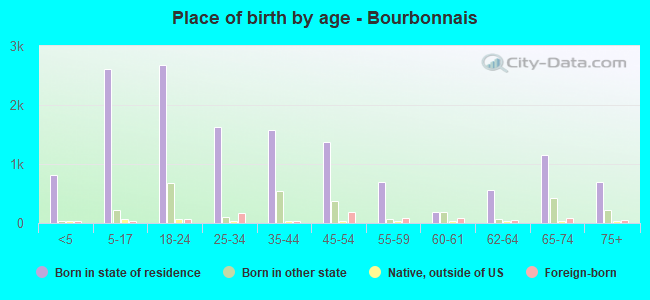
Place of birth - Born in state of residence (%)
Place of birth - Born in state of residence (%) - White
Place of birth - Born in state of residence (%) - Black or African American
Place of birth - Born in state of residence (%) - Asian
Place of birth - Born in state of residence (%) - Hispanic or Latino
Place of birth - Born in state of residence (%) - American Indian and Alaska Native
Place of birth - Born in state of residence (%) - Multirace
Place of birth - Born in state of residence (%) - Other Race
Place of birth - Born in other state (%)
Place of birth - Born in other state (%) - White
Place of birth - Born in other state (%) - Black or African American
Place of birth - Born in other state (%) - Asian
Place of birth - Born in other state (%) - Hispanic or Latino
Place of birth - Born in other state (%) - American Indian and Alaska Native
Place of birth - Born in other state (%) - Multirace
Place of birth - Born in other state (%) - Other Race
Place of birth - Native, outside of US (%)
Place of birth - Native, outside of US (%) - White
Place of birth - Native, outside of US (%) - Black or African American
Place of birth - Native, outside of US (%) - Asian
Place of birth - Native, outside of US (%) - Hispanic or Latino
Place of birth - Native, outside of US (%) - American Indian and Alaska Native
Place of birth - Native, outside of US (%) - Multirace
Place of birth - Native, outside of US (%) - Other Race
Place of birth - Foreign born (%)
Place of birth - Foreign born (%) - White
Place of birth - Foreign born (%) - Black or African American
Place of birth - Foreign born (%) - Asian
Place of birth - Foreign born (%) - Hispanic or Latino
Place of birth - Foreign born (%) - American Indian and Alaska Native
Place of birth - Foreign born (%) - Multirace
Place of birth - Foreign born (%) - Other Race
Residents speaking English at home (%)
Residents speaking English at home - Born in the United States (%)
Residents speaking English at home - Native, born elsewhere (%)
Residents speaking English at home - Foreign born (%)
Residents speaking Spanish at home (%)
Residents speaking Spanish at home - Born in the United States (%)
Residents speaking Spanish at home - Native, born elsewhere (%)
Residents speaking Spanish at home - Foreign born (%)
Residents speaking other language at home (%)
Residents speaking other language at home - Born in the United States (%)
Residents speaking other language at home - Native, born elsewhere (%)
Residents speaking other language at home - Foreign born (%)
Marital status - Never married (%)
Marital status - Now married (%)
Marital status - Separated (%)
Marital status - Widowed (%)
Marital status - Divorced (%)
Ancestries Reported - Arab (%)
Ancestries Reported - Czech (%)
Ancestries Reported - Danish (%)
Ancestries Reported - Dutch (%)
Ancestries Reported - English (%)
Ancestries Reported - French (%)
Ancestries Reported - French Canadian (%)
Ancestries Reported - German (%)
Ancestries Reported - Greek (%)
Ancestries Reported - Hungarian (%)
Ancestries Reported - Irish (%)
Ancestries Reported - Italian (%)
Ancestries Reported - Lithuanian (%)
Ancestries Reported - Norwegian (%)
Ancestries Reported - Polish (%)
Ancestries Reported - Portuguese (%)
Ancestries Reported - Russian (%)
Ancestries Reported - Scotch-Irish (%)
Ancestries Reported - Scottish (%)
Ancestries Reported - Slovak (%)
Ancestries Reported - Subsaharan African (%)
Ancestries Reported - Swedish (%)
Ancestries Reported - Swiss (%)
Ancestries Reported - Ukrainian (%)
Ancestries Reported - United States (%)
Ancestries Reported - Welsh (%)
Ancestries Reported - West Indian (%)
Ancestries Reported - Other (%)
Geographical mobility - Same house 1 year ago (%)
Geographical mobility - Same house 1 year ago (%) - White
Geographical mobility - Same house 1 year ago (%) - Black or African American
Geographical mobility - Same house 1 year ago (%) - Asian
Geographical mobility - Same house 1 year ago (%) - Hispanic or Latino
Geographical mobility - Same house 1 year ago (%) - American Indian and Alaska Native
Geographical mobility - Same house 1 year ago (%) - Multirace
Geographical mobility - Same house 1 year ago (%) - Other Race
Geographical mobility - Moved within same county (%)
Geographical mobility - Moved within same county (%) - White
Geographical mobility - Moved within same county (%) - Black or African American
Geographical mobility - Moved within same county (%) - Asian
Geographical mobility - Moved within same county (%) - Hispanic or Latino
Geographical mobility - Moved within same county (%) - American Indian and Alaska Native
Geographical mobility - Moved within same county (%) - Multirace
Geographical mobility - Moved within same county (%) - Other Race
Geographical mobility - Moved from different county within same state (%)
Geographical mobility - Moved from different county within same state (%) - White
Geographical mobility - Moved from different county within same state (%) - Black or African American
Geographical mobility - Moved from different county within same state (%) - Asian
Geographical mobility - Moved from different county within same state (%) - Hispanic or Latino
Geographical mobility - Moved from different county within same state (%) - American Indian and Alaska Native
Geographical mobility - Moved from different county within same state (%) - Multirace
Geographical mobility - Moved from different county within same state (%) - Other Race
Geographical mobility - Moved from different state (%)
Geographical mobility - Moved from different state (%) - White
Geographical mobility - Moved from different state (%) - Black or African American
Geographical mobility - Moved from different state (%) - Asian
Geographical mobility - Moved from different state (%) - Hispanic or Latino
Geographical mobility - Moved from different state (%) - American Indian and Alaska Native
Geographical mobility - Moved from different state (%) - Multirace
Geographical mobility - Moved from different state (%) - Other Race
Geographical mobility - Moved from abroad (%)
Geographical mobility - Moved from abroad (%) - White
Geographical mobility - Moved from abroad (%) - Black or African American
Geographical mobility - Moved from abroad (%) - Asian
Geographical mobility - Moved from abroad (%) - Hispanic or Latino
Geographical mobility - Moved from abroad (%) - American Indian and Alaska Native
Geographical mobility - Moved from abroad (%) - Multirace
Geographical mobility - Moved from abroad (%) - Other Race
Place of birth for the foreign-born population - Ireland (%)
Place of birth for the foreign-born population - Denmark (%)
Place of birth for the foreign-born population - Norway (%)
Place of birth for the foreign-born population - Sweden (%)
Place of birth for the foreign-born population - United Kingdom (%)
Place of birth for the foreign-born population - England (%)
Place of birth for the foreign-born population - Scotland (%)
Place of birth for the foreign-born population - Other Northern Europe (%)
Place of birth for the foreign-born population - Austria (%)
Place of birth for the foreign-born population - Belgium (%)
Place of birth for the foreign-born population - France (%)
Place of birth for the foreign-born population - Germany (%)
Place of birth for the foreign-born population - Netherlands (%)
Place of birth for the foreign-born population - Switzerland (%)
Place of birth for the foreign-born population - Other Western Europe (%)
Place of birth for the foreign-born population - Greece (%)
Place of birth for the foreign-born population - Italy (%)
Place of birth for the foreign-born population - Portugal (%)
Place of birth for the foreign-born population - Spain (%)
Place of birth for the foreign-born population - Other Southern Europe (%)
Place of birth for the foreign-born population - Albania (%)
Place of birth for the foreign-born population - Belarus (%)
Place of birth for the foreign-born population - Bosnia and Herzegovina (%)
Place of birth for the foreign-born population - Bulgaria (%)
Place of birth for the foreign-born population - Croatia (%)
Place of birth for the foreign-born population - Czechoslovakia (%)
Place of birth for the foreign-born population - Hungary (%)
Place of birth for the foreign-born population - Latvia (%)
Place of birth for the foreign-born population - Lithuania (%)
Place of birth for the foreign-born population - North Macedonia (Macedonia) (%)
Place of birth for the foreign-born population - Moldova (%)
Place of birth for the foreign-born population - Poland (%)
Place of birth for the foreign-born population - Romania (%)
Place of birth for the foreign-born population - Russia (%)
Place of birth for the foreign-born population - Serbia (%)
Place of birth for the foreign-born population - Ukraine (%)
Place of birth for the foreign-born population - Other Eastern Europe (%)
Place of birth for the foreign-born population - China (%)
Place of birth for the foreign-born population - Hong Kong (%)
Place of birth for the foreign-born population - Taiwan (%)
Place of birth for the foreign-born population - Japan (%)
Place of birth for the foreign-born population - Korea (%)
Place of birth for the foreign-born population - Other Eastern Asia (%)
Place of birth for the foreign-born population - Afghanistan (%)
Place of birth for the foreign-born population - Bangladesh (%)
Place of birth for the foreign-born population - India (%)
Place of birth for the foreign-born population - Iran (%)
Place of birth for the foreign-born population - Kazakhstan (%)
Place of birth for the foreign-born population - Nepal (%)
Place of birth for the foreign-born population - Pakistan (%)
Place of birth for the foreign-born population - Sri Lanka (%)
Place of birth for the foreign-born population - Uzbekistan (%)
Place of birth for the foreign-born population - Other South Central Asia (%)
Place of birth for the foreign-born population - Burma (%)
Place of birth for the foreign-born population - Cambodia (%)
Place of birth for the foreign-born population - Indonesia (%)
Place of birth for the foreign-born population - Laos (%)
Place of birth for the foreign-born population - Malaysia (%)
Place of birth for the foreign-born population - Philippines (%)
Place of birth for the foreign-born population - Singapore (%)
Place of birth for the foreign-born population - Thailand (%)
Place of birth for the foreign-born population - Vietnam (%)
Place of birth for the foreign-born population - Other South Eastern Asia (%)
Place of birth for the foreign-born population - Armenia (%)
Place of birth for the foreign-born population - Iraq (%)
Place of birth for the foreign-born population - Israel (%)
Place of birth for the foreign-born population - Jordan (%)
Place of birth for the foreign-born population - Kuwait (%)
Place of birth for the foreign-born population - Lebanon (%)
Place of birth for the foreign-born population - Saudi Arabia (%)
Place of birth for the foreign-born population - Syria (%)
Place of birth for the foreign-born population - Turkey (%)
Place of birth for the foreign-born population - Yemen (%)
Place of birth for the foreign-born population - Other Western Asia (%)
Place of birth for the foreign-born population - Eritrea (%)
Place of birth for the foreign-born population - Ethiopia (%)
Place of birth for the foreign-born population - Kenya (%)
Place of birth for the foreign-born population - Somalia (%)
Place of birth for the foreign-born population - Uganda (%)
Place of birth for the foreign-born population - Zimbabwe (%)
Place of birth for the foreign-born population - Other Eastern Africa (%)
Place of birth for the foreign-born population - Cameroon (%)
Place of birth for the foreign-born population - Congo (%)
Place of birth for the foreign-born population - Democratic Republic of Congo (Zaire) (%)
Place of birth for the foreign-born population - Other Middle Africa (%)
Place of birth for the foreign-born population - Egypt (%)
Place of birth for the foreign-born population - Morocco (%)
Place of birth for the foreign-born population - Sudan (%)
Place of birth for the foreign-born population - Other Northern Africa (%)
Place of birth for the foreign-born population - South Africa (%)
Place of birth for the foreign-born population - Other Southern Africa (%)
Place of birth for the foreign-born population - Cabo Verde (%)
Place of birth for the foreign-born population - Ghana (%)
Place of birth for the foreign-born population - Liberia (%)
Place of birth for the foreign-born population - Nigeria (%)
Place of birth for the foreign-born population - Senegal (%)
Place of birth for the foreign-born population - Sierra Leone (%)
Place of birth for the foreign-born population - Other Western Africa (%)
Place of birth for the foreign-born population - Australia (%)
Place of birth for the foreign-born population - New Zealand (%)
Place of birth for the foreign-born population - Fiji (%)
Place of birth for the foreign-born population - Micronesia (%)
Place of birth for the foreign-born population - Bahamas (%)
Place of birth for the foreign-born population - Barbados (%)
Place of birth for the foreign-born population - Cuba (%)
Place of birth for the foreign-born population - Dominica (%)
Place of birth for the foreign-born population - Dominican Republic (%)
Place of birth for the foreign-born population - Grenada (%)
Place of birth for the foreign-born population - Haiti (%)
Place of birth for the foreign-born population - Jamaica (%)
Place of birth for the foreign-born population - St. Vincent and the Grenadines (%)
Place of birth for the foreign-born population - Trinidad and Tobago (%)
Place of birth for the foreign-born population - West Indies (%)
Place of birth for the foreign-born population - Other Caribbean (%)
Place of birth for the foreign-born population - Belize (%)
Place of birth for the foreign-born population - Costa Rica (%)
Place of birth for the foreign-born population - El Salvador (%)
Place of birth for the foreign-born population - Guatemala (%)
Place of birth for the foreign-born population - Honduras (%)
Place of birth for the foreign-born population - Mexico (%)
Place of birth for the foreign-born population - Nicaragua (%)
Place of birth for the foreign-born population - Panama (%)
Place of birth for the foreign-born population - Other Central America (%)
Place of birth for the foreign-born population - Argentina (%)
Place of birth for the foreign-born population - Bolivia (%)
Place of birth for the foreign-born population - Brazil (%)
Place of birth for the foreign-born population - Chile (%)
Place of birth for the foreign-born population - Colombia (%)
Place of birth for the foreign-born population - Ecuador (%)
Place of birth for the foreign-born population - Guyana (%)
Place of birth for the foreign-born population - Peru (%)
Place of birth for the foreign-born population - Uruguay (%)
Place of birth for the foreign-born population - Venezuela (%)
Place of birth for the foreign-born population - Other South America (%)
Place of birth for the foreign-born population - Canada (%)
Place of birth for the foreign-born population - Other Northern America (%)
Place of birth for the foreign-born population - Other (%)
Latest news about races in Bourbonnais, IL collected exclusively by city-data.com from local newspapers, TV, and radio stations
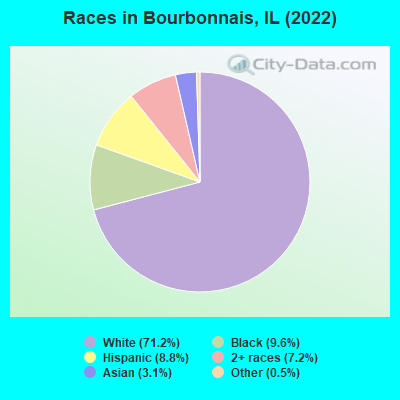
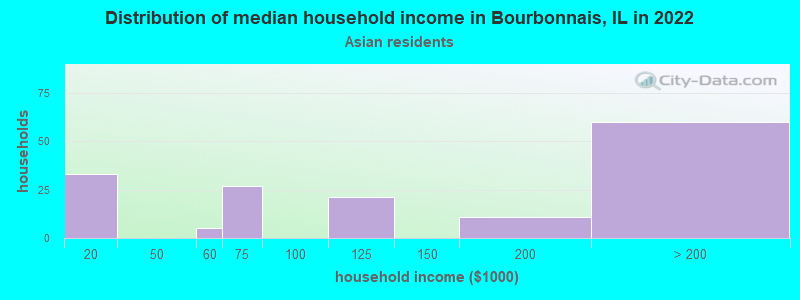
According to 2022 data, the most numerous races in Bourbonnais, IL are White alone (12,746 residents), Hispanic (1,574 residents), and Black alone (1,726 residents). 92.3% of Bourbonnais residents speak English at home. 4.8% of Bourbonnais, IL residents are foreign-born (2.0% born in Asia, 1.3% born in Latin America, 0.9% born in Africa), which is 193.4% less than the foreign-born rate of 14.0% across the entire state of Illinois.
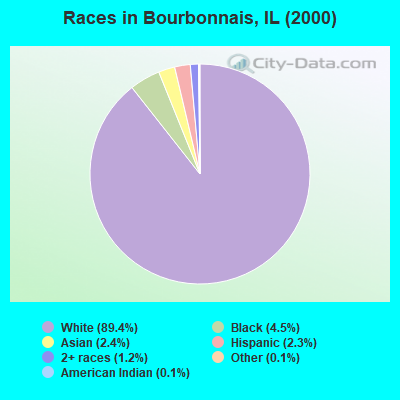
Race distribution in Bourbonnais
2000 2022
8,424,140 67.8% White alone 1,856,152 14.9% Black alone 1,530,262 12.3% Hispanic 419,916 3.4% Asian alone 153,996 1.2% Two or more races 13,479 0.1% Other race alone 18,232 0.1% American Indian alone 3,116 0.03% Native Hawaiian and Other
7,356,301 58.5% White alone 2,299,726 18.3% Hispanic 1,660,423 13.2% Black alone 747,296 5.9% Asian alone 458,599 3.6% Two or more races 45,386 0.4% Other race alone 10,405 0.08% American Indian alone 3,896 0.03% Native Hawaiian and Other
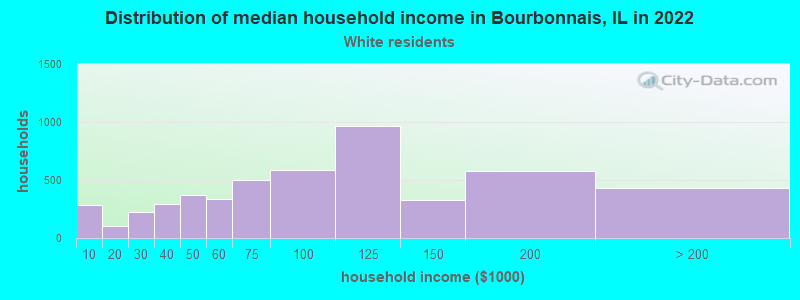
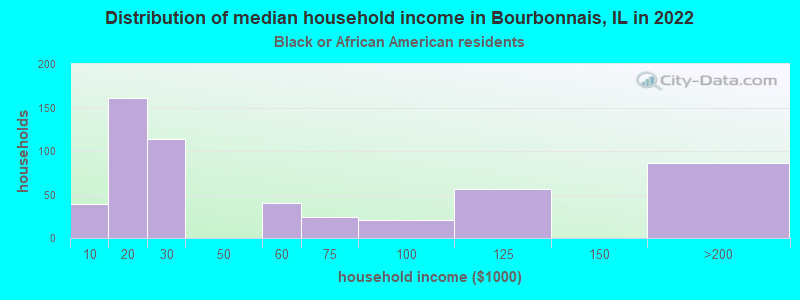
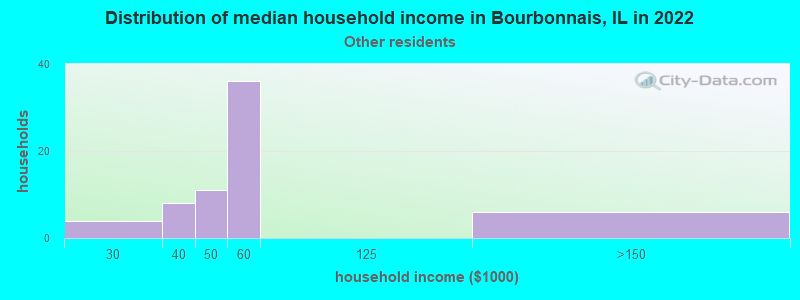
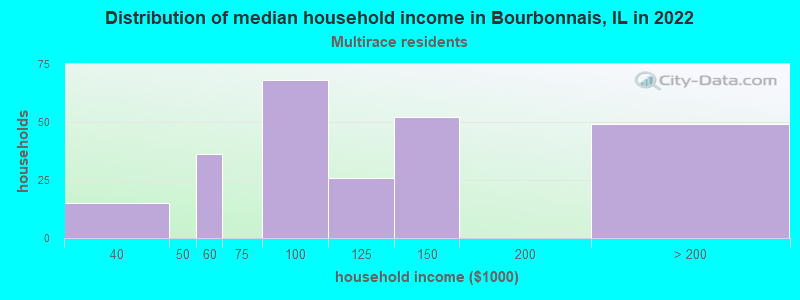
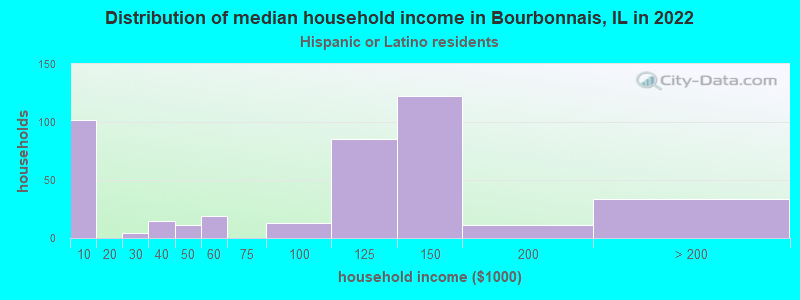
Income and house value in Bourbonnais Median household income in 2022 $89,535 White non-Hispanic householders$128,663 Some other race householders$100,791 Two or more races householders$135,887 Hispanic or Latino race householdersMedian 2022 house value $263,554 White Non-Hispanic householders$215,555 Black or African American householders $510,374 Asian householders$200,582 Some other race householders$455,990 Two or more races householders$214,674 Hispanic or Latino householders
Median age by race in Bourbonnais
38.1 Median age for White residents37.5 37.8 28.1 Median age for Black or African American residents24.7 29.9 -568,306,010.4 Median age for American Indian / Alaska Native residents-1,149,911,815.4 -610,778,442.5 47.2 Median age for Asian residents37.8 50.8 -666,666,666.0 Median age for Native Hawaiian / Pacific Islander residents-666,666,666.0 -666,666,666.0 20.8 Median age for Other race residents23.8 16.3 18.4 Median age for Two or more races residents19.5 17.3 39.4 Median age for White alone residents39.0 39.0 20.4 Median age for Hispanic or Latino residents21.0 21.8
Owner/renter occupied households by race in Bourbonnais
House owners and renters - White residents 3,631 75.3% Owner occupied1,191 24.7% Renter occupiedHouse owners and renters - Black or African American residents 173 30.1% Owner occupied401 69.9% Renter occupiedHouse owners and renters - Asian residents 160 93.9% Owner occupied10 6.1% Renter occupiedHouse owners and renters - Other race residents 57 96.7% Owner occupied2 3.3% Renter occupiedHouse owners and renters - Two or more races residents 196 86.4% Owner occupied31 13.6% Renter occupiedHouse owners and renters - White alone residents 3,340 72.8% Owner occupied1,245 27.2% Renter occupiedHouse owners and renters - Hispanic or Latino residents 445 96.2% Owner occupied18 3.8% Renter occupied
Language usage in Bourbonnais
English speakers - Total 92.3% of residents of Bourbonnais speak English at home.
4.8% of residents speak Spanish at home 683 82.9% Speak English very well141 17.1% Speak English less than very well1.7% of residents speak other language at home 214 75.4% Speak English very well70 24.6% Speak English less than very well
English speakers - Born in the United States 92.8% of residents of Bourbonnais speak English at home.
2.4% of residents speak Spanish at home 71 100.0% Speak English very well3.4% of residents speak other language at home 101 100.0% Speak English very well
English speakers - Native, born elsewhere 98.7% of residents of Bourbonnais speak English at home.
5.2% of residents speak Spanish at home 4 100.0% Speak English very well
English speakers - Foreign-born 27.7% of residents of Bourbonnais speak English at home.
29.9% of residents speak Spanish at home 101 42.8% Speak English very well135 57.2% Speak English less than very well38.8% of residents speak other language at home 250 81.7% Speak English very well56 18.3% Speak English less than very well
White (Caucasian) - Speak only English Native:
95.6% (12,287)Foreign-born:
13.4% (33)
White (Caucasian) - Speak another language Native:
4.1% (531)Foreign-born:
82.2% (202)
Black or African American - Speak only English Native:
100.0% (1,411)Foreign-born:
54.5% (84)
Asian - Speak only English Native:
44.8% (155)Foreign-born:
48.5% (131)
Asian - Speak another language Native:
16.5% (57)Foreign-born:
45.4% (122)
Other race - Speak another language Native:
18.4% (65)Foreign-born:
98.9% (44)
Two or more races - Speak another language Native:
3.3% (55)Foreign-born:
100.0% (26)
White alone - Speak only English Native:
98.1% (12,017)Foreign-born:
65.9% (61)
White alone - Speak another language Native:
1.9% (231)Foreign-born:
29.6% (27)
Hispanic or Latino - Speak another language Native:
28.4% (391)Foreign-born:
100.0% (215)
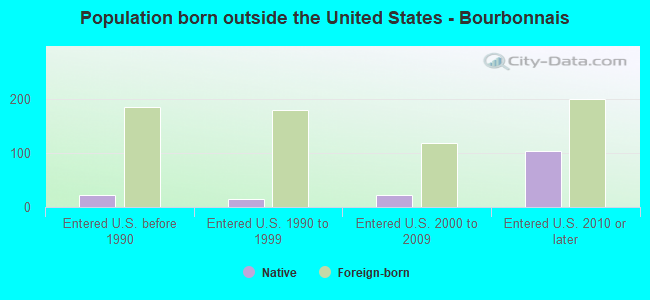
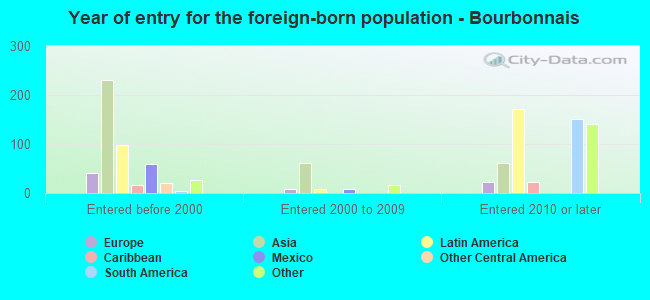
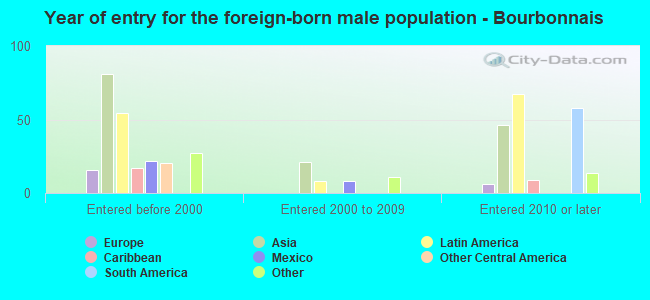
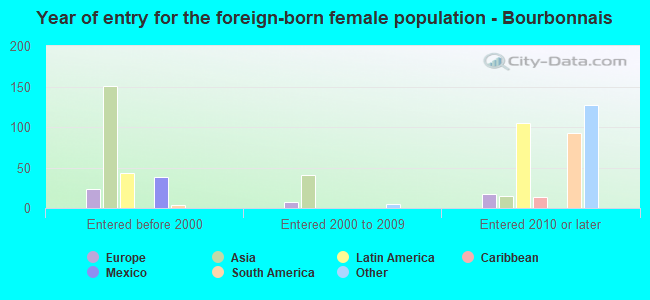
Foreign-born residents in Bourbonnais 854 residents are foreign born (2.0% Asia , 1.3% Latin America , 0.9% Africa ).
This city:
4.8%Illinois:
14.1%
Marital status for residents in Bourbonnais Marital status - White (Caucasian) population 15 years and over
Males 39.5% Never married47.1% Now married1.6% Separated3.4% Widowed8.4% DivorcedFemales 40.6% Never married40.6% Now married0.2% Separated7.3% Widowed11.4% DivorcedWomen who gave birth in the past 12 months Now married:
42.1% (66)Unmarried:
57.9% (91)
Women who did not give birth in the past 12 months Now married:
26.0% (944)Unmarried:
74.0% (2,689)
Marital status - Black or African American population 15 years and over
Males 65.0% Never married33.7% Now married0.0% Separated0.0% Widowed1.3% DivorcedFemales 70.4% Never married23.6% Now married0.0% Separated2.7% Widowed3.3% DivorcedWomen who gave birth in the past 12 months Now married:
100.0% (15)Unmarried:
0.0% (0)
Women who did not give birth in the past 12 months Now married:
12.1% (61)Unmarried:
87.9% (446)
Marital status - Asian population 15 years and over
Males 28.9% Never married71.1% Now married0.0% Separated0.0% Widowed0.0% DivorcedFemales 11.6% Never married66.4% Now married7.9% Separated14.1% Widowed0.0% DivorcedWomen who did not give birth in the past 12 months Now married:
77.3% (100)Unmarried:
22.7% (29)
Marital status - Other race population 15 years and over
Males 52.7% Never married26.0% Now married6.1% Separated0.0% Widowed15.3% DivorcedFemales 32.3% Never married63.5% Now married4.2% Separated0.0% Widowed0.0% DivorcedWomen who did not give birth in the past 12 months Now married:
56.3% (47)Unmarried:
43.7% (36)
Marital status - Two or more races population 15 years and over
Males 59.0% Never married30.6% Now married4.3% Separated0.0% Widowed6.2% DivorcedFemales 64.4% Never married35.1% Now married0.0% Separated0.0% Widowed0.5% DivorcedWomen who gave birth in the past 12 months Now married:
100.0% (121)Unmarried:
0.0% (0)
Women who did not give birth in the past 12 months Now married:
13.5% (57)Unmarried:
86.5% (363)
Marital status - White alone, not Hispanic / Latino population 15 years and over
Males 39.6% Never married46.2% Now married1.7% Separated3.6% Widowed8.9% DivorcedFemales 39.3% Never married41.9% Now married0.2% Separated7.8% Widowed10.7% DivorcedWomen who gave birth in the past 12 months Now married:
42.1% (65)Unmarried:
57.9% (89)
Women who did not give birth in the past 12 months Now married:
27.7% (885)Unmarried:
72.3% (2,313)
Marital status - Hispanic or Latino population 15 years and over
Males 41.8% Never married49.5% Now married4.4% Separated0.0% Widowed4.4% DivorcedFemales 51.5% Never married32.4% Now married0.7% Separated0.0% Widowed15.3% DivorcedWomen who did not give birth in the past 12 months Now married:
23.0% (113)Unmarried:
77.0% (376)
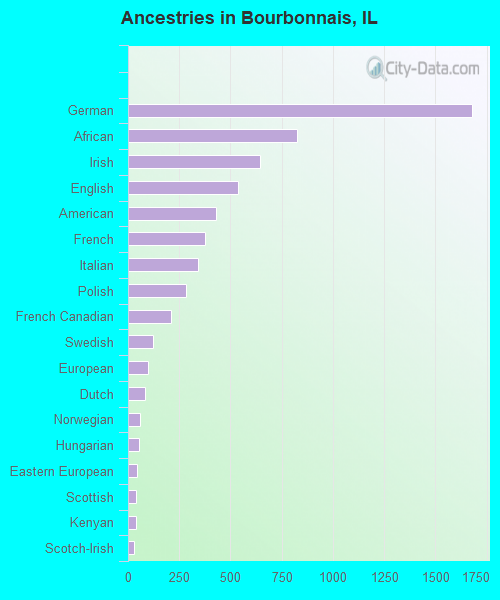
Ancestries in Bourbonnais
1,678 20.5% German825 10.1% African642 7.8% Irish537 6.6% English431 5.3% American377 4.6% French344 4.2% Italian284 3.5% Polish211 2.6% French Canadian120 1.5% Swedish97 1.2% European82 1.0% Dutch58 0.7% Norwegian56 0.7% Hungarian44 0.5% Eastern European41 0.5% Scottish37 0.5% Kenyan29 0.4% Scotch-Irish13 0.2% Nigerian10 0.1% Northern European10 0.1% Scandinavian9 0.1% Austrian9 0.1% Lithuanian7 0.09% Greek6 0.07% Danish5 0.06% Swiss
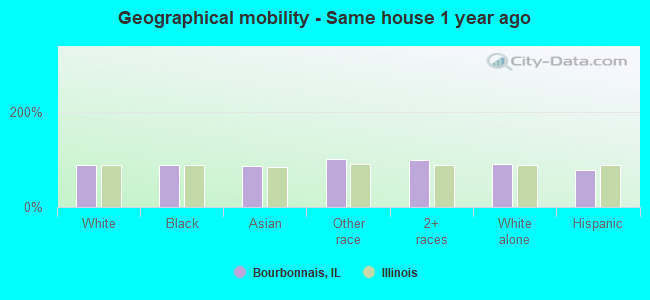
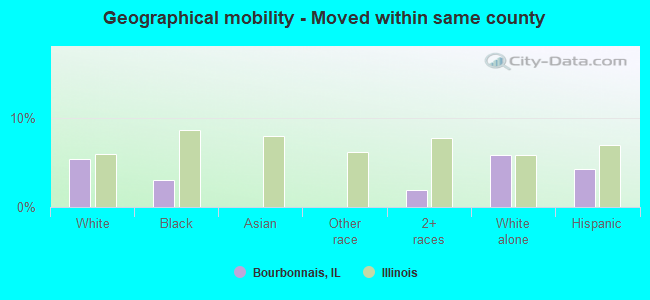
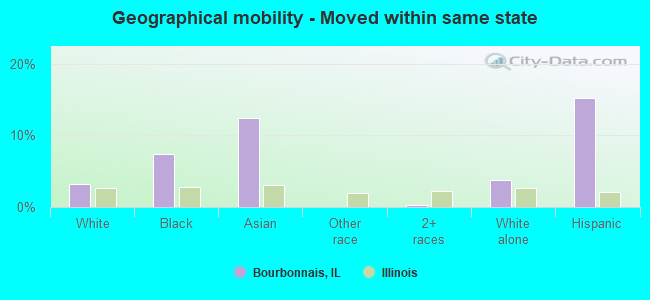
Geographical mobility in Bourbonnais Same house 1 year ago 11,958 88.4% White (Caucasian)1,522 88.9% Black or African American447 84.9% Asian389 100.0% Other race1,589 98.1% Two or more races11,392 90.1% White alone, not Hispanic / Latino1,180 78.0% Hispanic or LatinoMoved within same county 720 5.3% White / Caucasian52 3.1% Black or African American30 1.8% Two or more races730 5.8% White alone, not Hispanic / Latino64 4.2% Hispanic or LatinoMoved within same state 433 3.2% White / Caucasian127 7.4% Black or African American65 12.4% Asian5 0.3% Two or more races485 3.8% White alone, not Hispanic / Latino230 15.2% Hispanic or LatinoMoved from different state 224 1.7% White / Caucasian20 1.2% Black or African American23 4.3% Asian42 2.6% Two or more races210 1.7% White alone, not Hispanic / Latino43 2.8% Hispanic or LatinoMoved from abroad 52 0.4% White65 0.5% White alone, not Hispanic / Latino
Children Nativity (place of birth) in Bourbonnais
Children under 6 years - Living with two parents Both parents native 481 100.0% NativeOne native, one foreign-born parent 11 100.0% NativeChildren under 6 years - Living with one parent Native parent 413 100.0% NativeChildren 6 to 17 years - Living with two parents Both parents native 1,651 98.1% Native31 1.9% Foreign-bornBoth parents foreign-born 62 86.6% Native10 13.4% Foreign-bornOne native, one foreign-born parent 66 100.0% NativeChildren 6 to 17 years - Living with one parent Native parent 895 98.3% Native16 1.7% Foreign-bornForeign-born parent 17 100.0% Native
Grandparents responsible for own grandchildren in Bourbonnais
Grandparents (30 to 59 years) White / Caucasian 5 100.0% Not responsible for grandchildrenWhite alone, not Hispanic / Latino 5 100.0% Not responsible for grandchildren
Grandparents (60 years and over) White / Caucasian 146 100.0% Not responsible for grandchildrenWhite alone, not Hispanic / Latino 161 100.0% Not responsible for grandchildren