Races in Bow, New Hampshire (NH) Detailed Stats
Ancestries, Foreign-born residents, place of birth
2.3% of Bow, NH residents are foreign-born (1.1% born in Europe, 0.5% born in Asia, 0.4% born in North America), which is 113.7% less than the foreign-born rate of 5.0% across the entire state of New Hampshire.
Race distribution in Bow

- 6,96197.5%White alone
- 741.0%Asian alone
- 460.6%Two or more races
- 350.5%Hispanic
- 110.2%Other race alone
- 90.1%Black alone
- 20.03%American Indian alone
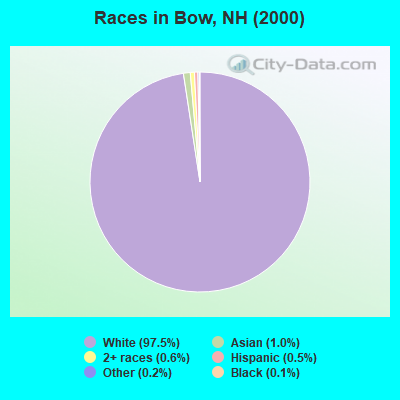
2000
2022
-
- 1,175,25295.1%White alone
- 20,4891.7%Hispanic
- 15,8031.3%Asian alone
- 11,6060.9%Two or more races
- 8,3540.7%Black alone
- 2,6980.2%American Indian alone
- 1,2540.1%Other race alone
- 3300.03%Native Hawaiian and Other
Pacific Islander alone

-
- 1,208,10186.6%White alone
- 63,4794.5%Hispanic
- 60,7244.4%Two or more races
- 36,5192.6%Asian alone
- 17,9311.3%Black alone
- 6,6150.5%Other race alone
- 1,0140.07%American Indian alone
- 8480.06%Native Hawaiian and Other
Pacific Islander alone

Income and house value in Bow
- Median household income in 2022
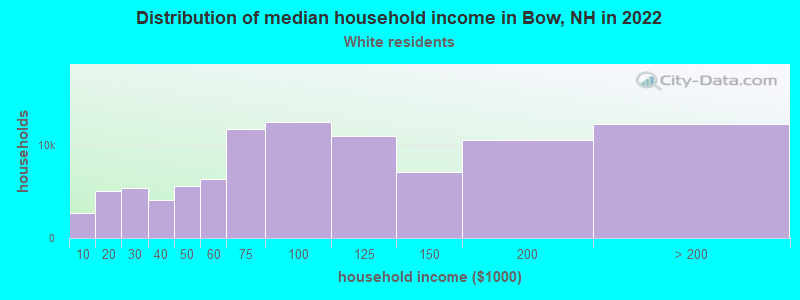
- $138,329White non-Hispanic householders
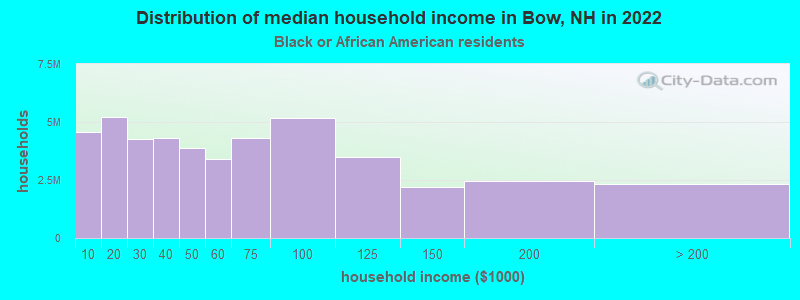
- $142,866Black householders
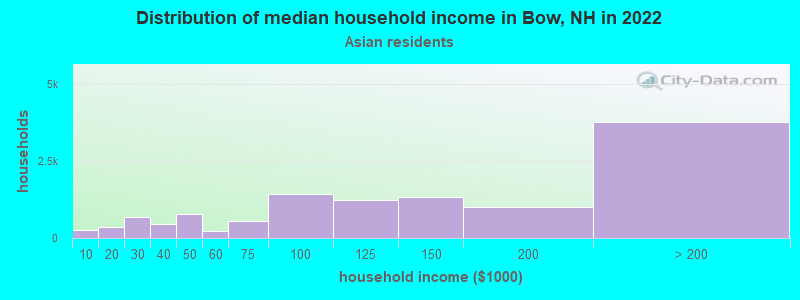
- $153,210Asian householders
- $119,013Two or more races householders
- over $200,000Hispanic or Latino race householders
- Median 2022 house value
- $529,190White Non-Hispanic householders
- $430,299Asian householders
- $704,126Hispanic or Latino householders
Household income for White non-Hispanic householders
Household income for Black householders
Household income for Asian householders
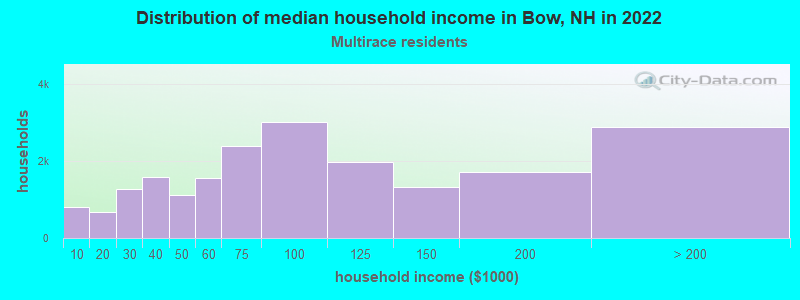
Household income for Two or more races householders
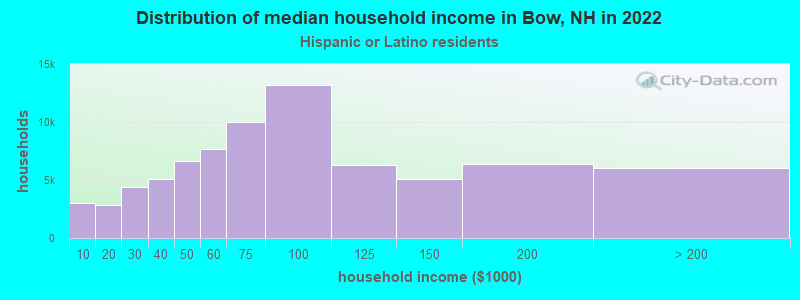
Household income for Hispanic or Latino race householders
Foreign-born residents in Bow
167 residents are foreign born (1.1% Europe, 0.5% Asia, 0.4% North America).
| This city: | 2.3% |
| New Hampshire: | 4.4% |
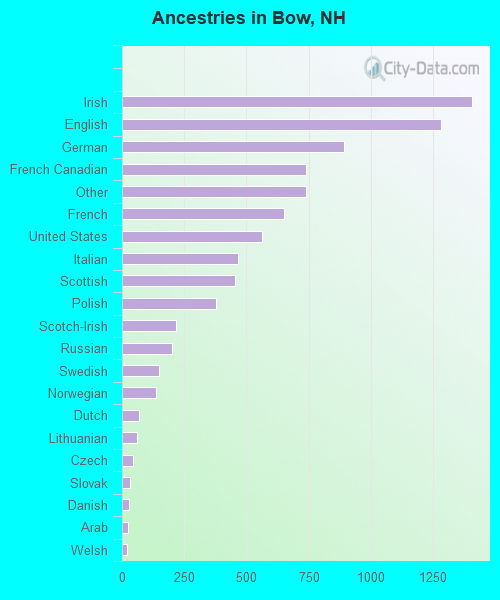
Ancestries in Bow

- 1,40516.3%Irish
- 1,28314.9%English
- 89110.4%German
- 7408.6%French Canadian
- 7388.6%Other
- 6517.6%French
- 5616.5%United States
- 4675.4%Italian
- 4555.3%Scottish
- 3784.4%Polish
- 2182.5%Scotch-Irish
- 2012.3%Russian
- 1491.7%Swedish
- 1381.6%Norwegian
- 670.8%Dutch
- 610.7%Lithuanian
- 440.5%Czech
- 310.4%Slovak
- 290.3%Danish
- 250.3%Arab
- 210.2%Welsh
- 100.1%Ukrainian
- 90.1%Hungarian
- 90.1%Portuguese
- 70.08%West Indian
- 60.07%Greek
Zip codes: 03304.