Races in Boyette, Florida (FL) Detailed Stats
Ancestries, Foreign-born residents, place of birth

Recent posts about races in Boyette, Florida on our local forum with over 2,400,000 registered users:
 | 7 months in, Tampa's novelty is over for me, but... (107 replies) |
| Looking for the Best Community for Young Family (5 replies) |
| Mountain Biker relocating somewhere in the Bay. (29 replies) |
| Cant find a decent home rental ?? (40 replies) |
| Possibly moving to Tampa from Colorado (6 replies) |
| She's on her way !!! (19 replies) |
5.7% of Boyette, FL residents are foreign-born (2.3% born in Latin America, 1.8% born in Europe, 1.2% born in Asia), which is 267.3% less than the foreign-born rate of 21.0% across the entire state of Florida.
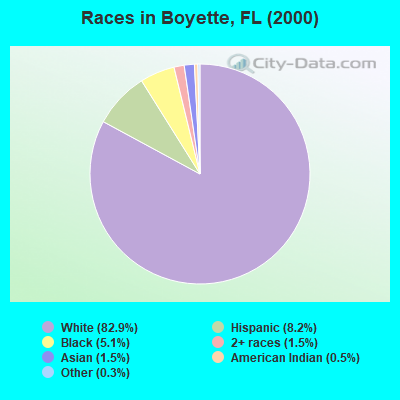
Race distribution in Boyette

- 4,88682.9%White alone
- 4818.2%Hispanic
- 2985.1%Black alone
- 891.5%Two or more races
- 881.5%Asian alone
- 320.5%American Indian alone
- 180.3%Other race alone
- 30.05%Native Hawaiian and Other
Pacific Islander alone
2000
2022
-
- 10,458,50965.4%White alone
- 2,682,71516.8%Hispanic
- 2,264,26814.2%Black alone
- 261,6931.6%Asian alone
- 236,9541.5%Two or more races
- 42,3580.3%American Indian alone
- 28,9940.2%Other race alone
- 6,8870.04%Native Hawaiian and Other
Pacific Islander alone

-
- 11,309,40350.8%White alone
- 6,025,03927.1%Hispanic
- 3,241,01514.6%Black alone
- 861,6303.9%Two or more races
- 623,6922.8%Asian alone
- 152,0540.7%Other race alone
- 22,5040.1%American Indian alone
- 9,4860.04%Native Hawaiian and Other
Pacific Islander alone

Income and house value in Boyette
- Median household income in 2022
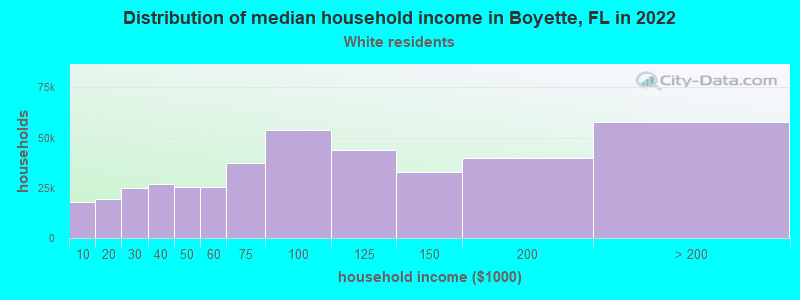
- $103,767White non-Hispanic householders
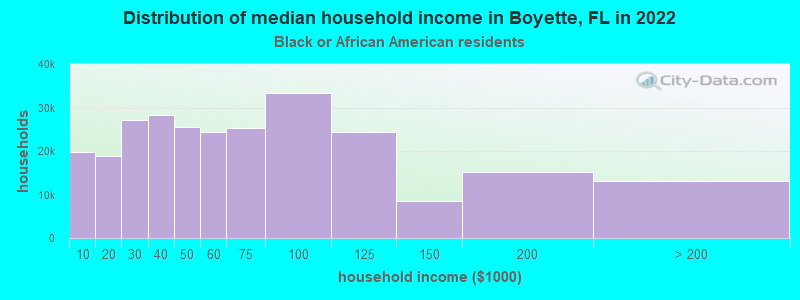
- $153,712Black householders
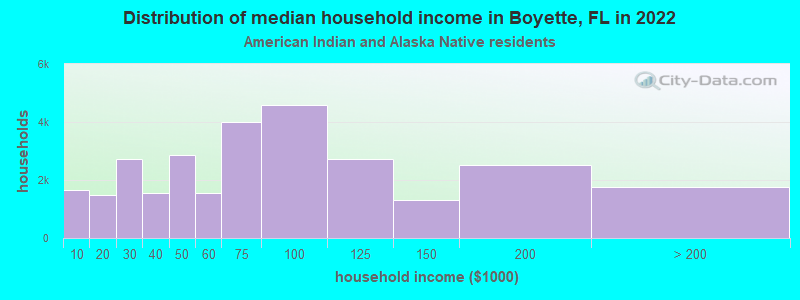
- $68,202American Indian and Alaska Native householders
- $51,369Asian householders
- $26,793Some other race householders
- $30,465Two or more races householders
- $109,391Hispanic or Latino race householders
- Median 2022 house value
- $521,173White Non-Hispanic householders
- $568,335Black or African American householders
- $476,010American Indian or Alaska Native householders
- $594,713Asian householders
- $179,852Two or more races householders
- $561,940Hispanic or Latino householders
Household income for White non-Hispanic householders
Household income for Black householders
Household income for American Indian and Alaska Native householders
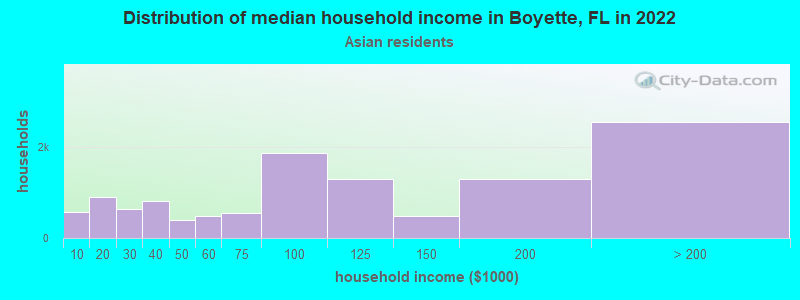
Household income for Asian householders
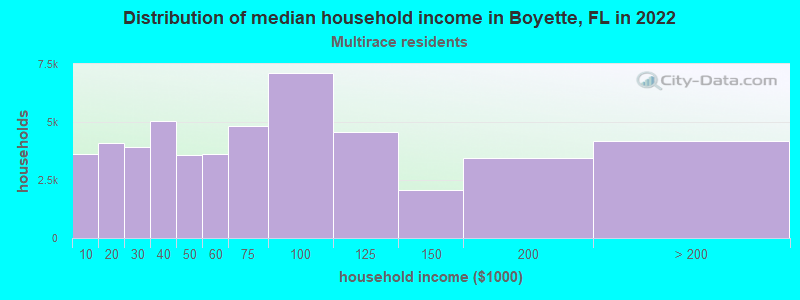
Household income for Two or more races householders
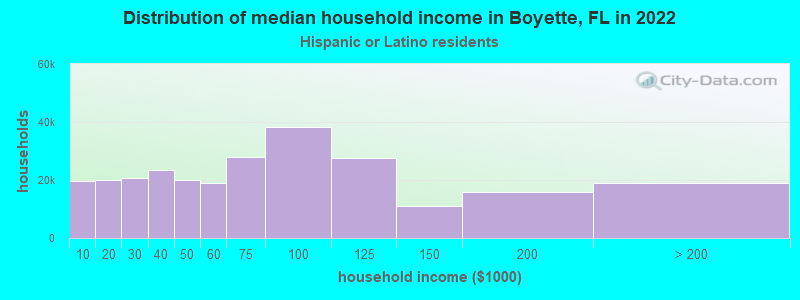
Household income for Hispanic or Latino race householders
Foreign-born residents in Boyette
337 residents are foreign born (2.3% Latin America, 1.8% Europe, 1.2% Asia).
| This city: | 5.7% |
| Florida: | 16.7% |
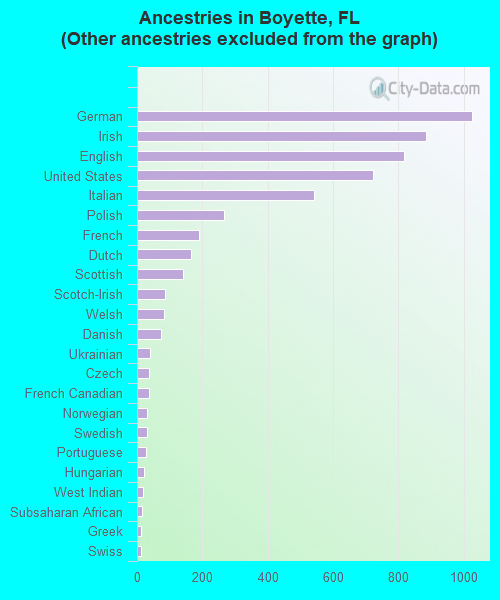
Ancestries in Boyette

- 1,40521.0%Other
- 1,02615.3%German
- 88613.2%Irish
- 81812.2%English
- 72210.8%United States
- 5428.1%Italian
- 2654.0%Polish
- 1912.9%French
- 1662.5%Dutch
- 1402.1%Scottish
- 861.3%Scotch-Irish
- 831.2%Welsh
- 731.1%Danish
- 410.6%Ukrainian
- 360.5%Czech
- 360.5%French Canadian
- 320.5%Norwegian
- 310.5%Swedish
- 270.4%Portuguese
- 210.3%Hungarian
- 180.3%West Indian
- 150.2%Subsaharan African
- 110.2%Greek
- 110.2%Swiss
- 90.1%Arab
- 90.1%Russian
Zip codes: 33569.