Races in Bradfordwoods, Pennsylvania (PA) Detailed Stats
According to 2022 data, the most numerous races in Bradfordwoods, PA are White alone (1,144 residents), Black alone (12 residents), and Hispanic (0 residents). 95.0% of Bradfordwoods residents speak English at home. 7.1% of Bradfordwoods, PA residents are foreign-born (3.1% born in Europe, 2.5% born in Asia), which is about the same as the foreign-born rate of 7.0% across the entire state of Pennsylvania.
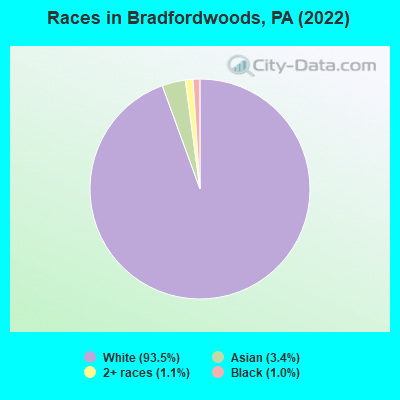
Race distribution in Bradfordwoods
2000 2022
10,322,455 84.1% White alone 1,202,437 9.8% Black alone 394,088 3.2% Hispanic 218,296 1.8% Asian alone 113,097 0.9% Two or more races 13,086 0.1% Other race alone 14,904 0.1% American Indian alone 2,691 0.02% Native Hawaiian and Other
9,487,228 73.1% White alone 1,311,581 10.1% Black alone 1,115,997 8.6% Hispanic 493,942 3.8% Two or more races 487,124 3.8% Asian alone 63,582 0.5% Other race alone 10,130 0.08% American Indian alone 2,424 0.02% Native Hawaiian and Other
Income and house value in Bradfordwoods Median household income in 2022 $163,947 White non-Hispanic householders$126,436 Black householdersMedian 2022 house value $492,303 White Non-Hispanic householdersover $1,000,000 Some other race householders$571,264 Hispanic or Latino householders
Median age by race in Bradfordwoods
42.7 Median age for White residents45.5 40.4 51.9 Median age for Black or African American residents-690,095,846.0 50.3 -642,857,142.2 Median age for American Indian / Alaska Native residents-714,583,332.6 -577,519,379.3 42.1 Median age for Asian residents-674,922,599.9 41.9 -656,534,953.8 Median age for Native Hawaiian / Pacific Islander residents-919,148,935.3 -747,474,746.7 -700,529,099.8 Median age for Other race residents-689,440,993.1 -681,623,930.9 12.8 Median age for Two or more races residents7.1 -699,724,517.2 42.7 Median age for White alone residents45.4 40.3 -675,555,554.9 Median age for Hispanic or Latino residents-673,333,332.7 -677,814,938.0
Owner/renter occupied households by race in Bradfordwoods
House owners and renters - White residents 438 96.5% Owner occupied16 3.5% Renter occupiedHouse owners and renters - Black or African American residents 8 100.0% Owner occupiedHouse owners and renters - Asian residents 8 100.0% Owner occupiedHouse owners and renters - White alone residents 438 96.5% Owner occupied16 3.5% Renter occupied
Language usage in Bradfordwoods
English speakers - Total 95.0% of residents of Bradfordwoods speak English at home.
4.7% of residents speak other language at home 37 69.8% Speak English very well16 30.2% Speak English less than very well
English speakers - Born in the United States 98.7% of residents of Bradfordwoods speak English at home.
English speakers - Native, born elsewhere 77.8% of residents of Bradfordwoods speak English at home.
English speakers - Foreign-born 50.6% of residents of Bradfordwoods speak English at home.
45.5% of residents speak other language at home 21 60.0% Speak English very well14 40.0% Speak English less than very well
White (Caucasian) - Speak only English Native:
99.4% (1,012)Foreign-born:
91.6% (36)
White (Caucasian) - Speak another language Native:
0.6% (6)Foreign-born:
12.4% (5)
Black or African American - Speak only English Native:
100.0% (7)Foreign-born:
65.2% (3)
Asian - Speak another language Native:
97.1% (12)Foreign-born:
100.0% (29)
White alone - Speak only English Native:
99.3% (1,014)Foreign-born:
86.7% (37)
White alone - Speak another language Native:
0.6% (6)Foreign-born:
12.8% (5)
Foreign-born residents in Bradfordwoods 87 residents are foreign born (3.1% Europe , 2.5% Asia ).
This city:
7.1%Pennsylvania:
7.3%
Marital status for residents in Bradfordwoods Marital status - White (Caucasian) population 15 years and over
Males 12.5% Never married75.3% Now married1.5% Separated5.2% Widowed5.5% DivorcedFemales 18.5% Never married62.1% Now married0.6% Separated11.5% Widowed7.3% DivorcedWomen who gave birth in the past 12 months Now married:
100.0% (13)Unmarried:
0.0% (0)
Women who did not give birth in the past 12 months Now married:
58.6% (129)Unmarried:
41.4% (91)
Marital status - Black or African American population 15 years and over
Males 0.0% Never married0.0% Now married0.0% Separated0.0% Widowed100.0% DivorcedFemales 33.3% Never married33.3% Now married0.0% Separated0.0% Widowed33.3% DivorcedWomen who did not give birth in the past 12 months Now married:
33.3% (3)Unmarried:
66.7% (5)
Marital status - Asian population 15 years and over
Males 0.0% Never married100.0% Now married0.0% Separated0.0% Widowed0.0% DivorcedFemales 28.0% Never married72.0% Now married0.0% Separated0.0% Widowed0.0% DivorcedWomen who did not give birth in the past 12 months Now married:
50.0% (7)Unmarried:
50.0% (7)
Marital status - White alone, not Hispanic / Latino population 15 years and over
Males 12.5% Never married75.3% Now married1.5% Separated5.2% Widowed5.5% DivorcedFemales 18.5% Never married62.1% Now married0.6% Separated11.5% Widowed7.3% DivorcedWomen who gave birth in the past 12 months Now married:
100.0% (13)Unmarried:
0.0% (0)
Women who did not give birth in the past 12 months Now married:
58.6% (130)Unmarried:
41.4% (92)
Ancestries in Bradfordwoods
96 18.7% Italian85 16.6% German44 8.6% American38 7.4% English30 5.9% Eastern European27 5.3% Irish24 4.7% European20 3.9% Polish11 2.1% French9 1.8% Scottish8 1.6% Scotch-Irish7 1.4% French Canadian7 1.4% Norwegian6 1.2% Hungarian5 1.0% British5 1.0% Slavic3 0.6% Croatian3 0.6% Russian2 0.4% Czech2 0.4% Dutch2 0.4% Pennsylvania German2 0.4% Slovak2 0.4% Ukrainian2 0.4% Welsh
Children Nativity (place of birth) in Bradfordwoods
Children under 6 years - Living with two parents Both parents native 81 100.0% NativeChildren under 6 years - Living with one parent Native parent 7 100.0% Native
Children 6 to 17 years - Living with two parents Both parents native 164 100.0% NativeBoth parents foreign-born 9 100.0% NativeOne native, one foreign-born parent 19 100.0% NativeChildren 6 to 17 years - Living with one parent Native parent 67 100.0% Native
Grandparents responsible for own grandchildren in Bradfordwoods
Grandparents (30 to 59 years) White / Caucasian 3 100.0% Responsible for grandchildrenWhite alone, not Hispanic / Latino 3 100.0% Responsible for grandchildrenGrandparents (60 years and over) White / Caucasian 3 74.5% Responsible for grandchildren1 25.5% Not responsible for grandchildrenWhite alone, not Hispanic / Latino 3 74.3% Responsible for grandchildren1 25.7% Not responsible for grandchildren