Races in Braintree, Massachusetts (MA) Detailed Stats
Ancestries, Foreign-born residents, place of birth

Recent posts about races in Braintree, Massachusetts on our local forum with over 2,400,000 registered users:
 | Proposed new maps for Massachusetts House and Senate districts focus on strengthening minority communities (51 replies) |
| People are leaving Massachusetts in droves. Who are they? (334 replies) |
| 2024 Real Estate Observations (888 replies) |
| 2023 Real Estate Observations (5278 replies) |
| Family house purchase in Boston?! (44 replies) |
| Buying a house in Braintree? Need suggestions (7 replies) |
Latest news about races in Braintree, MA collected exclusively by city-data.com from local newspapers, TV, and radio stations
8.1% of Braintree, MA residents are foreign-born (3.9% born in Europe, 2.2% born in Asia, 0.9% born in Latin America), which is 123.5% less than the foreign-born rate of 18.0% across the entire state of Massachusetts.
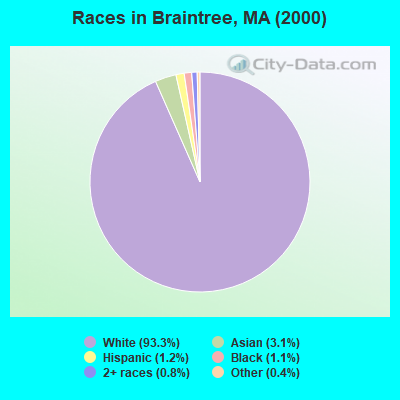
Race distribution in Braintree

- 31,43893.3%White alone
- 1,0433.1%Asian alone
- 3941.2%Hispanic
- 3771.1%Black alone
- 2790.8%Two or more races
- 1280.4%Other race alone
- 310.09%American Indian alone
- 80.02%Native Hawaiian and Other
Pacific Islander alone
2000
2022
-
- 5,198,35981.9%White alone
- 428,7296.8%Hispanic
- 318,3295.0%Black alone
- 236,7863.7%Asian alone
- 110,3381.7%Two or more races
- 43,5860.7%Other race alone
- 11,2640.2%American Indian alone
- 1,7060.03%Native Hawaiian and Other
Pacific Islander alone

-
- 4,676,62767.0%White alone
- 911,03813.0%Hispanic
- 501,4637.2%Asian alone
- 459,7406.6%Black alone
- 341,8894.9%Two or more races
- 84,4031.2%Other race alone
- 5,8380.08%American Indian alone
- 9760.01%Native Hawaiian and Other
Pacific Islander alone

Income and house value in Braintree
- Median household income in 2022
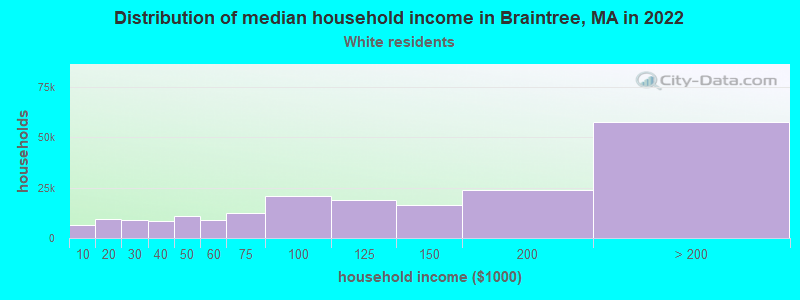
- $115,309White non-Hispanic householders
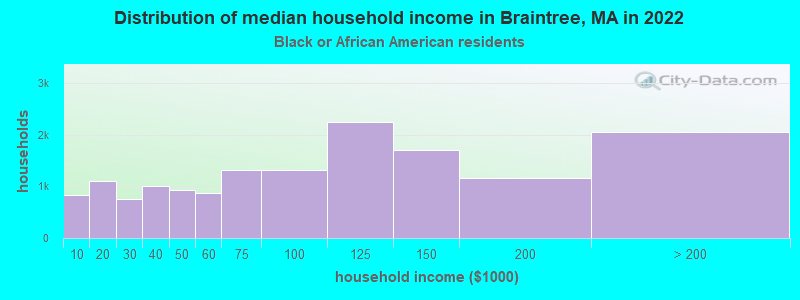
- $83,956Black householders
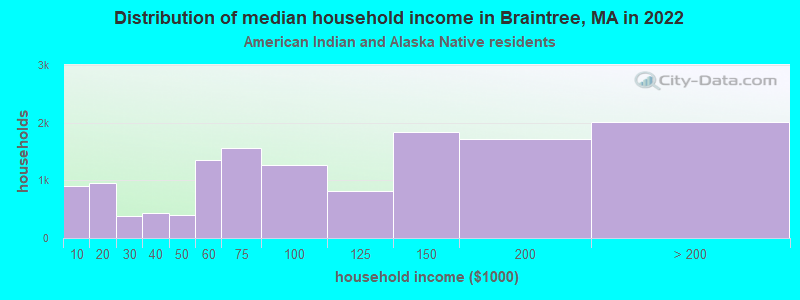
- $164,694American Indian and Alaska Native householders
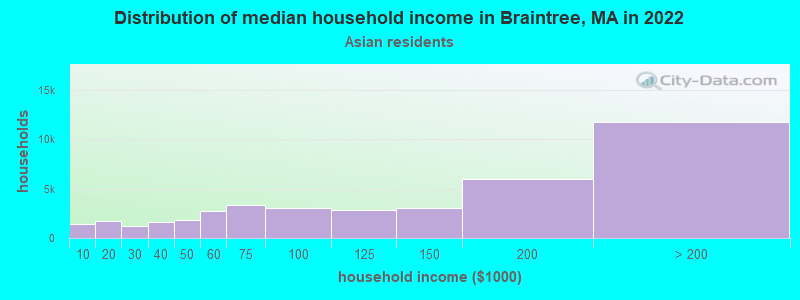
- $168,179Asian householders
- $66,107Some other race householders
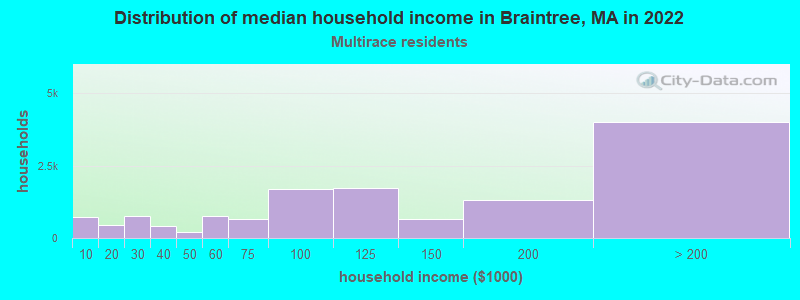
- $107,881Two or more races householders
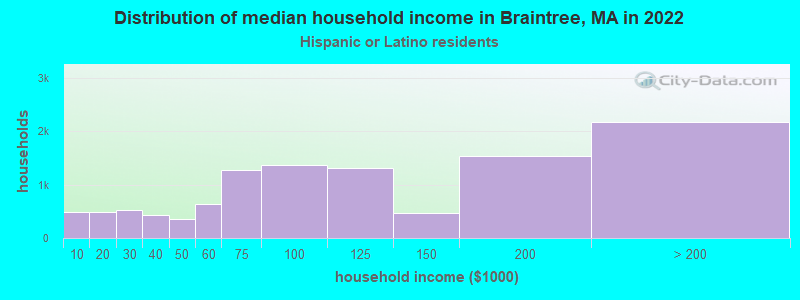
- $87,643Hispanic or Latino race householders
- Median 2022 house value
- $609,648White Non-Hispanic householders
- $466,640Black or African American householders
- $789,700American Indian or Alaska Native householders
- $581,219Asian householders
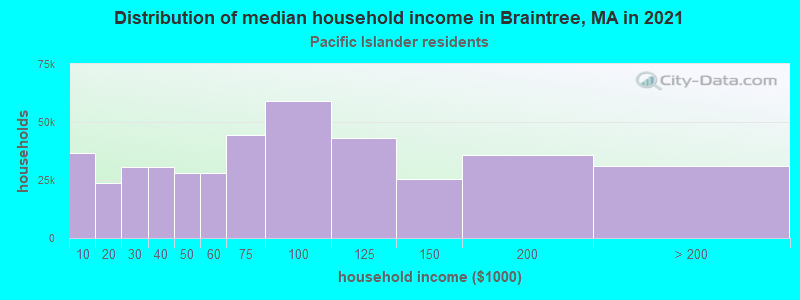
- $466,640Native Hawaiian and other Pacific Islander householders
- $736,000Some other race householders
- $344,596Two or more races householders
- $603,043Hispanic or Latino householders
Household income for White non-Hispanic householders
Household income for Black householders
Household income for American Indian and Alaska Native householders
Household income for Asian householders
Household income for Native Hawaiian and other Pacific Islander householders
Household income for Two or more races householders
Household income for Hispanic or Latino race householders
Foreign-born residents in Braintree
2,714 residents are foreign born (3.9% Europe, 2.2% Asia, 0.9% Latin America).
| This city: | 8.1% |
| Massachusetts: | 12.2% |
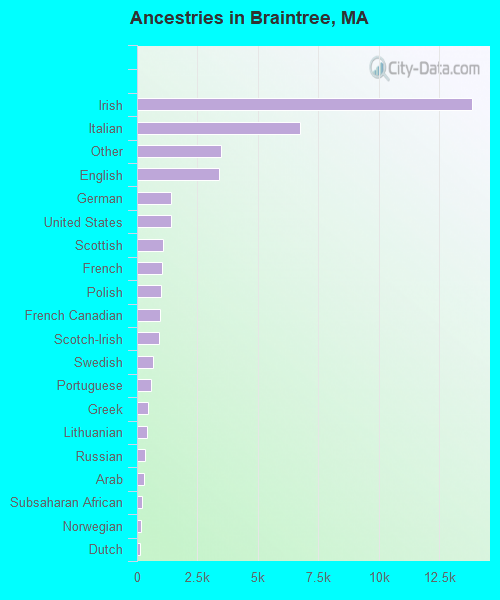
Ancestries in Braintree

- 13,85835.7%Irish
- 6,75217.4%Italian
- 3,4728.9%Other
- 3,3918.7%English
- 1,4143.6%German
- 1,3983.6%United States
- 1,0722.8%Scottish
- 1,0262.6%French
- 9912.6%Polish
- 9382.4%French Canadian
- 9222.4%Scotch-Irish
- 6521.7%Swedish
- 5781.5%Portuguese
- 4431.1%Greek
- 4171.1%Lithuanian
- 3190.8%Russian
- 3090.8%Arab
- 2100.5%Subsaharan African
- 1760.5%Norwegian
- 1270.3%Dutch
- 800.2%Hungarian
- 660.2%Czech
- 590.2%West Indian
- 580.1%Welsh
- 290.07%Danish
- 280.07%Ukrainian
- 210.05%Slovak
Zip codes: 02184.