Races in Brandon, Florida (FL) Detailed Stats
Data:
Races - White alone (%)
Races - White alone (% change since 2000)
Races - Black alone (%)
Races - Black alone (% change since 2000)
Races - American Indian alone (%)
Races - American Indian alone (% change since 2000)
Races - Asian alone (%)
Races - Asian alone (% change since 2000)
Races - Hispanic (%)
Races - Hispanic (% change since 2000)
Races - Native Hawaiian and Other Pacific Islander alone (%)
Races - Native Hawaiian and Other Pacific Islander alone (% change since 2000)
Races - Two or more races(%)
Races - Two or more races(% change since 2000)
Races - Other race alone (%)
Races - Other race alone (% change since 2000)
Racial diversity
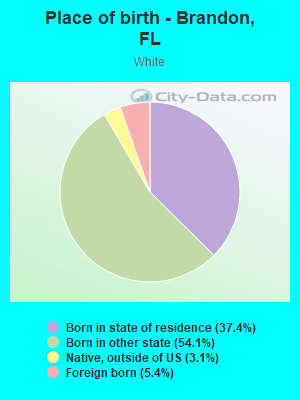
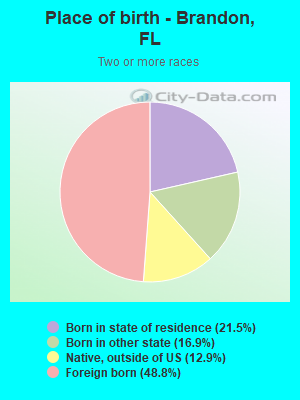
Place of birth - Born in state of residence (%)
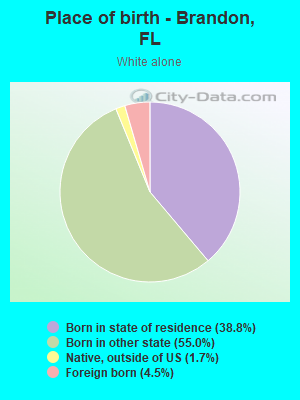
Place of birth - Born in state of residence (%) - White
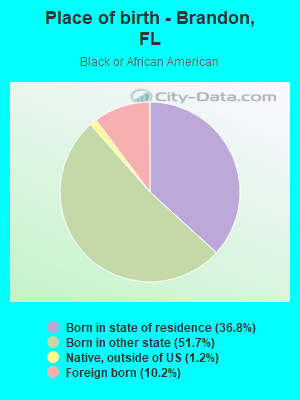
Place of birth - Born in state of residence (%) - Black or African American
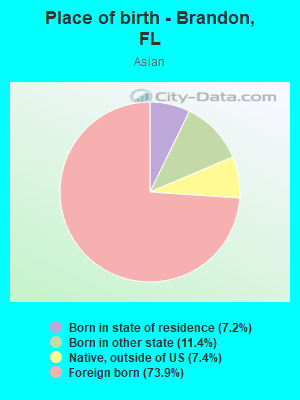
Place of birth - Born in state of residence (%) - Asian
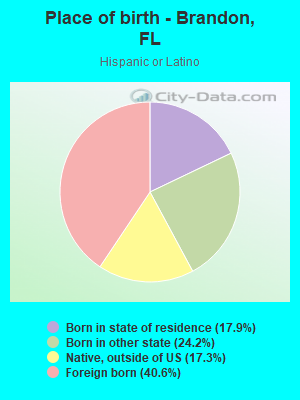
Place of birth - Born in state of residence (%) - Hispanic or Latino
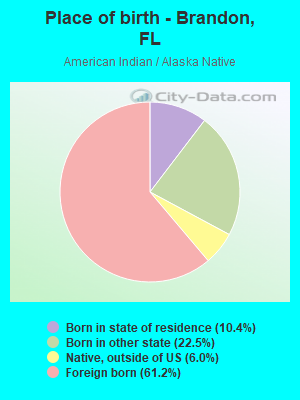
Place of birth - Born in state of residence (%) - American Indian and Alaska Native
Place of birth - Born in state of residence (%) - Multirace
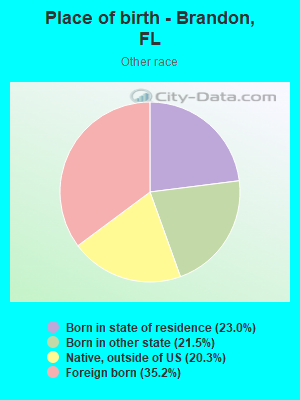
Place of birth - Born in state of residence (%) - Other Race
Place of birth - Born in other state (%)
Place of birth - Born in other state (%) - White
Place of birth - Born in other state (%) - Black or African American
Place of birth - Born in other state (%) - Asian
Place of birth - Born in other state (%) - Hispanic or Latino
Place of birth - Born in other state (%) - American Indian and Alaska Native
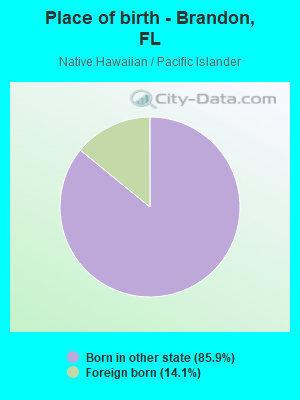
Place of birth - Born in other state (%) - Multirace
Place of birth - Born in other state (%) - Other Race
Place of birth - Native, outside of US (%)
Place of birth - Native, outside of US (%) - White
Place of birth - Native, outside of US (%) - Black or African American
Place of birth - Native, outside of US (%) - Asian
Place of birth - Native, outside of US (%) - Hispanic or Latino
Place of birth - Native, outside of US (%) - American Indian and Alaska Native
Place of birth - Native, outside of US (%) - Multirace
Place of birth - Native, outside of US (%) - Other Race
Place of birth - Foreign born (%)
Place of birth - Foreign born (%) - White
Place of birth - Foreign born (%) - Black or African American
Place of birth - Foreign born (%) - Asian
Place of birth - Foreign born (%) - Hispanic or Latino
Place of birth - Foreign born (%) - American Indian and Alaska Native
Place of birth - Foreign born (%) - Multirace
Place of birth - Foreign born (%) - Other Race
Residents speaking English at home (%)
Residents speaking English at home - Born in the United States (%)
Residents speaking English at home - Native, born elsewhere (%)
Residents speaking English at home - Foreign born (%)
Residents speaking Spanish at home (%)
Residents speaking Spanish at home - Born in the United States (%)
Residents speaking Spanish at home - Native, born elsewhere (%)
Residents speaking Spanish at home - Foreign born (%)
Residents speaking other language at home (%)
Residents speaking other language at home - Born in the United States (%)
Residents speaking other language at home - Native, born elsewhere (%)
Residents speaking other language at home - Foreign born (%)
Marital status - Never married (%)
Marital status - Now married (%)
Marital status - Separated (%)
Marital status - Widowed (%)
Marital status - Divorced (%)
Ancestries Reported - Arab (%)
Ancestries Reported - Czech (%)
Ancestries Reported - Danish (%)
Ancestries Reported - Dutch (%)
Ancestries Reported - English (%)
Ancestries Reported - French (%)
Ancestries Reported - French Canadian (%)
Ancestries Reported - German (%)
Ancestries Reported - Greek (%)
Ancestries Reported - Hungarian (%)
Ancestries Reported - Irish (%)
Ancestries Reported - Italian (%)
Ancestries Reported - Lithuanian (%)
Ancestries Reported - Norwegian (%)
Ancestries Reported - Polish (%)
Ancestries Reported - Portuguese (%)
Ancestries Reported - Russian (%)
Ancestries Reported - Scotch-Irish (%)
Ancestries Reported - Scottish (%)
Ancestries Reported - Slovak (%)
Ancestries Reported - Subsaharan African (%)
Ancestries Reported - Swedish (%)
Ancestries Reported - Swiss (%)
Ancestries Reported - Ukrainian (%)
Ancestries Reported - United States (%)
Ancestries Reported - Welsh (%)
Ancestries Reported - West Indian (%)
Ancestries Reported - Other (%)
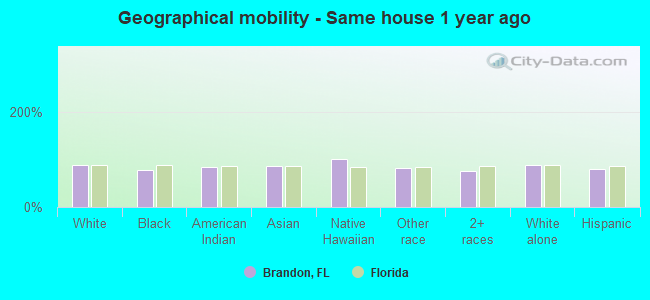
Geographical mobility - Same house 1 year ago (%)
Geographical mobility - Same house 1 year ago (%) - White
Geographical mobility - Same house 1 year ago (%) - Black or African American
Geographical mobility - Same house 1 year ago (%) - Asian
Geographical mobility - Same house 1 year ago (%) - Hispanic or Latino
Geographical mobility - Same house 1 year ago (%) - American Indian and Alaska Native
Geographical mobility - Same house 1 year ago (%) - Multirace
Geographical mobility - Same house 1 year ago (%) - Other Race
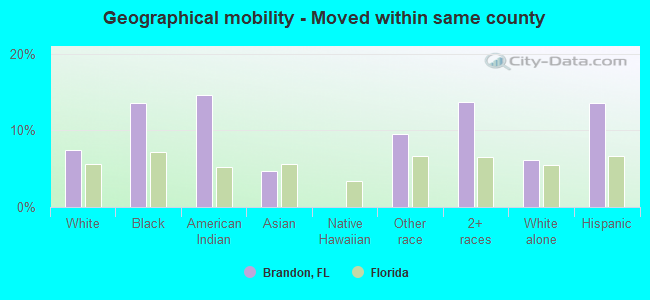
Geographical mobility - Moved within same county (%)
Geographical mobility - Moved within same county (%) - White
Geographical mobility - Moved within same county (%) - Black or African American
Geographical mobility - Moved within same county (%) - Asian
Geographical mobility - Moved within same county (%) - Hispanic or Latino
Geographical mobility - Moved within same county (%) - American Indian and Alaska Native
Geographical mobility - Moved within same county (%) - Multirace
Geographical mobility - Moved within same county (%) - Other Race
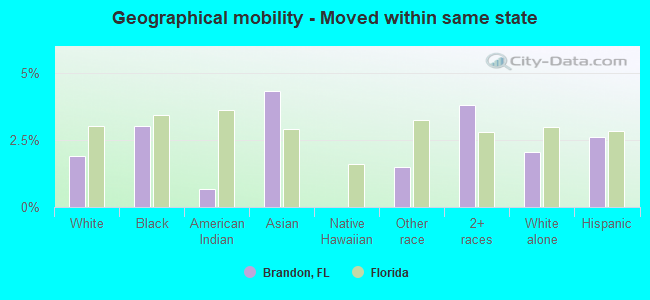
Geographical mobility - Moved from different county within same state (%)
Geographical mobility - Moved from different county within same state (%) - White
Geographical mobility - Moved from different county within same state (%) - Black or African American
Geographical mobility - Moved from different county within same state (%) - Asian
Geographical mobility - Moved from different county within same state (%) - Hispanic or Latino
Geographical mobility - Moved from different county within same state (%) - American Indian and Alaska Native
Geographical mobility - Moved from different county within same state (%) - Multirace
Geographical mobility - Moved from different county within same state (%) - Other Race
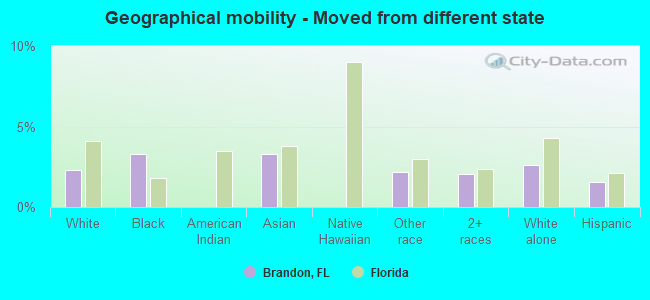
Geographical mobility - Moved from different state (%)
Geographical mobility - Moved from different state (%) - White
Geographical mobility - Moved from different state (%) - Black or African American
Geographical mobility - Moved from different state (%) - Asian
Geographical mobility - Moved from different state (%) - Hispanic or Latino
Geographical mobility - Moved from different state (%) - American Indian and Alaska Native
Geographical mobility - Moved from different state (%) - Multirace
Geographical mobility - Moved from different state (%) - Other Race
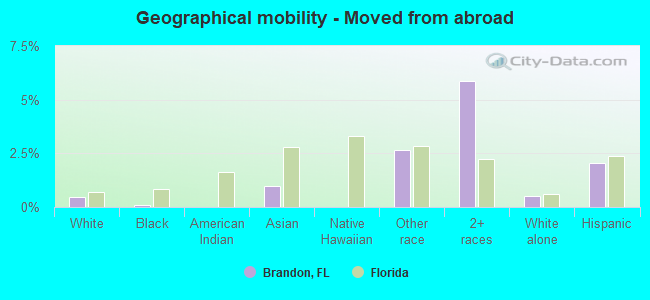
Geographical mobility - Moved from abroad (%)
Geographical mobility - Moved from abroad (%) - White
Geographical mobility - Moved from abroad (%) - Black or African American
Geographical mobility - Moved from abroad (%) - Asian
Geographical mobility - Moved from abroad (%) - Hispanic or Latino
Geographical mobility - Moved from abroad (%) - American Indian and Alaska Native
Geographical mobility - Moved from abroad (%) - Multirace
Geographical mobility - Moved from abroad (%) - Other Race
Place of birth for the foreign-born population - Ireland (%)
Place of birth for the foreign-born population - Denmark (%)
Place of birth for the foreign-born population - Norway (%)
Place of birth for the foreign-born population - Sweden (%)
Place of birth for the foreign-born population - United Kingdom (%)
Place of birth for the foreign-born population - England (%)
Place of birth for the foreign-born population - Scotland (%)
Place of birth for the foreign-born population - Other Northern Europe (%)
Place of birth for the foreign-born population - Austria (%)
Place of birth for the foreign-born population - Belgium (%)
Place of birth for the foreign-born population - France (%)
Place of birth for the foreign-born population - Germany (%)
Place of birth for the foreign-born population - Netherlands (%)
Place of birth for the foreign-born population - Switzerland (%)
Place of birth for the foreign-born population - Other Western Europe (%)
Place of birth for the foreign-born population - Greece (%)
Place of birth for the foreign-born population - Italy (%)
Place of birth for the foreign-born population - Portugal (%)
Place of birth for the foreign-born population - Spain (%)
Place of birth for the foreign-born population - Other Southern Europe (%)
Place of birth for the foreign-born population - Albania (%)
Place of birth for the foreign-born population - Belarus (%)
Place of birth for the foreign-born population - Bosnia and Herzegovina (%)
Place of birth for the foreign-born population - Bulgaria (%)
Place of birth for the foreign-born population - Croatia (%)
Place of birth for the foreign-born population - Czechoslovakia (%)
Place of birth for the foreign-born population - Hungary (%)
Place of birth for the foreign-born population - Latvia (%)
Place of birth for the foreign-born population - Lithuania (%)
Place of birth for the foreign-born population - North Macedonia (Macedonia) (%)
Place of birth for the foreign-born population - Moldova (%)
Place of birth for the foreign-born population - Poland (%)
Place of birth for the foreign-born population - Romania (%)
Place of birth for the foreign-born population - Russia (%)
Place of birth for the foreign-born population - Serbia (%)
Place of birth for the foreign-born population - Ukraine (%)
Place of birth for the foreign-born population - Other Eastern Europe (%)
Place of birth for the foreign-born population - China (%)
Place of birth for the foreign-born population - Hong Kong (%)
Place of birth for the foreign-born population - Taiwan (%)
Place of birth for the foreign-born population - Japan (%)
Place of birth for the foreign-born population - Korea (%)
Place of birth for the foreign-born population - Other Eastern Asia (%)
Place of birth for the foreign-born population - Afghanistan (%)
Place of birth for the foreign-born population - Bangladesh (%)
Place of birth for the foreign-born population - India (%)
Place of birth for the foreign-born population - Iran (%)
Place of birth for the foreign-born population - Kazakhstan (%)
Place of birth for the foreign-born population - Nepal (%)
Place of birth for the foreign-born population - Pakistan (%)
Place of birth for the foreign-born population - Sri Lanka (%)
Place of birth for the foreign-born population - Uzbekistan (%)
Place of birth for the foreign-born population - Other South Central Asia (%)
Place of birth for the foreign-born population - Burma (%)
Place of birth for the foreign-born population - Cambodia (%)
Place of birth for the foreign-born population - Indonesia (%)
Place of birth for the foreign-born population - Laos (%)
Place of birth for the foreign-born population - Malaysia (%)
Place of birth for the foreign-born population - Philippines (%)
Place of birth for the foreign-born population - Singapore (%)
Place of birth for the foreign-born population - Thailand (%)
Place of birth for the foreign-born population - Vietnam (%)
Place of birth for the foreign-born population - Other South Eastern Asia (%)
Place of birth for the foreign-born population - Armenia (%)
Place of birth for the foreign-born population - Iraq (%)
Place of birth for the foreign-born population - Israel (%)
Place of birth for the foreign-born population - Jordan (%)
Place of birth for the foreign-born population - Kuwait (%)
Place of birth for the foreign-born population - Lebanon (%)
Place of birth for the foreign-born population - Saudi Arabia (%)
Place of birth for the foreign-born population - Syria (%)
Place of birth for the foreign-born population - Turkey (%)
Place of birth for the foreign-born population - Yemen (%)
Place of birth for the foreign-born population - Other Western Asia (%)
Place of birth for the foreign-born population - Eritrea (%)
Place of birth for the foreign-born population - Ethiopia (%)
Place of birth for the foreign-born population - Kenya (%)
Place of birth for the foreign-born population - Somalia (%)
Place of birth for the foreign-born population - Uganda (%)
Place of birth for the foreign-born population - Zimbabwe (%)
Place of birth for the foreign-born population - Other Eastern Africa (%)
Place of birth for the foreign-born population - Cameroon (%)
Place of birth for the foreign-born population - Congo (%)
Place of birth for the foreign-born population - Democratic Republic of Congo (Zaire) (%)
Place of birth for the foreign-born population - Other Middle Africa (%)
Place of birth for the foreign-born population - Egypt (%)
Place of birth for the foreign-born population - Morocco (%)
Place of birth for the foreign-born population - Sudan (%)
Place of birth for the foreign-born population - Other Northern Africa (%)
Place of birth for the foreign-born population - South Africa (%)
Place of birth for the foreign-born population - Other Southern Africa (%)
Place of birth for the foreign-born population - Cabo Verde (%)
Place of birth for the foreign-born population - Ghana (%)
Place of birth for the foreign-born population - Liberia (%)
Place of birth for the foreign-born population - Nigeria (%)
Place of birth for the foreign-born population - Senegal (%)
Place of birth for the foreign-born population - Sierra Leone (%)
Place of birth for the foreign-born population - Other Western Africa (%)
Place of birth for the foreign-born population - Australia (%)
Place of birth for the foreign-born population - New Zealand (%)
Place of birth for the foreign-born population - Fiji (%)
Place of birth for the foreign-born population - Micronesia (%)
Place of birth for the foreign-born population - Bahamas (%)
Place of birth for the foreign-born population - Barbados (%)
Place of birth for the foreign-born population - Cuba (%)
Place of birth for the foreign-born population - Dominica (%)
Place of birth for the foreign-born population - Dominican Republic (%)
Place of birth for the foreign-born population - Grenada (%)
Place of birth for the foreign-born population - Haiti (%)
Place of birth for the foreign-born population - Jamaica (%)
Place of birth for the foreign-born population - St. Vincent and the Grenadines (%)
Place of birth for the foreign-born population - Trinidad and Tobago (%)
Place of birth for the foreign-born population - West Indies (%)
Place of birth for the foreign-born population - Other Caribbean (%)
Place of birth for the foreign-born population - Belize (%)
Place of birth for the foreign-born population - Costa Rica (%)
Place of birth for the foreign-born population - El Salvador (%)
Place of birth for the foreign-born population - Guatemala (%)
Place of birth for the foreign-born population - Honduras (%)
Place of birth for the foreign-born population - Mexico (%)
Place of birth for the foreign-born population - Nicaragua (%)
Place of birth for the foreign-born population - Panama (%)
Place of birth for the foreign-born population - Other Central America (%)
Place of birth for the foreign-born population - Argentina (%)
Place of birth for the foreign-born population - Bolivia (%)
Place of birth for the foreign-born population - Brazil (%)
Place of birth for the foreign-born population - Chile (%)
Place of birth for the foreign-born population - Colombia (%)
Place of birth for the foreign-born population - Ecuador (%)
Place of birth for the foreign-born population - Guyana (%)
Place of birth for the foreign-born population - Peru (%)
Place of birth for the foreign-born population - Uruguay (%)
Place of birth for the foreign-born population - Venezuela (%)
Place of birth for the foreign-born population - Other South America (%)
Place of birth for the foreign-born population - Canada (%)
Place of birth for the foreign-born population - Other Northern America (%)
Place of birth for the foreign-born population - Other (%)
Latest news about races in Brandon, FL collected exclusively by city-data.com from local newspapers, TV, and radio stations
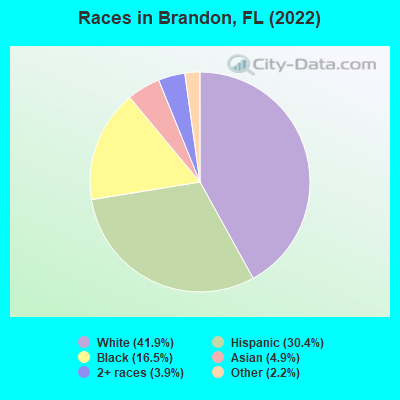
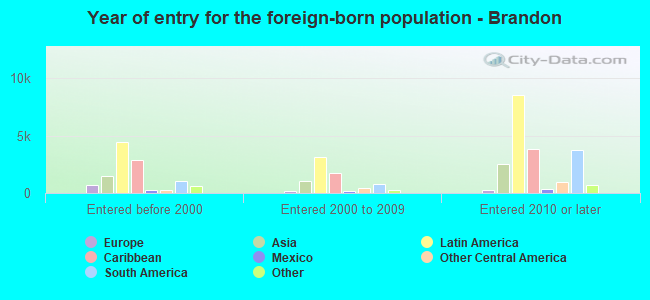
According to 2022 data, the most numerous races in Brandon, FL are White alone (53,085 residents), Hispanic (38,501 residents), and Black alone (20,928 residents). 67.5% of Brandon residents speak English at home. 18.9% of Brandon, FL residents are foreign-born (12.1% born in Latin America, 4.0% born in Asia), which is 10.9% less than the foreign-born rate of 21.0% across the entire state of Florida.
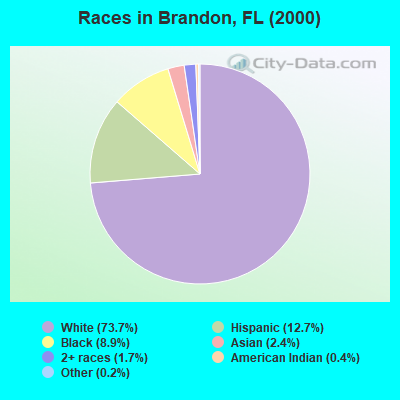
Race distribution in Brandon
2000 2022
57,398 73.7% White alone 9,882 12.7% Hispanic 6,924 8.9% Black alone 1,835 2.4% Asian alone 1,343 1.7% Two or more races 280 0.4% American Indian alone 174 0.2% Other race alone 59 0.08% Native Hawaiian and Other
53,085 41.9% White alone 38,501 30.4% Hispanic 20,928 16.5% Black alone 6,256 4.9% Asian alone 4,973 3.9% Two or more races 2,833 2.2% Other race alone 52 0.04% American Indian alone
2000 2022
10,458,509 65.4% White alone 2,682,715 16.8% Hispanic 2,264,268 14.2% Black alone 261,693 1.6% Asian alone 236,954 1.5% Two or more races 42,358 0.3% American Indian alone 28,994 0.2% Other race alone 6,887 0.04% Native Hawaiian and Other
11,309,403 50.8% White alone 6,025,039 27.1% Hispanic 3,241,015 14.6% Black alone 861,630 3.9% Two or more races 623,692 2.8% Asian alone 152,054 0.7% Other race alone 22,504 0.1% American Indian alone 9,486 0.04% Native Hawaiian and Other
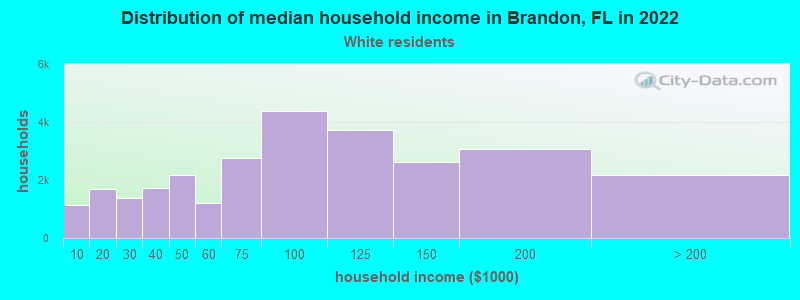
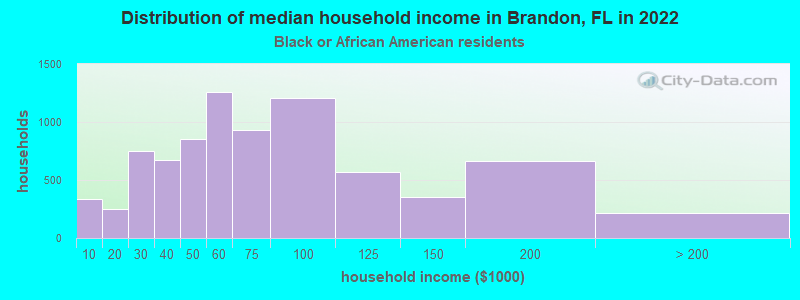
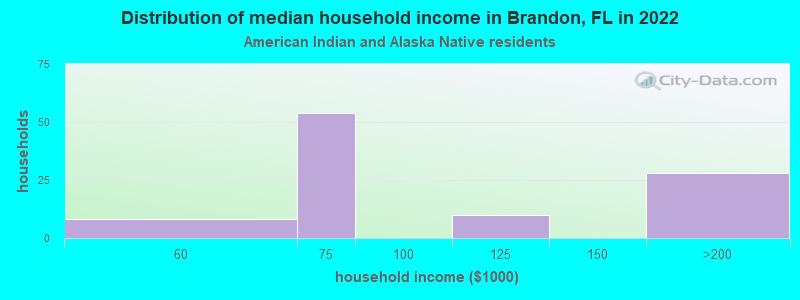
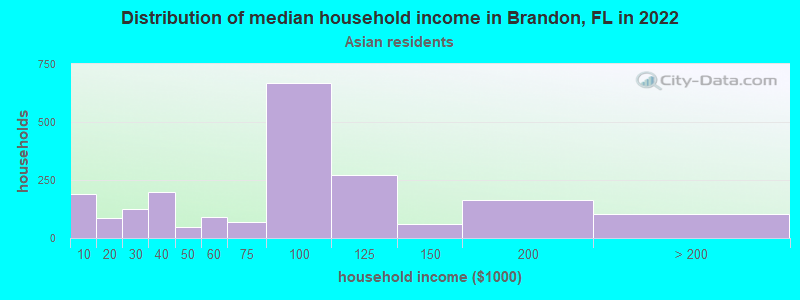
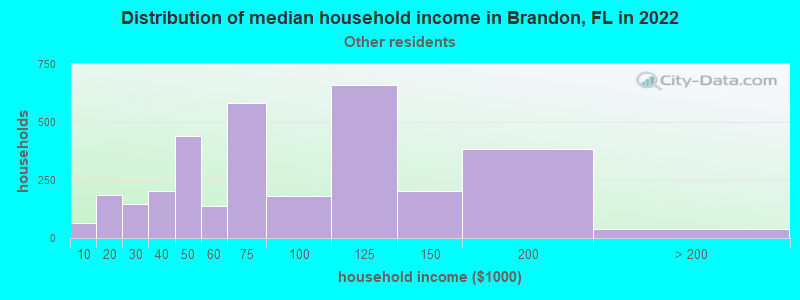
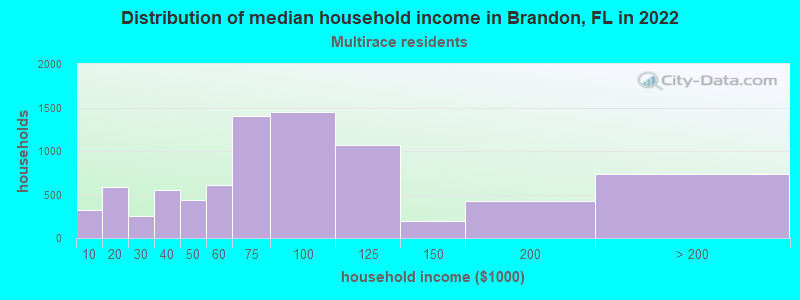
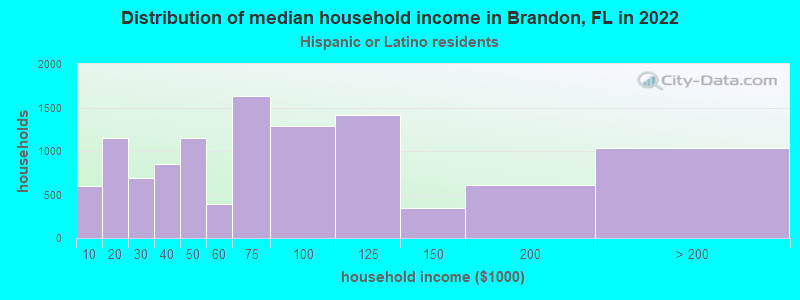
Income and house value in Brandon Median household income in 2022 $87,654 White non-Hispanic householders$53,599 Black householders$68,703 American Indian and Alaska Native householders$72,301 Asian householders$66,845 Some other race householders$90,588 Two or more races householders$66,928 Hispanic or Latino race householdersMedian 2022 house value $328,423 White Non-Hispanic householders$333,296 Black or African American householders$389,820 American Indian or Alaska Native householders $416,782 Asian householders$346,940 Native Hawaiian and other Pacific Islander householders$298,537 Some other race householders$355,061 Two or more races householders$323,550 Hispanic or Latino householders
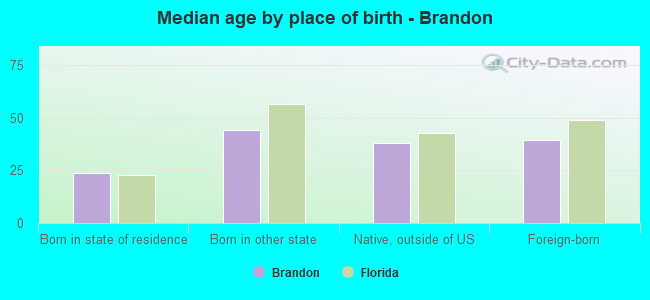
Median age by race in Brandon
44.8 Median age for White residents41.1 49.5 27.6 Median age for Black or African American residents24.8 32.9 45.5 Median age for American Indian / Alaska Native residents46.8 44.2 37.5 Median age for Asian residents31.6 39.1 -666,666,666.0 Median age for Native Hawaiian / Pacific Islander residents-666,666,666.0 -666,666,666.0 33.0 Median age for Other race residents32.6 35.4 30.7 Median age for Two or more races residents31.6 30.5 46.5 Median age for White alone residents43.3 50.1 34.5 Median age for Hispanic or Latino residents33.2 36.6
Owner/renter occupied households by race in Brandon
House owners and renters - White residents 18,484 65.8% Owner occupied9,600 34.2% Renter occupiedHouse owners and renters - Black or African American residents 2,020 26.2% Owner occupied5,686 73.8% Renter occupiedHouse owners and renters - American Indian / Alaska Native residents 38 33.1% Owner occupied77 66.9% Renter occupiedHouse owners and renters - Asian residents 1,186 57.9% Owner occupied862 42.1% Renter occupiedHouse owners and renters - Native Hawaiian / Pacific Islander residents 40 100.0% Owner occupiedHouse owners and renters - Other race residents 1,439 47.1% Owner occupied1,618 52.9% Renter occupiedHouse owners and renters - Two or more races residents 2,698 46.9% Owner occupied3,058 53.1% Renter occupiedHouse owners and renters - White alone residents 17,308 68.0% Owner occupied8,137 32.0% Renter occupiedHouse owners and renters - Hispanic or Latino residents 4,946 44.3% Owner occupied6,208 55.7% Renter occupied
Language usage in Brandon
English speakers - Total 67.5% of residents of Brandon speak English at home.
24.2% of residents speak Spanish at home 15,890 53.8% Speak English very well13,626 46.2% Speak English less than very well8.3% of residents speak other language at home 7,149 70.2% Speak English very well3,040 29.8% Speak English less than very well
English speakers - Born in the United States 87.1% of residents of Brandon speak English at home.
10.7% of residents speak Spanish at home 4,338 79.4% Speak English very well1,128 20.6% Speak English less than very well2.2% of residents speak other language at home 982 85.5% Speak English very well166 14.5% Speak English less than very well
English speakers - Native, born elsewhere 21.8% of residents of Brandon speak English at home.
70.5% of residents speak Spanish at home 3,454 60.0% Speak English very well2,302 40.0% Speak English less than very well7.7% of residents speak other language at home 364 57.9% Speak English very well265 42.1% Speak English less than very well
English speakers - Foreign-born 15.8% of residents of Brandon speak English at home.
56.7% of residents speak Spanish at home 5,840 38.0% Speak English very well9,536 62.0% Speak English less than very well27.5% of residents speak other language at home 5,066 67.9% Speak English very well2,391 32.1% Speak English less than very well
White (Caucasian) - Speak only English Native:
91.4% (51,263)Foreign-born:
18.2% (596)
White (Caucasian) - Speak another language Native:
8.6% (4,800)Foreign-born:
81.8% (2,682)
Black or African American - Speak only English Native:
95.1% (17,873)Foreign-born:
77.0% (1,735)
Black or African American - Speak another language Native:
4.9% (921)Foreign-born:
23.0% (518)
American Indian / Alaska Native - Speak another language Native:
29.6% (64)Foreign-born:
100.0% (378)
Asian - Speak only English Native:
18.6% (274)Foreign-born:
11.5% (532)
Asian - Speak another language Native:
81.4% (1,202)Foreign-born:
88.5% (4,093)
Native Hawaiian / Pacific Islander - Speak only English Native:
87.6% (62)Foreign-born:
100.0% (14)
Other race - Speak only English Native:
39.1% (2,735)Foreign-born:
9.6% (410)
Other race - Speak another language Native:
60.9% (4,261)Foreign-born:
90.4% (3,839)
Two or more races - Speak only English Native:
51.5% (5,968)Foreign-born:
8.5% (998)
Two or more races - Speak another language Native:
48.5% (5,628)Foreign-born:
91.5% (10,748)
White alone - Speak only English Native:
96.9% (47,620)Foreign-born:
21.2% (509)
White alone - Speak another language Native:
3.1% (1,543)Foreign-born:
78.8% (1,888)
Hispanic or Latino - Speak only English Native:
37.1% (8,129)Foreign-born:
1.9% (302)
Hispanic or Latino - Speak another language Native:
62.9% (13,789)Foreign-born:
98.1% (15,330)
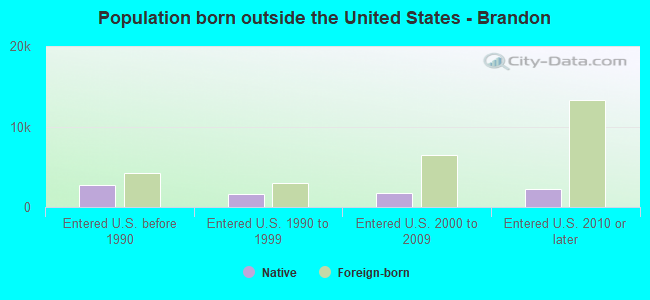
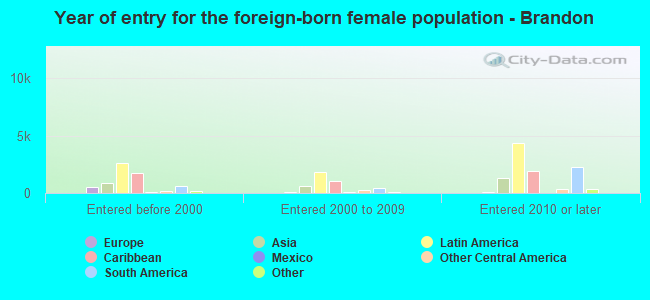
Foreign-born residents in Brandon 22,430 residents are foreign born (12.1% Latin America , 4.0% Asia ).
This city:
18.9%Florida:
21.1%
Marital status for residents in Brandon Marital status - White (Caucasian) population 15 years and over
Males 32.2% Never married51.9% Now married0.3% Separated2.3% Widowed13.4% DivorcedFemales 27.8% Never married44.5% Now married2.2% Separated10.7% Widowed14.9% DivorcedWomen who gave birth in the past 12 months Now married:
36.2% (179)Unmarried:
63.8% (316)
Women who did not give birth in the past 12 months Now married:
34.8% (4,262)Unmarried:
65.2% (7,987)
Marital status - Black or African American population 15 years and over
Males 69.2% Never married22.6% Now married2.4% Separated0.8% Widowed4.9% DivorcedFemales 66.5% Never married18.4% Now married2.5% Separated8.8% Widowed3.8% DivorcedWomen who gave birth in the past 12 months Now married:
29.2% (71)Unmarried:
70.8% (171)
Women who did not give birth in the past 12 months Now married:
27.9% (1,364)Unmarried:
72.1% (3,522)
Marital status - American Indian / Alaska Native population 15 years and over
Males 60.8% Never married9.9% Now married26.4% Separated0.0% Widowed2.8% DivorcedFemales 21.5% Never married43.8% Now married25.6% Separated0.0% Widowed9.1% DivorcedWomen who did not give birth in the past 12 months Now married:
60.6% (80)Unmarried:
39.4% (52)
Marital status - Asian population 15 years and over
Males 34.7% Never married59.2% Now married0.0% Separated1.1% Widowed5.0% DivorcedFemales 19.1% Never married61.4% Now married0.2% Separated7.9% Widowed11.4% DivorcedWomen who gave birth in the past 12 months Now married:
100.0% (53)Unmarried:
0.0% (0)
Women who did not give birth in the past 12 months Now married:
62.1% (977)Unmarried:
37.9% (597)
Marital status - Native Hawaiian / Pacific Islander population 15 years and over
Males 57.9% Never married42.1% Now married0.0% Separated0.0% Widowed0.0% DivorcedFemales 0.0% Never married0.0% Now married0.0% Separated0.0% Widowed100.0% DivorcedWomen who did not give birth in the past 12 months Now married:
0.0% (0)Unmarried:
100.0% (26)
Marital status - Other race population 15 years and over
Males 37.7% Never married47.0% Now married1.2% Separated1.1% Widowed12.9% DivorcedFemales 30.8% Never married39.6% Now married14.3% Separated3.7% Widowed11.6% DivorcedWomen who gave birth in the past 12 months Now married:
66.7% (167)Unmarried:
33.3% (84)
Women who did not give birth in the past 12 months Now married:
35.6% (1,156)Unmarried:
64.4% (2,092)
Marital status - Two or more races population 15 years and over
Males 46.5% Never married43.2% Now married7.2% Separated0.5% Widowed2.7% DivorcedFemales 27.9% Never married57.0% Now married0.9% Separated4.9% Widowed9.4% DivorcedWomen who gave birth in the past 12 months Now married:
100.0% (184)Unmarried:
0.0% (0)
Women who did not give birth in the past 12 months Now married:
50.2% (3,313)Unmarried:
49.8% (3,282)
Marital status - White alone, not Hispanic / Latino population 15 years and over
Males 30.7% Never married53.0% Now married0.3% Separated2.5% Widowed13.5% DivorcedFemales 27.5% Never married46.9% Now married1.5% Separated10.8% Widowed13.3% DivorcedWomen who gave birth in the past 12 months Now married:
57.6% (179)Unmarried:
42.4% (132)
Women who did not give birth in the past 12 months Now married:
34.7% (3,571)Unmarried:
65.3% (6,710)
Marital status - Hispanic or Latino population 15 years and over
Males 44.0% Never married40.9% Now married7.5% Separated0.6% Widowed6.9% DivorcedFemales 31.1% Never married42.2% Now married5.7% Separated6.6% Widowed14.5% DivorcedWomen who gave birth in the past 12 months Now married:
38.5% (115)Unmarried:
61.5% (184)
Women who did not give birth in the past 12 months Now married:
42.6% (4,340)Unmarried:
57.4% (5,856)
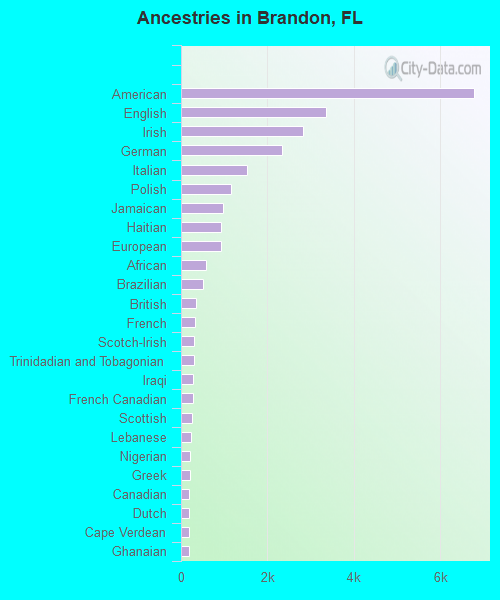
Ancestries in Brandon
6,787 10.3% American3,349 5.1% English2,820 4.3% Irish2,331 3.5% German1,529 2.3% Italian1,164 1.8% Polish978 1.5% Jamaican935 1.4% Haitian914 1.4% European585 0.9% African513 0.8% Brazilian345 0.5% British329 0.5% French301 0.5% Scotch-Irish297 0.5% Trinidadian and Tobagonian277 0.4% Iraqi267 0.4% French Canadian257 0.4% Scottish236 0.4% Lebanese212 0.3% Nigerian210 0.3% Greek187 0.3% Canadian182 0.3% Dutch180 0.3% Cape Verdean178 0.3% Ghanaian172 0.3% Dutch West Indian169 0.3% Moroccan166 0.3% Norwegian165 0.3% Slovak146 0.2% Russian115 0.2% Portuguese114 0.2% Welsh113 0.2% Turkish106 0.2% Hungarian97 0.1% Guyanese83 0.1% Eastern European72 0.1% Zimbabwean70 0.1% Latvian68 0.1% West Indian67 0.1% Bulgarian65 0.10% Swedish64 0.10% Ethiopian62 0.09% Ukrainian62 0.09% Danish61 0.09% Serbian59 0.09% Egyptian54 0.08% Scandinavian49 0.07% Romanian44 0.07% Armenian44 0.07% Arab43 0.07% Iranian36 0.05% Czechoslovakian34 0.05% Slavic32 0.05% Croatian32 0.05% Yugoslavian30 0.05% Swiss29 0.04% Czech28 0.04% Bahamian27 0.04% Palestinian25 0.04% Liberian23 0.03% Pennsylvania German23 0.03% Austrian22 0.03% Lithuanian19 0.03% Estonian18 0.03% Celtic13 0.02% Northern European11 0.02% Finnish11 0.02% Belizean9 0.01% U.S. Virgin Islander6 0.01% Jordanian6 0.01% Israeli5 0.01% Slovene4 0.01% Albanian
Geographical mobility in Brandon Same house 1 year ago 53,441 87.9% White (Caucasian)14,998 76.6% Black or African American484 82.9% American Indian / Alaska Native4,885 86.1% Asian88 100.0% Native Hawaiian / Pacific Islander8,902 81.7% Other race17,884 74.6% Two or more races46,926 88.7% White alone, not Hispanic / Latino30,740 80.2% Hispanic or LatinoMoved within same county 4,558 7.5% White / Caucasian2,651 13.5% Black or African American85 14.6% American Indian / Alaska Native265 4.7% Asian1,038 9.5% Other race3,280 13.7% Two or more races3,249 6.1% White alone, not Hispanic / Latino5,202 13.6% Hispanic or LatinoMoved within same state 1,157 1.9% White / Caucasian589 3.0% Black or African American4 0.7% American Indian / Alaska Native245 4.3% Asian164 1.5% Other race908 3.8% Two or more races1,078 2.0% White alone, not Hispanic / Latino997 2.6% Hispanic or LatinoMoved from different state 1,384 2.3% White / Caucasian640 3.3% Black or African American188 3.3% Asian236 2.2% Other race497 2.1% Two or more races1,384 2.6% White alone, not Hispanic / Latino599 1.6% Hispanic or LatinoMoved from abroad 283 0.5% White15 0.1% Black or African American55 1.0% Asian288 2.6% Other race1,402 5.8% Two or more races283 0.5% White alone, not Hispanic / Latino792 2.1% Hispanic or Latino
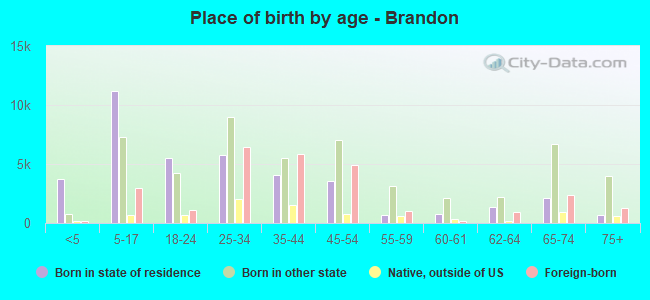
Children Nativity (place of birth) in Brandon
Children under 6 years - Living with two parents Both parents native 1,722 100.0% NativeBoth parents foreign-born 1,120 84.5% Native206 15.5% Foreign-bornOne native, one foreign-born parent 398 100.0% NativeChildren under 6 years - Living with one parent Native parent 1,906 100.0% NativeForeign-born parent 675 100.0% NativeChildren 6 to 17 years - Living with two parents Both parents native 4,202 100.0% NativeBoth parents foreign-born 1,612 48.9% Native1,686 51.1% Foreign-bornOne native, one foreign-born parent 1,171 100.0% NativeChildren 6 to 17 years - Living with one parent Native parent 6,353 96.4% Native235 3.6% Foreign-bornForeign-born parent 1,941 69.5% Native853 30.5% Foreign-born
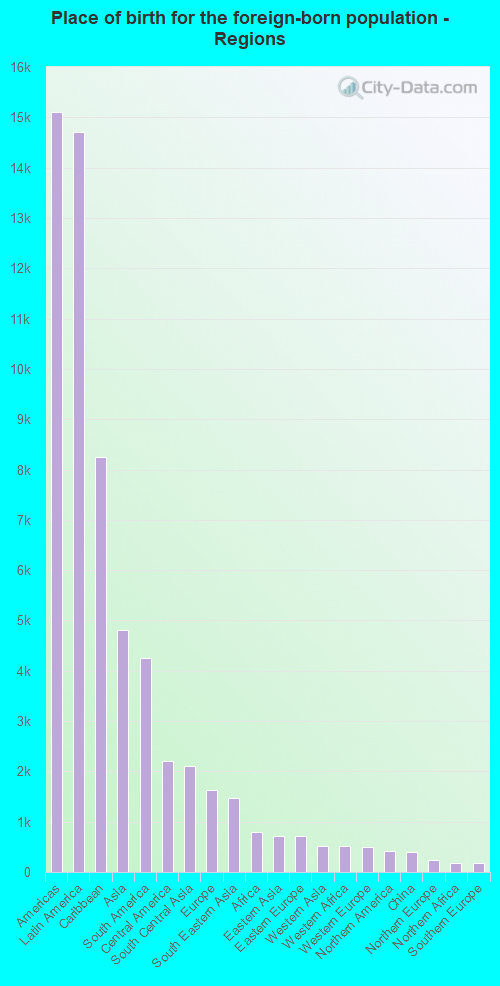
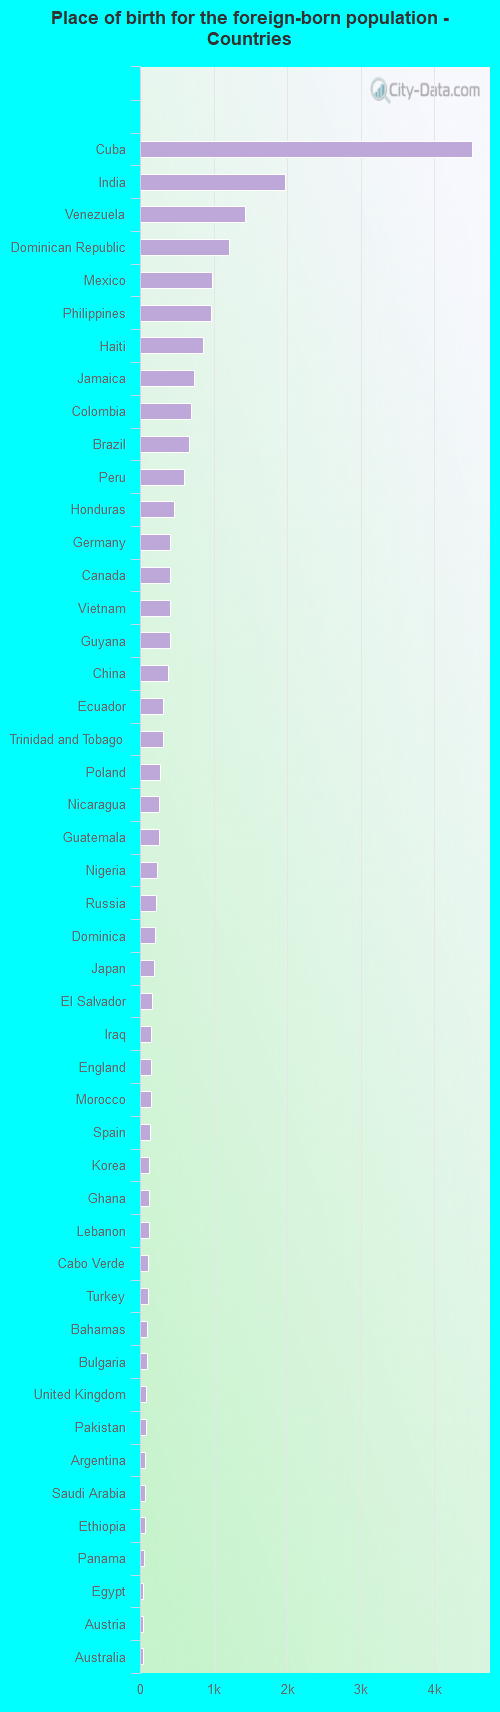
Place of birth for residents in Brandon 15,113 Americas14,703 Latin America8,247 Caribbean4,819 Asia4,247 South America2,208 Central America2,116 South Central Asia1,622 Europe1,475 South Eastern Asia800 Africa714 Eastern Asia706 Eastern Europe512 Western Asia512 Western Africa506 Western Europe409 Northern America395 China238 Northern Europe187 Northern Africa171 Southern Europe93 Eastern Africa74 Oceania42 Australia and New Zealand Subregion6 Southern Africa4,522 Cuba1,976 India1,426 Venezuela1,208 Dominican Republic973 Mexico965 Philippines858 Haiti738 Jamaica699 Colombia668 Brazil598 Peru463 Honduras413 Germany409 Canada403 Vietnam402 Guyana378 China313 Ecuador308 Trinidad and Tobago275 Poland265 Nicaragua260 Guatemala227 Nigeria224 Russia203 Dominica188 Japan161 El Salvador147 Iraq144 England143 Morocco135 Spain129 Korea122 Ghana119 Lebanon111 Cabo Verde111 Turkey95 Bahamas91 Bulgaria88 United Kingdom88 Pakistan70 Argentina70 Saudi Arabia68 Ethiopia58 Panama44 Egypt42 Austria42 Australia40 Israel40 Uruguay38 France35 Laos34 Malaysia27 Chile27 Liberia25 West Indies24 Ivory Coast23 Ukraine21 Nepal20 Portugal18 Iran17 Taiwan17 Thailand17 Cambodia15 Jordan14 Grenada14 Belize11 Costa Rica11 Netherlands11 Sri Lanka9 Latvia9 Greece9 Eritrea8 Bosnia and Herzegovina8 Kuwait7 Fiji7 Romania7 Kenya6 Italy6 South Africa5 Denmark5 Albania
Grandparents responsible for own grandchildren in Brandon
Grandparents (30 to 59 years) White / Caucasian 148 44.6% Responsible for grandchildren184 55.4% Not responsible for grandchildrenBlack or African American 15 14.6% Responsible for grandchildren86 85.4% Not responsible for grandchildrenAsian 29 100.0% Not responsible for grandchildrenOther race 51 40.7% Responsible for grandchildren74 59.3% Not responsible for grandchildrenTwo or more races 51 52.0% Responsible for grandchildren47 48.0% Not responsible for grandchildrenWhite alone, not Hispanic / Latino 180 68.4% Responsible for grandchildren83 31.6% Not responsible for grandchildrenHispanic or Latino 135 45.9% Responsible for grandchildren159 54.1% Not responsible for grandchildrenGrandparents (60 years and over) White / Caucasian 369 50.6% Responsible for grandchildren360 49.4% Not responsible for grandchildrenBlack or African American 158 56.5% Responsible for grandchildren121 43.5% Not responsible for grandchildrenAsian 19 62.0% Responsible for grandchildren11 38.0% Not responsible for grandchildrenOther race 550 100.0% Not responsible for grandchildrenTwo or more races 52 9.5% Responsible for grandchildren497 90.5% Not responsible for grandchildrenWhite alone, not Hispanic / Latino 365 48.4% Responsible for grandchildren390 51.6% Not responsible for grandchildrenHispanic or Latino 57 7.6% Responsible for grandchildren695 92.4% Not responsible for grandchildren