Races in Branson, Missouri (MO) Detailed Stats
Data:
Races - White alone (%)
Races - White alone (% change since 2000)
Races - Black alone (%)
Races - Black alone (% change since 2000)
Races - American Indian alone (%)
Races - American Indian alone (% change since 2000)
Races - Asian alone (%)
Races - Asian alone (% change since 2000)
Races - Hispanic (%)
Races - Hispanic (% change since 2000)
Races - Native Hawaiian and Other Pacific Islander alone (%)
Races - Native Hawaiian and Other Pacific Islander alone (% change since 2000)
Races - Two or more races(%)
Races - Two or more races(% change since 2000)
Races - Other race alone (%)
Races - Other race alone (% change since 2000)
Racial diversity
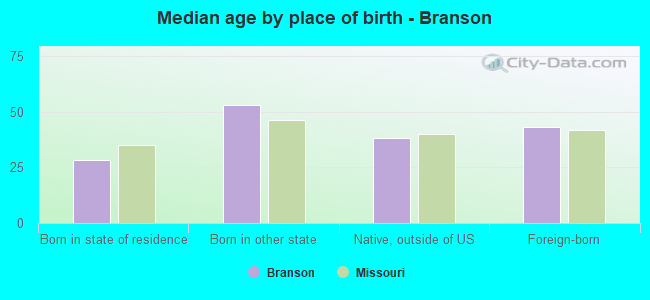
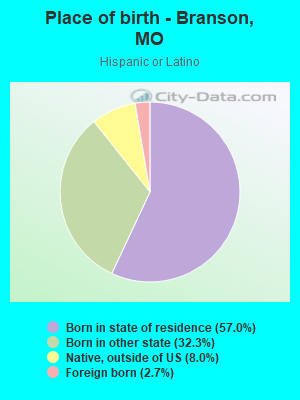
Place of birth - Born in state of residence (%)
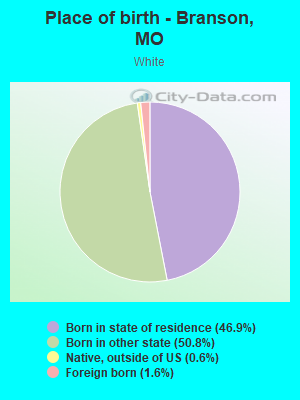
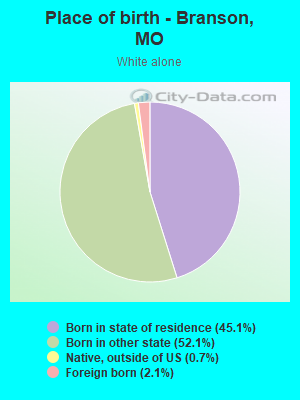
Place of birth - Born in state of residence (%) - White
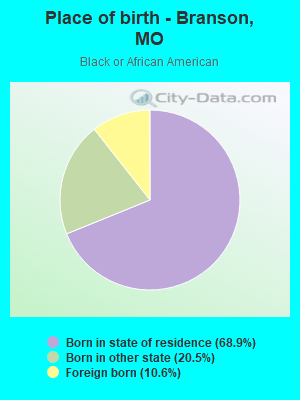
Place of birth - Born in state of residence (%) - Black or African American
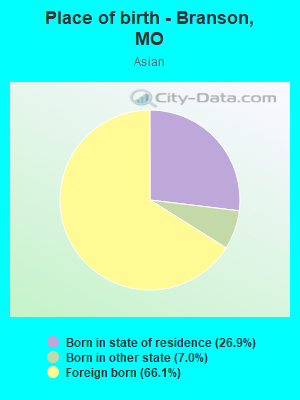
Place of birth - Born in state of residence (%) - Asian
Place of birth - Born in state of residence (%) - Hispanic or Latino
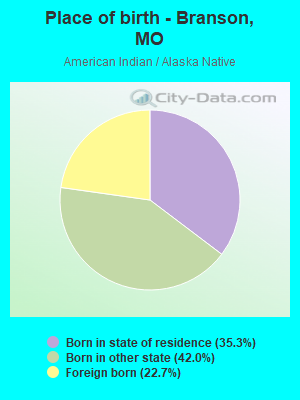
Place of birth - Born in state of residence (%) - American Indian and Alaska Native
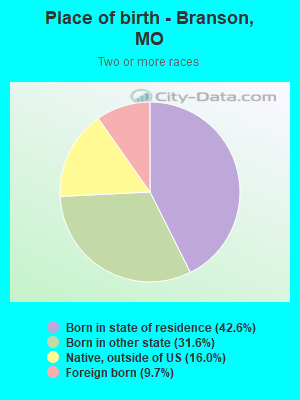
Place of birth - Born in state of residence (%) - Multirace
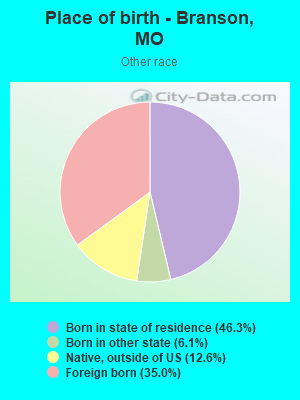
Place of birth - Born in state of residence (%) - Other Race
Place of birth - Born in other state (%)
Place of birth - Born in other state (%) - White
Place of birth - Born in other state (%) - Black or African American
Place of birth - Born in other state (%) - Asian
Place of birth - Born in other state (%) - Hispanic or Latino
Place of birth - Born in other state (%) - American Indian and Alaska Native
Place of birth - Born in other state (%) - Multirace
Place of birth - Born in other state (%) - Other Race
Place of birth - Native, outside of US (%)
Place of birth - Native, outside of US (%) - White
Place of birth - Native, outside of US (%) - Black or African American
Place of birth - Native, outside of US (%) - Asian
Place of birth - Native, outside of US (%) - Hispanic or Latino
Place of birth - Native, outside of US (%) - American Indian and Alaska Native
Place of birth - Native, outside of US (%) - Multirace
Place of birth - Native, outside of US (%) - Other Race
Place of birth - Foreign born (%)
Place of birth - Foreign born (%) - White
Place of birth - Foreign born (%) - Black or African American
Place of birth - Foreign born (%) - Asian
Place of birth - Foreign born (%) - Hispanic or Latino
Place of birth - Foreign born (%) - American Indian and Alaska Native
Place of birth - Foreign born (%) - Multirace
Place of birth - Foreign born (%) - Other Race
Residents speaking English at home (%)
Residents speaking English at home - Born in the United States (%)
Residents speaking English at home - Native, born elsewhere (%)
Residents speaking English at home - Foreign born (%)
Residents speaking Spanish at home (%)
Residents speaking Spanish at home - Born in the United States (%)
Residents speaking Spanish at home - Native, born elsewhere (%)
Residents speaking Spanish at home - Foreign born (%)
Residents speaking other language at home (%)
Residents speaking other language at home - Born in the United States (%)
Residents speaking other language at home - Native, born elsewhere (%)
Residents speaking other language at home - Foreign born (%)
Marital status - Never married (%)
Marital status - Now married (%)
Marital status - Separated (%)
Marital status - Widowed (%)
Marital status - Divorced (%)
Ancestries Reported - Arab (%)
Ancestries Reported - Czech (%)
Ancestries Reported - Danish (%)
Ancestries Reported - Dutch (%)
Ancestries Reported - English (%)
Ancestries Reported - French (%)
Ancestries Reported - French Canadian (%)
Ancestries Reported - German (%)
Ancestries Reported - Greek (%)
Ancestries Reported - Hungarian (%)
Ancestries Reported - Irish (%)
Ancestries Reported - Italian (%)
Ancestries Reported - Lithuanian (%)
Ancestries Reported - Norwegian (%)
Ancestries Reported - Polish (%)
Ancestries Reported - Portuguese (%)
Ancestries Reported - Russian (%)
Ancestries Reported - Scotch-Irish (%)
Ancestries Reported - Scottish (%)
Ancestries Reported - Slovak (%)
Ancestries Reported - Subsaharan African (%)
Ancestries Reported - Swedish (%)
Ancestries Reported - Swiss (%)
Ancestries Reported - Ukrainian (%)
Ancestries Reported - United States (%)
Ancestries Reported - Welsh (%)
Ancestries Reported - West Indian (%)
Ancestries Reported - Other (%)
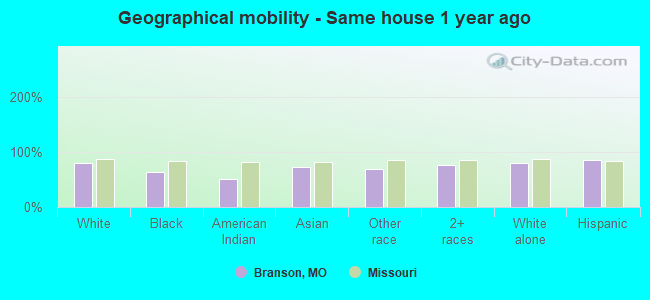
Geographical mobility - Same house 1 year ago (%)
Geographical mobility - Same house 1 year ago (%) - White
Geographical mobility - Same house 1 year ago (%) - Black or African American
Geographical mobility - Same house 1 year ago (%) - Asian
Geographical mobility - Same house 1 year ago (%) - Hispanic or Latino
Geographical mobility - Same house 1 year ago (%) - American Indian and Alaska Native
Geographical mobility - Same house 1 year ago (%) - Multirace
Geographical mobility - Same house 1 year ago (%) - Other Race
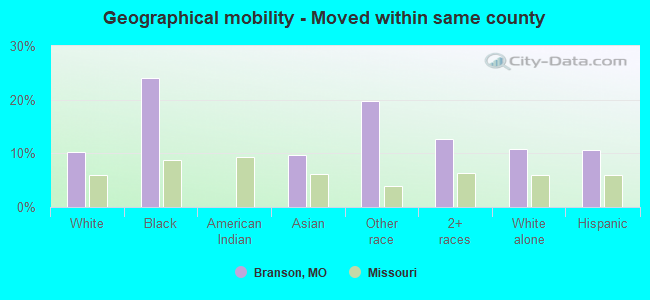
Geographical mobility - Moved within same county (%)
Geographical mobility - Moved within same county (%) - White
Geographical mobility - Moved within same county (%) - Black or African American
Geographical mobility - Moved within same county (%) - Asian
Geographical mobility - Moved within same county (%) - Hispanic or Latino
Geographical mobility - Moved within same county (%) - American Indian and Alaska Native
Geographical mobility - Moved within same county (%) - Multirace
Geographical mobility - Moved within same county (%) - Other Race
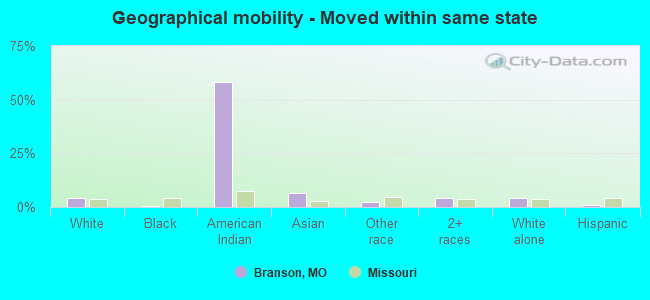
Geographical mobility - Moved from different county within same state (%)
Geographical mobility - Moved from different county within same state (%) - White
Geographical mobility - Moved from different county within same state (%) - Black or African American
Geographical mobility - Moved from different county within same state (%) - Asian
Geographical mobility - Moved from different county within same state (%) - Hispanic or Latino
Geographical mobility - Moved from different county within same state (%) - American Indian and Alaska Native
Geographical mobility - Moved from different county within same state (%) - Multirace
Geographical mobility - Moved from different county within same state (%) - Other Race
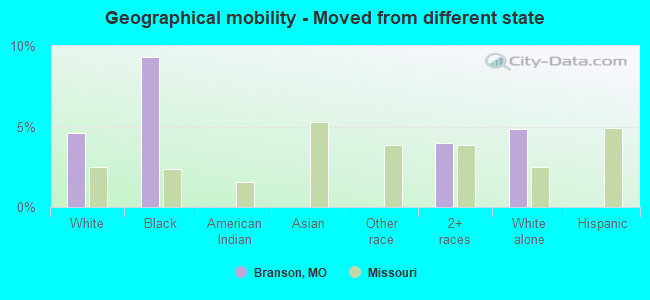
Geographical mobility - Moved from different state (%)
Geographical mobility - Moved from different state (%) - White
Geographical mobility - Moved from different state (%) - Black or African American
Geographical mobility - Moved from different state (%) - Asian
Geographical mobility - Moved from different state (%) - Hispanic or Latino
Geographical mobility - Moved from different state (%) - American Indian and Alaska Native
Geographical mobility - Moved from different state (%) - Multirace
Geographical mobility - Moved from different state (%) - Other Race
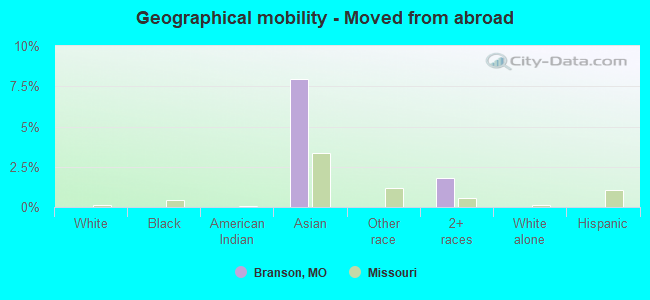
Geographical mobility - Moved from abroad (%)
Geographical mobility - Moved from abroad (%) - White
Geographical mobility - Moved from abroad (%) - Black or African American
Geographical mobility - Moved from abroad (%) - Asian
Geographical mobility - Moved from abroad (%) - Hispanic or Latino
Geographical mobility - Moved from abroad (%) - American Indian and Alaska Native
Geographical mobility - Moved from abroad (%) - Multirace
Geographical mobility - Moved from abroad (%) - Other Race
Place of birth for the foreign-born population - Ireland (%)
Place of birth for the foreign-born population - Denmark (%)
Place of birth for the foreign-born population - Norway (%)
Place of birth for the foreign-born population - Sweden (%)
Place of birth for the foreign-born population - United Kingdom (%)
Place of birth for the foreign-born population - England (%)
Place of birth for the foreign-born population - Scotland (%)
Place of birth for the foreign-born population - Other Northern Europe (%)
Place of birth for the foreign-born population - Austria (%)
Place of birth for the foreign-born population - Belgium (%)
Place of birth for the foreign-born population - France (%)
Place of birth for the foreign-born population - Germany (%)
Place of birth for the foreign-born population - Netherlands (%)
Place of birth for the foreign-born population - Switzerland (%)
Place of birth for the foreign-born population - Other Western Europe (%)
Place of birth for the foreign-born population - Greece (%)
Place of birth for the foreign-born population - Italy (%)
Place of birth for the foreign-born population - Portugal (%)
Place of birth for the foreign-born population - Spain (%)
Place of birth for the foreign-born population - Other Southern Europe (%)
Place of birth for the foreign-born population - Albania (%)
Place of birth for the foreign-born population - Belarus (%)
Place of birth for the foreign-born population - Bosnia and Herzegovina (%)
Place of birth for the foreign-born population - Bulgaria (%)
Place of birth for the foreign-born population - Croatia (%)
Place of birth for the foreign-born population - Czechoslovakia (%)
Place of birth for the foreign-born population - Hungary (%)
Place of birth for the foreign-born population - Latvia (%)
Place of birth for the foreign-born population - Lithuania (%)
Place of birth for the foreign-born population - North Macedonia (Macedonia) (%)
Place of birth for the foreign-born population - Moldova (%)
Place of birth for the foreign-born population - Poland (%)
Place of birth for the foreign-born population - Romania (%)
Place of birth for the foreign-born population - Russia (%)
Place of birth for the foreign-born population - Serbia (%)
Place of birth for the foreign-born population - Ukraine (%)
Place of birth for the foreign-born population - Other Eastern Europe (%)
Place of birth for the foreign-born population - China (%)
Place of birth for the foreign-born population - Hong Kong (%)
Place of birth for the foreign-born population - Taiwan (%)
Place of birth for the foreign-born population - Japan (%)
Place of birth for the foreign-born population - Korea (%)
Place of birth for the foreign-born population - Other Eastern Asia (%)
Place of birth for the foreign-born population - Afghanistan (%)
Place of birth for the foreign-born population - Bangladesh (%)
Place of birth for the foreign-born population - India (%)
Place of birth for the foreign-born population - Iran (%)
Place of birth for the foreign-born population - Kazakhstan (%)
Place of birth for the foreign-born population - Nepal (%)
Place of birth for the foreign-born population - Pakistan (%)
Place of birth for the foreign-born population - Sri Lanka (%)
Place of birth for the foreign-born population - Uzbekistan (%)
Place of birth for the foreign-born population - Other South Central Asia (%)
Place of birth for the foreign-born population - Burma (%)
Place of birth for the foreign-born population - Cambodia (%)
Place of birth for the foreign-born population - Indonesia (%)
Place of birth for the foreign-born population - Laos (%)
Place of birth for the foreign-born population - Malaysia (%)
Place of birth for the foreign-born population - Philippines (%)
Place of birth for the foreign-born population - Singapore (%)
Place of birth for the foreign-born population - Thailand (%)
Place of birth for the foreign-born population - Vietnam (%)
Place of birth for the foreign-born population - Other South Eastern Asia (%)
Place of birth for the foreign-born population - Armenia (%)
Place of birth for the foreign-born population - Iraq (%)
Place of birth for the foreign-born population - Israel (%)
Place of birth for the foreign-born population - Jordan (%)
Place of birth for the foreign-born population - Kuwait (%)
Place of birth for the foreign-born population - Lebanon (%)
Place of birth for the foreign-born population - Saudi Arabia (%)
Place of birth for the foreign-born population - Syria (%)
Place of birth for the foreign-born population - Turkey (%)
Place of birth for the foreign-born population - Yemen (%)
Place of birth for the foreign-born population - Other Western Asia (%)
Place of birth for the foreign-born population - Eritrea (%)
Place of birth for the foreign-born population - Ethiopia (%)
Place of birth for the foreign-born population - Kenya (%)
Place of birth for the foreign-born population - Somalia (%)
Place of birth for the foreign-born population - Uganda (%)
Place of birth for the foreign-born population - Zimbabwe (%)
Place of birth for the foreign-born population - Other Eastern Africa (%)
Place of birth for the foreign-born population - Cameroon (%)
Place of birth for the foreign-born population - Congo (%)
Place of birth for the foreign-born population - Democratic Republic of Congo (Zaire) (%)
Place of birth for the foreign-born population - Other Middle Africa (%)
Place of birth for the foreign-born population - Egypt (%)
Place of birth for the foreign-born population - Morocco (%)
Place of birth for the foreign-born population - Sudan (%)
Place of birth for the foreign-born population - Other Northern Africa (%)
Place of birth for the foreign-born population - South Africa (%)
Place of birth for the foreign-born population - Other Southern Africa (%)
Place of birth for the foreign-born population - Cabo Verde (%)
Place of birth for the foreign-born population - Ghana (%)
Place of birth for the foreign-born population - Liberia (%)
Place of birth for the foreign-born population - Nigeria (%)
Place of birth for the foreign-born population - Senegal (%)
Place of birth for the foreign-born population - Sierra Leone (%)
Place of birth for the foreign-born population - Other Western Africa (%)
Place of birth for the foreign-born population - Australia (%)
Place of birth for the foreign-born population - New Zealand (%)
Place of birth for the foreign-born population - Fiji (%)
Place of birth for the foreign-born population - Micronesia (%)
Place of birth for the foreign-born population - Bahamas (%)
Place of birth for the foreign-born population - Barbados (%)
Place of birth for the foreign-born population - Cuba (%)
Place of birth for the foreign-born population - Dominica (%)
Place of birth for the foreign-born population - Dominican Republic (%)
Place of birth for the foreign-born population - Grenada (%)
Place of birth for the foreign-born population - Haiti (%)
Place of birth for the foreign-born population - Jamaica (%)
Place of birth for the foreign-born population - St. Vincent and the Grenadines (%)
Place of birth for the foreign-born population - Trinidad and Tobago (%)
Place of birth for the foreign-born population - West Indies (%)
Place of birth for the foreign-born population - Other Caribbean (%)
Place of birth for the foreign-born population - Belize (%)
Place of birth for the foreign-born population - Costa Rica (%)
Place of birth for the foreign-born population - El Salvador (%)
Place of birth for the foreign-born population - Guatemala (%)
Place of birth for the foreign-born population - Honduras (%)
Place of birth for the foreign-born population - Mexico (%)
Place of birth for the foreign-born population - Nicaragua (%)
Place of birth for the foreign-born population - Panama (%)
Place of birth for the foreign-born population - Other Central America (%)
Place of birth for the foreign-born population - Argentina (%)
Place of birth for the foreign-born population - Bolivia (%)
Place of birth for the foreign-born population - Brazil (%)
Place of birth for the foreign-born population - Chile (%)
Place of birth for the foreign-born population - Colombia (%)
Place of birth for the foreign-born population - Ecuador (%)
Place of birth for the foreign-born population - Guyana (%)
Place of birth for the foreign-born population - Peru (%)
Place of birth for the foreign-born population - Uruguay (%)
Place of birth for the foreign-born population - Venezuela (%)
Place of birth for the foreign-born population - Other South America (%)
Place of birth for the foreign-born population - Canada (%)
Place of birth for the foreign-born population - Other Northern America (%)
Place of birth for the foreign-born population - Other (%)
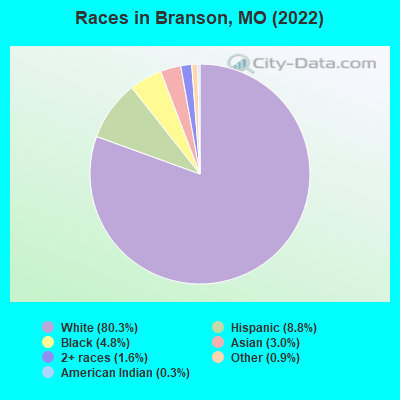
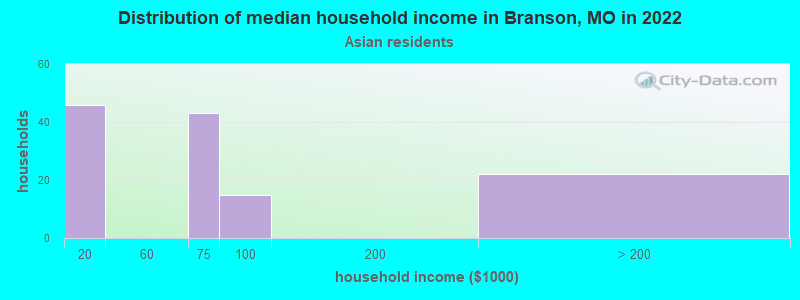
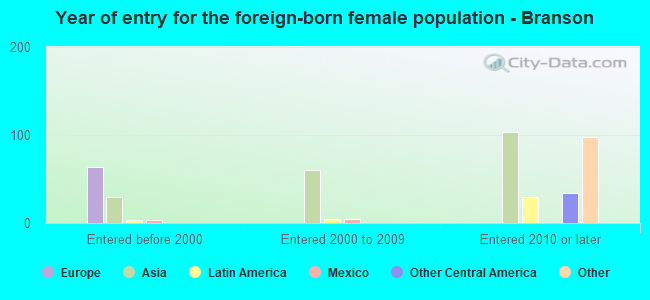
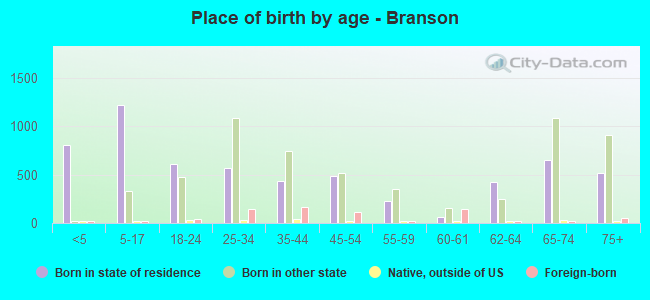
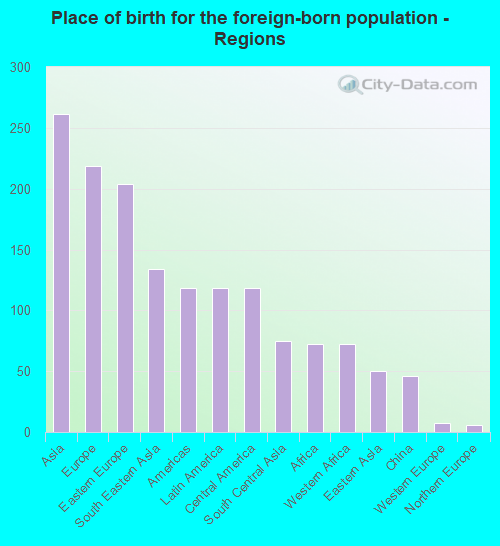
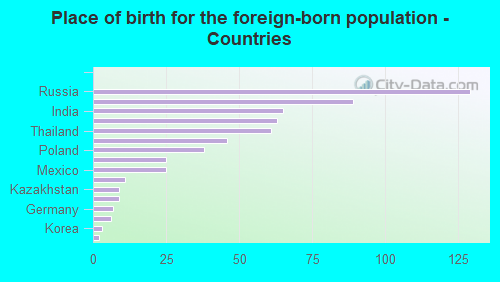
According to 2022 data, the most numerous races in Branson, MO are White alone (10,199 residents), Black alone (612 residents), and Two or more races (204 residents). 91.9% of Branson residents speak English at home. 5.3% of Branson, MO residents are foreign-born (2.1% born in Asia, 1.8% born in Europe, 1.0% born in Latin America, 0.6% born in Africa), which is 24.3% greater than the foreign-born rate of 4.0% across the entire state of Missouri.
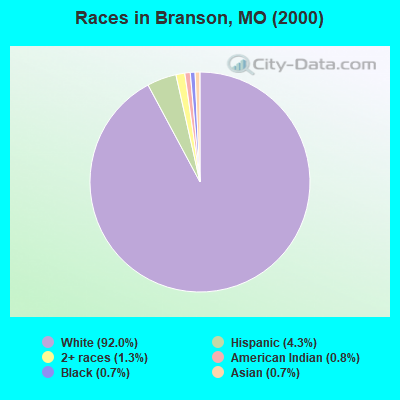
Race distribution in Branson
2000 2022
4,686,474 83.8% White alone 625,667 11.2% Black alone 118,592 2.1% Hispanic 71,905 1.3% Two or more races 61,041 1.1% Asian alone 23,302 0.4% American Indian alone 5,291 0.09% Other race alone 2,939 0.05% Native Hawaiian and Other
4,733,411 76.6% White alone 656,739 10.6% Black alone 316,300 5.1% Two or more races 291,763 4.7% Hispanic 132,436 2.1% Asian alone 27,467 0.4% Other race alone 12,313 0.2% American Indian alone 7,528 0.1% Native Hawaiian and Other
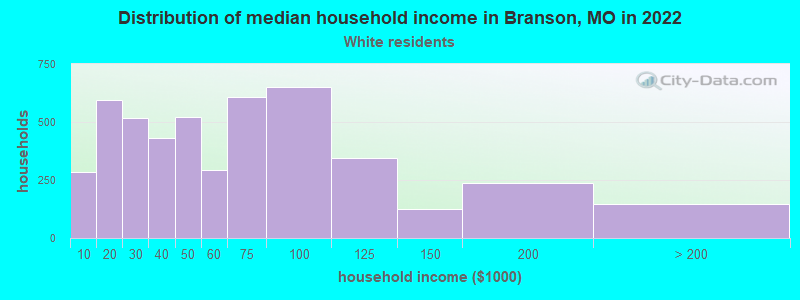
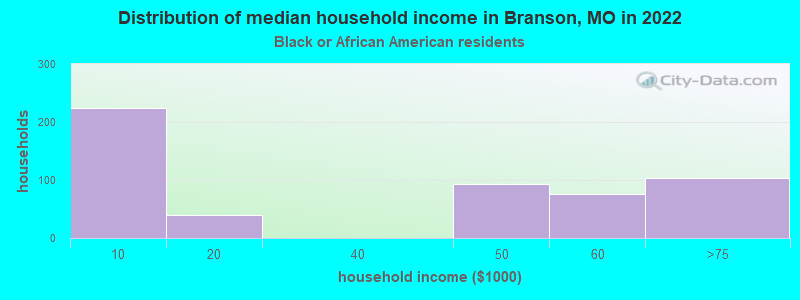
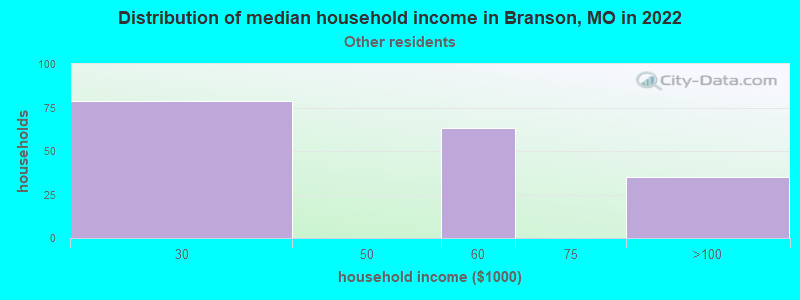
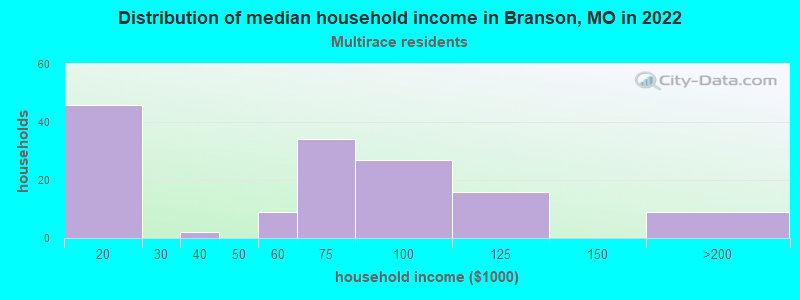
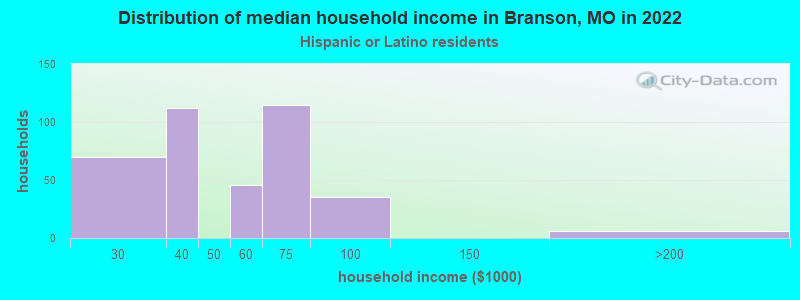
Income and house value in Branson Median household income in 2022 $52,031 White non-Hispanic householders$58,955 Asian householders$58,053 Some other race householders$74,343 Two or more races householders$53,846 Hispanic or Latino race householdersMedian 2022 house value $247,813 White Non-Hispanic householders $225,375 Asian householders$325,542 Hispanic or Latino householders
Median age by race in Branson
42.5 Median age for White residents39.1 46.1 43.7 Median age for Black or African American residents33.5 55.8 17.3 Median age for American Indian / Alaska Native residents17.9 19.5 38.9 Median age for Asian residents35.4 39.1 -693,430,656.2 Median age for Native Hawaiian / Pacific Islander residents-683,513,838.1 -752,136,751.4 35.9 Median age for Other race residents35.9 35.9 30.6 Median age for Two or more races residents34.6 29.0 47.7 Median age for White alone residents39.2 54.5 12.7 Median age for Hispanic or Latino residents31.8 11.0
Owner/renter occupied households by race in Branson
House owners and renters - White residents 2,409 50.7% Owner occupied2,344 49.3% Renter occupiedHouse owners and renters - Black or African American residents 8 1.6% Owner occupied495 98.4% Renter occupiedHouse owners and renters - Asian residents 69 53.1% Owner occupied61 46.9% Renter occupiedHouse owners and renters - Other race residents 21 14.3% Owner occupied126 85.7% Renter occupiedHouse owners and renters - Two or more races residents 43 29.7% Owner occupied102 70.3% Renter occupiedHouse owners and renters - White alone residents 2,419 52.0% Owner occupied2,235 48.0% Renter occupiedHouse owners and renters - Hispanic or Latino residents 7 1.8% Owner occupied360 98.2% Renter occupied
Language usage in Branson
English speakers - Total 91.9% of residents of Branson speak English at home.
2.6% of residents speak Spanish at home 171 56.4% Speak English very well132 43.6% Speak English less than very well5.5% of residents speak other language at home 311 47.8% Speak English very well339 52.2% Speak English less than very well
English speakers - Born in the United States 98.1% of residents of Branson speak English at home.
1.1% of residents speak Spanish at home 43 67.2% Speak English very well21 32.8% Speak English less than very well0.7% of residents speak other language at home 43 100.0% Speak English very well
English speakers - Native, born elsewhere 54.4% of residents of Branson speak English at home.
46.8% of residents speak Spanish at home 7 9.5% Speak English very well67 90.5% Speak English less than very well0.6% of residents speak other language at home 1 100.0% Speak English very well
English speakers - Foreign-born 5.7% of residents of Branson speak English at home.
14.4% of residents speak Spanish at home 89 91.8% Speak English very well8 8.2% Speak English less than very well80.7% of residents speak other language at home 215 39.7% Speak English very well327 60.3% Speak English less than very well
White (Caucasian) - Speak only English Native:
99.3% (9,701)Foreign-born:
8.3% (15)
White (Caucasian) - Speak another language Native:
0.9% (85)Foreign-born:
91.0% (162)
American Indian / Alaska Native - Speak only English Native:
91.2% (22)Foreign-born:
100.0% (7)
Asian - Speak another language Native:
46.8% (51)Foreign-born:
100.0% (258)
Other race - Speak another language Native:
37.6% (61)Foreign-born:
94.9% (87)
Two or more races - Speak only English Native:
68.7% (284)Foreign-born:
26.6% (13)
Two or more races - Speak another language Native:
35.3% (146)Foreign-born:
61.4% (29)
White alone - Speak only English Native:
99.2% (9,351)Foreign-born:
7.1% (15)
White alone - Speak another language Native:
0.8% (75)Foreign-born:
98.3% (207)
Hispanic or Latino - Speak another language Native:
19.0% (159)Foreign-born:
99.4% (29)
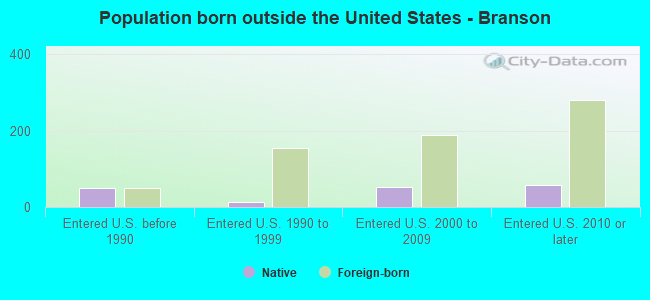
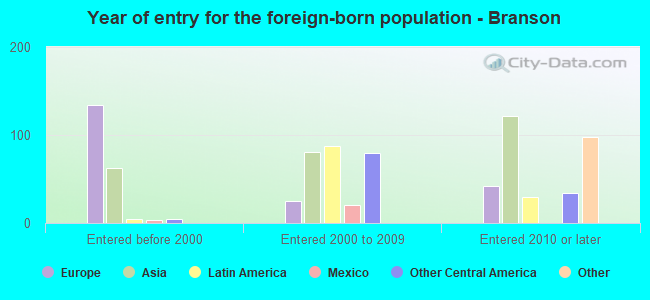
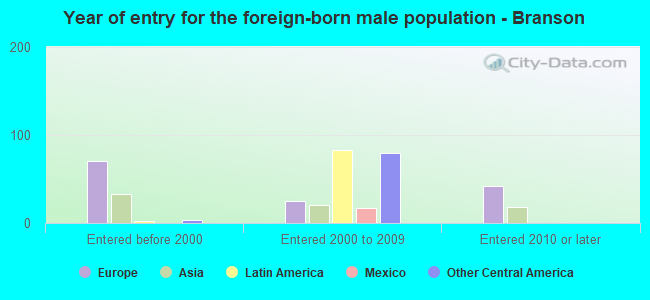
Foreign-born residents in Branson 671 residents are foreign born (2.1% Asia , 1.8% Europe , 1.0% Latin America , 0.6% Africa ).
This city:
5.3%Missouri:
4.2%
Marital status for residents in Branson Marital status - White (Caucasian) population 15 years and over
Males 26.3% Never married57.1% Now married0.8% Separated2.9% Widowed12.9% DivorcedFemales 25.3% Never married44.0% Now married0.0% Separated13.5% Widowed17.2% DivorcedWomen who gave birth in the past 12 months Now married:
90.5% (215)Unmarried:
9.5% (23)
Women who did not give birth in the past 12 months Now married:
38.3% (735)Unmarried:
61.7% (1,186)
Marital status - Black or African American population 15 years and over
Males 45.9% Never married49.8% Now married3.9% Separated0.0% Widowed0.5% DivorcedFemales 0.0% Never married0.0% Now married36.4% Separated9.8% Widowed53.8% DivorcedWomen who did not give birth in the past 12 months Now married:
100.0% (69)Unmarried:
0.0% (0)
Marital status - American Indian / Alaska Native population 15 years and over
Males 87.5% Never married0.0% Now married0.0% Separated0.0% Widowed12.5% DivorcedFemales 100.0% Never married0.0% Now married0.0% Separated0.0% Widowed0.0% DivorcedWomen who did not give birth in the past 12 months Now married:
0.0% (0)Unmarried:
100.0% (15)
Marital status - Asian population 15 years and over
Males 16.2% Never married51.2% Now married0.0% Separated5.0% Widowed27.5% DivorcedFemales 20.3% Never married61.6% Now married0.0% Separated18.1% Widowed0.0% DivorcedWomen who did not give birth in the past 12 months Now married:
72.3% (101)Unmarried:
27.7% (39)
Marital status - Other race population 15 years and over
Males 11.5% Never married88.5% Now married0.0% Separated0.0% Widowed0.0% DivorcedFemales 94.2% Never married0.0% Now married0.0% Separated5.8% Widowed0.0% DivorcedWomen who gave birth in the past 12 months Now married:
0.0% (0)Unmarried:
100.0% (12)
Women who did not give birth in the past 12 months Now married:
0.0% (0)Unmarried:
100.0% (41)
Marital status - Two or more races population 15 years and over
Males 20.6% Never married63.1% Now married0.0% Separated1.4% Widowed14.9% DivorcedFemales 25.2% Never married47.1% Now married0.0% Separated0.0% Widowed27.7% DivorcedWomen who did not give birth in the past 12 months Now married:
62.0% (68)Unmarried:
38.0% (41)
Marital status - White alone, not Hispanic / Latino population 15 years and over
Males 26.3% Never married57.2% Now married0.8% Separated2.9% Widowed12.9% DivorcedFemales 25.7% Never married42.9% Now married0.0% Separated13.8% Widowed17.7% DivorcedWomen who gave birth in the past 12 months Now married:
83.2% (113)Unmarried:
16.8% (23)
Women who did not give birth in the past 12 months Now married:
38.3% (734)Unmarried:
61.7% (1,182)
Marital status - Hispanic or Latino population 15 years and over
Males 7.4% Never married92.6% Now married0.0% Separated0.0% Widowed0.0% DivorcedFemales 27.5% Never married64.0% Now married0.0% Separated1.2% Widowed7.3% DivorcedWomen who gave birth in the past 12 months Now married:
91.4% (116)Unmarried:
8.6% (11)
Women who did not give birth in the past 12 months Now married:
45.9% (49)Unmarried:
54.1% (58)
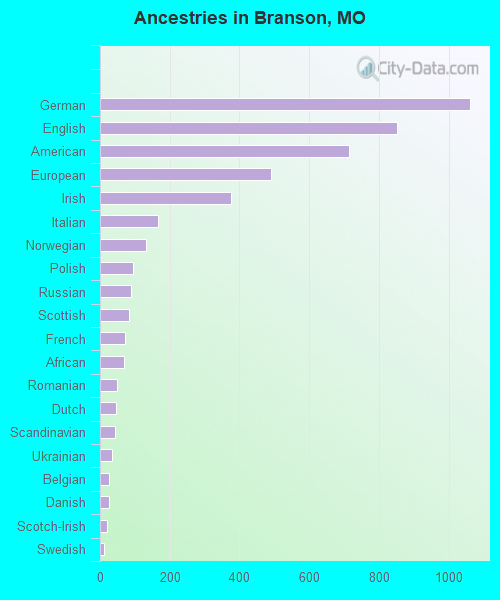
Ancestries in Branson
1,063 18.4% German853 14.8% English715 12.4% American491 8.5% European375 6.5% Irish165 2.9% Italian131 2.3% Norwegian94 1.6% Polish88 1.5% Russian82 1.4% Scottish73 1.3% French68 1.2% African49 0.8% Romanian47 0.8% Dutch42 0.7% Scandinavian34 0.6% Ukrainian26 0.5% Belgian26 0.5% Danish19 0.3% Scotch-Irish12 0.2% Swedish5 0.09% Welsh1 0.02% Iranian
Children Nativity (place of birth) in Branson
Children under 6 years - Living with two parents Both parents native 589 100.0% NativeBoth parents foreign-born 42 100.0% NativeOne native, one foreign-born parent 279 100.0% NativeChildren under 6 years - Living with one parent Native parent 69 100.0% NativeForeign-born parent 23 100.0% NativeChildren 6 to 17 years - Living with two parents Both parents native 637 100.0% NativeBoth parents foreign-born 27 100.0% NativeOne native, one foreign-born parent 207 100.0% NativeChildren 6 to 17 years - Living with one parent Native parent 199 100.0% NativeForeign-born parent 21 51.6% Native20 48.4% Foreign-born