Races in Brentwood, New York (NY) Detailed Stats
Data:
Races - White alone (%)
Races - White alone (% change since 2000)
Races - Black alone (%)
Races - Black alone (% change since 2000)
Races - American Indian alone (%)
Races - American Indian alone (% change since 2000)
Races - Asian alone (%)
Races - Asian alone (% change since 2000)
Races - Hispanic (%)
Races - Hispanic (% change since 2000)
Races - Native Hawaiian and Other Pacific Islander alone (%)
Races - Native Hawaiian and Other Pacific Islander alone (% change since 2000)
Races - Two or more races(%)
Races - Two or more races(% change since 2000)
Races - Other race alone (%)
Races - Other race alone (% change since 2000)
Racial diversity
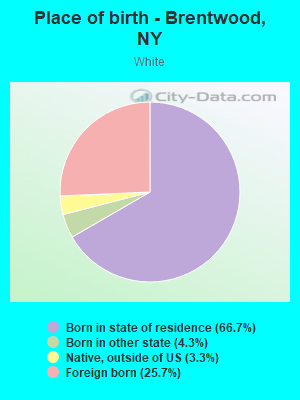
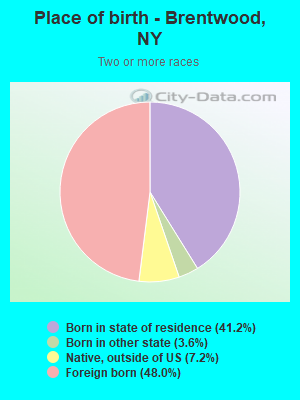
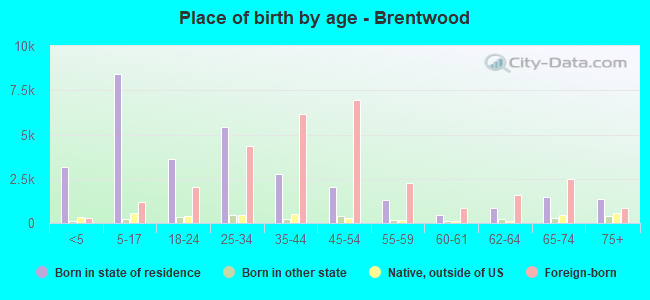
Place of birth - Born in state of residence (%)
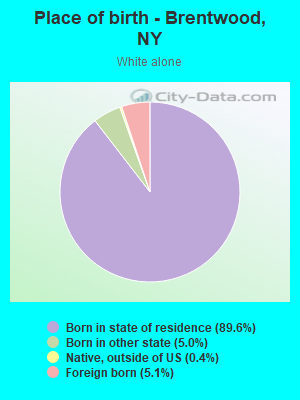
Place of birth - Born in state of residence (%) - White
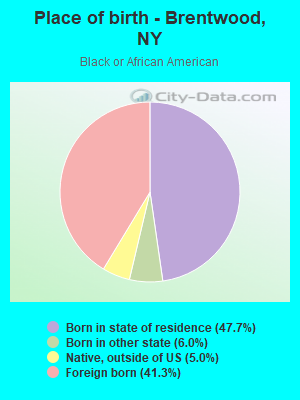
Place of birth - Born in state of residence (%) - Black or African American
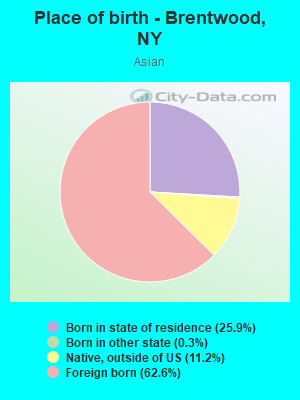
Place of birth - Born in state of residence (%) - Asian
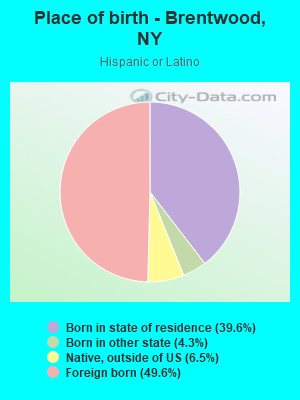
Place of birth - Born in state of residence (%) - Hispanic or Latino
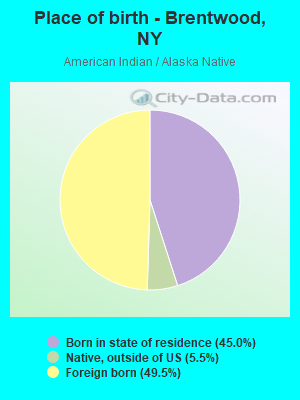
Place of birth - Born in state of residence (%) - American Indian and Alaska Native
Place of birth - Born in state of residence (%) - Multirace
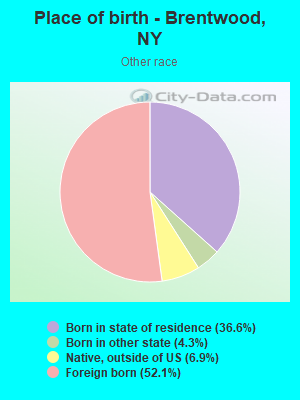
Place of birth - Born in state of residence (%) - Other Race
Place of birth - Born in other state (%)
Place of birth - Born in other state (%) - White
Place of birth - Born in other state (%) - Black or African American
Place of birth - Born in other state (%) - Asian
Place of birth - Born in other state (%) - Hispanic or Latino
Place of birth - Born in other state (%) - American Indian and Alaska Native
Place of birth - Born in other state (%) - Multirace
Place of birth - Born in other state (%) - Other Race
Place of birth - Native, outside of US (%)
Place of birth - Native, outside of US (%) - White
Place of birth - Native, outside of US (%) - Black or African American
Place of birth - Native, outside of US (%) - Asian
Place of birth - Native, outside of US (%) - Hispanic or Latino
Place of birth - Native, outside of US (%) - American Indian and Alaska Native
Place of birth - Native, outside of US (%) - Multirace
Place of birth - Native, outside of US (%) - Other Race
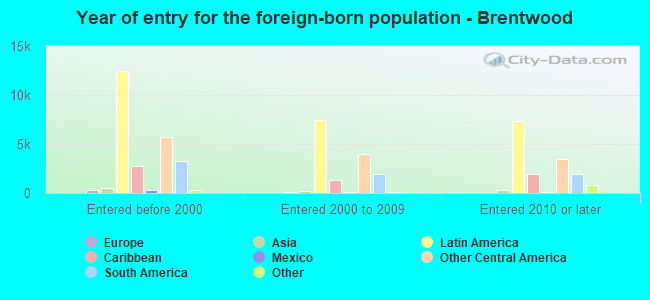
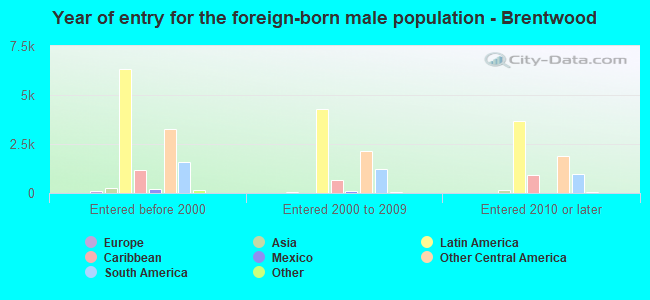
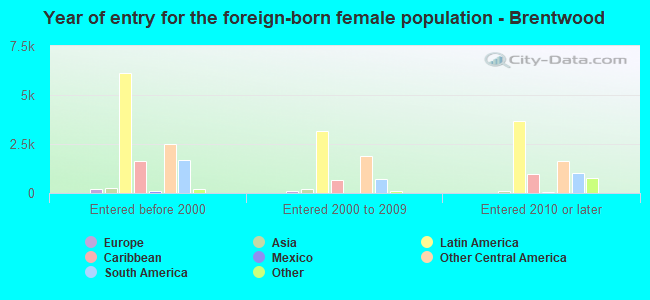
Place of birth - Foreign born (%)
Place of birth - Foreign born (%) - White
Place of birth - Foreign born (%) - Black or African American
Place of birth - Foreign born (%) - Asian
Place of birth - Foreign born (%) - Hispanic or Latino
Place of birth - Foreign born (%) - American Indian and Alaska Native
Place of birth - Foreign born (%) - Multirace
Place of birth - Foreign born (%) - Other Race
Residents speaking English at home (%)
Residents speaking English at home - Born in the United States (%)
Residents speaking English at home - Native, born elsewhere (%)
Residents speaking English at home - Foreign born (%)
Residents speaking Spanish at home (%)
Residents speaking Spanish at home - Born in the United States (%)
Residents speaking Spanish at home - Native, born elsewhere (%)
Residents speaking Spanish at home - Foreign born (%)
Residents speaking other language at home (%)
Residents speaking other language at home - Born in the United States (%)
Residents speaking other language at home - Native, born elsewhere (%)
Residents speaking other language at home - Foreign born (%)
Marital status - Never married (%)
Marital status - Now married (%)
Marital status - Separated (%)
Marital status - Widowed (%)
Marital status - Divorced (%)
Ancestries Reported - Arab (%)
Ancestries Reported - Czech (%)
Ancestries Reported - Danish (%)
Ancestries Reported - Dutch (%)
Ancestries Reported - English (%)
Ancestries Reported - French (%)
Ancestries Reported - French Canadian (%)
Ancestries Reported - German (%)
Ancestries Reported - Greek (%)
Ancestries Reported - Hungarian (%)
Ancestries Reported - Irish (%)
Ancestries Reported - Italian (%)
Ancestries Reported - Lithuanian (%)
Ancestries Reported - Norwegian (%)
Ancestries Reported - Polish (%)
Ancestries Reported - Portuguese (%)
Ancestries Reported - Russian (%)
Ancestries Reported - Scotch-Irish (%)
Ancestries Reported - Scottish (%)
Ancestries Reported - Slovak (%)
Ancestries Reported - Subsaharan African (%)
Ancestries Reported - Swedish (%)
Ancestries Reported - Swiss (%)
Ancestries Reported - Ukrainian (%)
Ancestries Reported - United States (%)
Ancestries Reported - Welsh (%)
Ancestries Reported - West Indian (%)
Ancestries Reported - Other (%)
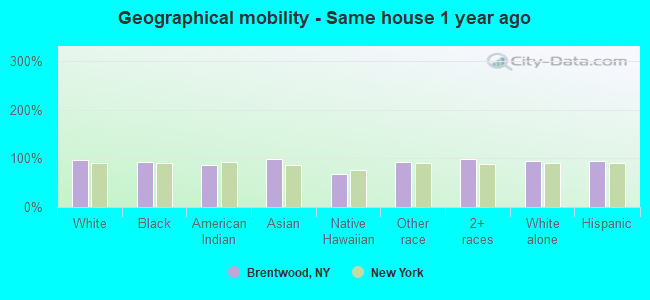
Geographical mobility - Same house 1 year ago (%)
Geographical mobility - Same house 1 year ago (%) - White
Geographical mobility - Same house 1 year ago (%) - Black or African American
Geographical mobility - Same house 1 year ago (%) - Asian
Geographical mobility - Same house 1 year ago (%) - Hispanic or Latino
Geographical mobility - Same house 1 year ago (%) - American Indian and Alaska Native
Geographical mobility - Same house 1 year ago (%) - Multirace
Geographical mobility - Same house 1 year ago (%) - Other Race
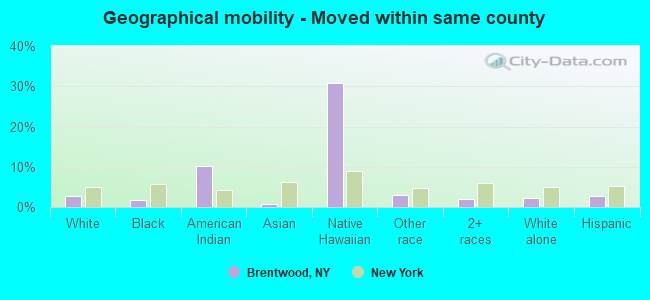
Geographical mobility - Moved within same county (%)
Geographical mobility - Moved within same county (%) - White
Geographical mobility - Moved within same county (%) - Black or African American
Geographical mobility - Moved within same county (%) - Asian
Geographical mobility - Moved within same county (%) - Hispanic or Latino
Geographical mobility - Moved within same county (%) - American Indian and Alaska Native
Geographical mobility - Moved within same county (%) - Multirace
Geographical mobility - Moved within same county (%) - Other Race
Geographical mobility - Moved from different county within same state (%)
Geographical mobility - Moved from different county within same state (%) - White
Geographical mobility - Moved from different county within same state (%) - Black or African American
Geographical mobility - Moved from different county within same state (%) - Asian
Geographical mobility - Moved from different county within same state (%) - Hispanic or Latino
Geographical mobility - Moved from different county within same state (%) - American Indian and Alaska Native
Geographical mobility - Moved from different county within same state (%) - Multirace
Geographical mobility - Moved from different county within same state (%) - Other Race
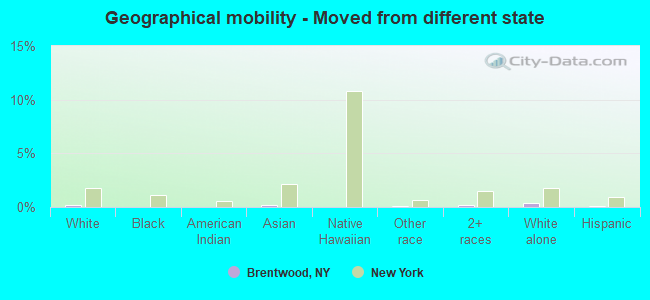
Geographical mobility - Moved from different state (%)
Geographical mobility - Moved from different state (%) - White
Geographical mobility - Moved from different state (%) - Black or African American
Geographical mobility - Moved from different state (%) - Asian
Geographical mobility - Moved from different state (%) - Hispanic or Latino
Geographical mobility - Moved from different state (%) - American Indian and Alaska Native
Geographical mobility - Moved from different state (%) - Multirace
Geographical mobility - Moved from different state (%) - Other Race
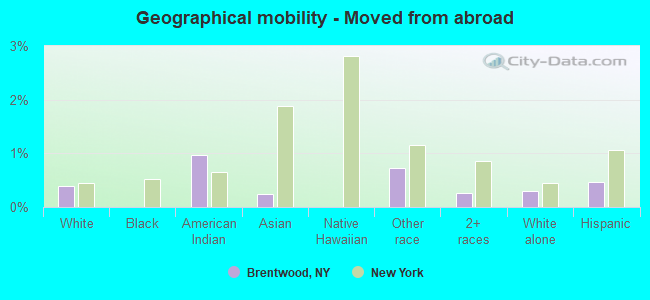
Geographical mobility - Moved from abroad (%)
Geographical mobility - Moved from abroad (%) - White
Geographical mobility - Moved from abroad (%) - Black or African American
Geographical mobility - Moved from abroad (%) - Asian
Geographical mobility - Moved from abroad (%) - Hispanic or Latino
Geographical mobility - Moved from abroad (%) - American Indian and Alaska Native
Geographical mobility - Moved from abroad (%) - Multirace
Geographical mobility - Moved from abroad (%) - Other Race
Place of birth for the foreign-born population - Ireland (%)
Place of birth for the foreign-born population - Denmark (%)
Place of birth for the foreign-born population - Norway (%)
Place of birth for the foreign-born population - Sweden (%)
Place of birth for the foreign-born population - United Kingdom (%)
Place of birth for the foreign-born population - England (%)
Place of birth for the foreign-born population - Scotland (%)
Place of birth for the foreign-born population - Other Northern Europe (%)
Place of birth for the foreign-born population - Austria (%)
Place of birth for the foreign-born population - Belgium (%)
Place of birth for the foreign-born population - France (%)
Place of birth for the foreign-born population - Germany (%)
Place of birth for the foreign-born population - Netherlands (%)
Place of birth for the foreign-born population - Switzerland (%)
Place of birth for the foreign-born population - Other Western Europe (%)
Place of birth for the foreign-born population - Greece (%)
Place of birth for the foreign-born population - Italy (%)
Place of birth for the foreign-born population - Portugal (%)
Place of birth for the foreign-born population - Spain (%)
Place of birth for the foreign-born population - Other Southern Europe (%)
Place of birth for the foreign-born population - Albania (%)
Place of birth for the foreign-born population - Belarus (%)
Place of birth for the foreign-born population - Bosnia and Herzegovina (%)
Place of birth for the foreign-born population - Bulgaria (%)
Place of birth for the foreign-born population - Croatia (%)
Place of birth for the foreign-born population - Czechoslovakia (%)
Place of birth for the foreign-born population - Hungary (%)
Place of birth for the foreign-born population - Latvia (%)
Place of birth for the foreign-born population - Lithuania (%)
Place of birth for the foreign-born population - North Macedonia (Macedonia) (%)
Place of birth for the foreign-born population - Moldova (%)
Place of birth for the foreign-born population - Poland (%)
Place of birth for the foreign-born population - Romania (%)
Place of birth for the foreign-born population - Russia (%)
Place of birth for the foreign-born population - Serbia (%)
Place of birth for the foreign-born population - Ukraine (%)
Place of birth for the foreign-born population - Other Eastern Europe (%)
Place of birth for the foreign-born population - China (%)
Place of birth for the foreign-born population - Hong Kong (%)
Place of birth for the foreign-born population - Taiwan (%)
Place of birth for the foreign-born population - Japan (%)
Place of birth for the foreign-born population - Korea (%)
Place of birth for the foreign-born population - Other Eastern Asia (%)
Place of birth for the foreign-born population - Afghanistan (%)
Place of birth for the foreign-born population - Bangladesh (%)
Place of birth for the foreign-born population - India (%)
Place of birth for the foreign-born population - Iran (%)
Place of birth for the foreign-born population - Kazakhstan (%)
Place of birth for the foreign-born population - Nepal (%)
Place of birth for the foreign-born population - Pakistan (%)
Place of birth for the foreign-born population - Sri Lanka (%)
Place of birth for the foreign-born population - Uzbekistan (%)
Place of birth for the foreign-born population - Other South Central Asia (%)
Place of birth for the foreign-born population - Burma (%)
Place of birth for the foreign-born population - Cambodia (%)
Place of birth for the foreign-born population - Indonesia (%)
Place of birth for the foreign-born population - Laos (%)
Place of birth for the foreign-born population - Malaysia (%)
Place of birth for the foreign-born population - Philippines (%)
Place of birth for the foreign-born population - Singapore (%)
Place of birth for the foreign-born population - Thailand (%)
Place of birth for the foreign-born population - Vietnam (%)
Place of birth for the foreign-born population - Other South Eastern Asia (%)
Place of birth for the foreign-born population - Armenia (%)
Place of birth for the foreign-born population - Iraq (%)
Place of birth for the foreign-born population - Israel (%)
Place of birth for the foreign-born population - Jordan (%)
Place of birth for the foreign-born population - Kuwait (%)
Place of birth for the foreign-born population - Lebanon (%)
Place of birth for the foreign-born population - Saudi Arabia (%)
Place of birth for the foreign-born population - Syria (%)
Place of birth for the foreign-born population - Turkey (%)
Place of birth for the foreign-born population - Yemen (%)
Place of birth for the foreign-born population - Other Western Asia (%)
Place of birth for the foreign-born population - Eritrea (%)
Place of birth for the foreign-born population - Ethiopia (%)
Place of birth for the foreign-born population - Kenya (%)
Place of birth for the foreign-born population - Somalia (%)
Place of birth for the foreign-born population - Uganda (%)
Place of birth for the foreign-born population - Zimbabwe (%)
Place of birth for the foreign-born population - Other Eastern Africa (%)
Place of birth for the foreign-born population - Cameroon (%)
Place of birth for the foreign-born population - Congo (%)
Place of birth for the foreign-born population - Democratic Republic of Congo (Zaire) (%)
Place of birth for the foreign-born population - Other Middle Africa (%)
Place of birth for the foreign-born population - Egypt (%)
Place of birth for the foreign-born population - Morocco (%)
Place of birth for the foreign-born population - Sudan (%)
Place of birth for the foreign-born population - Other Northern Africa (%)
Place of birth for the foreign-born population - South Africa (%)
Place of birth for the foreign-born population - Other Southern Africa (%)
Place of birth for the foreign-born population - Cabo Verde (%)
Place of birth for the foreign-born population - Ghana (%)
Place of birth for the foreign-born population - Liberia (%)
Place of birth for the foreign-born population - Nigeria (%)
Place of birth for the foreign-born population - Senegal (%)
Place of birth for the foreign-born population - Sierra Leone (%)
Place of birth for the foreign-born population - Other Western Africa (%)
Place of birth for the foreign-born population - Australia (%)
Place of birth for the foreign-born population - New Zealand (%)
Place of birth for the foreign-born population - Fiji (%)
Place of birth for the foreign-born population - Micronesia (%)
Place of birth for the foreign-born population - Bahamas (%)
Place of birth for the foreign-born population - Barbados (%)
Place of birth for the foreign-born population - Cuba (%)
Place of birth for the foreign-born population - Dominica (%)
Place of birth for the foreign-born population - Dominican Republic (%)
Place of birth for the foreign-born population - Grenada (%)
Place of birth for the foreign-born population - Haiti (%)
Place of birth for the foreign-born population - Jamaica (%)
Place of birth for the foreign-born population - St. Vincent and the Grenadines (%)
Place of birth for the foreign-born population - Trinidad and Tobago (%)
Place of birth for the foreign-born population - West Indies (%)
Place of birth for the foreign-born population - Other Caribbean (%)
Place of birth for the foreign-born population - Belize (%)
Place of birth for the foreign-born population - Costa Rica (%)
Place of birth for the foreign-born population - El Salvador (%)
Place of birth for the foreign-born population - Guatemala (%)
Place of birth for the foreign-born population - Honduras (%)
Place of birth for the foreign-born population - Mexico (%)
Place of birth for the foreign-born population - Nicaragua (%)
Place of birth for the foreign-born population - Panama (%)
Place of birth for the foreign-born population - Other Central America (%)
Place of birth for the foreign-born population - Argentina (%)
Place of birth for the foreign-born population - Bolivia (%)
Place of birth for the foreign-born population - Brazil (%)
Place of birth for the foreign-born population - Chile (%)
Place of birth for the foreign-born population - Colombia (%)
Place of birth for the foreign-born population - Ecuador (%)
Place of birth for the foreign-born population - Guyana (%)
Place of birth for the foreign-born population - Peru (%)
Place of birth for the foreign-born population - Uruguay (%)
Place of birth for the foreign-born population - Venezuela (%)
Place of birth for the foreign-born population - Other South America (%)
Place of birth for the foreign-born population - Canada (%)
Place of birth for the foreign-born population - Other Northern America (%)
Place of birth for the foreign-born population - Other (%)
Latest news about races in Brentwood, NY collected exclusively by city-data.com from local newspapers, TV, and radio stations
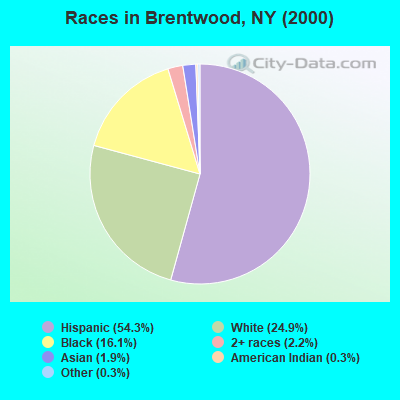
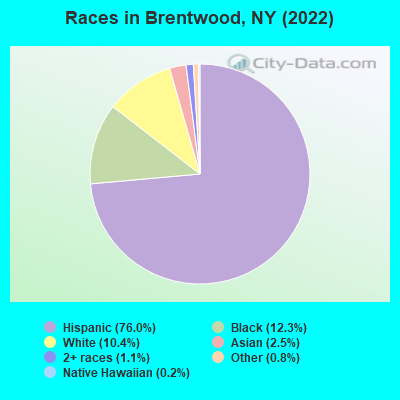
According to 2022 data, the most numerous races in Brentwood, NY are White alone (6,772 residents), Hispanic (49,464 residents), and Black alone (7,989 residents). 30.8% of Brentwood residents speak English at home. 41.2% of Brentwood, NY residents are foreign-born (38.0% born in Latin America), which is 46.5% greater than the foreign-born rate of 22.0% across the entire state of New York.
Race distribution in Brentwood
2000 2022
11,760,981 62.0% White alone 2,867,583 15.1% Hispanic 2,812,623 14.8% Black alone 1,035,926 5.5% Asian alone 366,116 1.9% Two or more races 75,499 0.4% Other race alone 52,499 0.3% American Indian alone 5,230 0.03% Native Hawaiian and Other
10,408,933 52.9% White alone 3,867,299 19.7% Hispanic 2,633,840 13.4% Black alone 1,776,286 9.0% Asian alone 732,670 3.7% Two or more races 216,110 1.1% Other race alone 35,082 0.2% American Indian alone 6,931 0.04% Native Hawaiian and Other
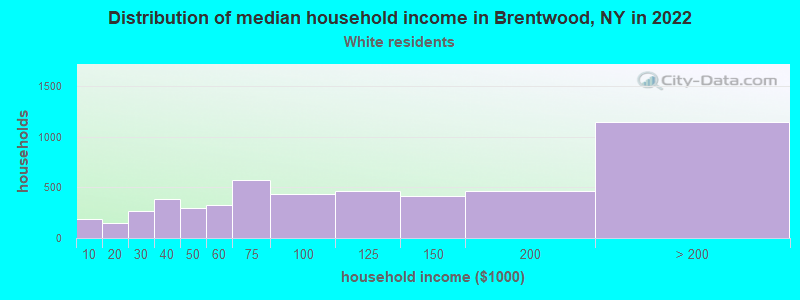
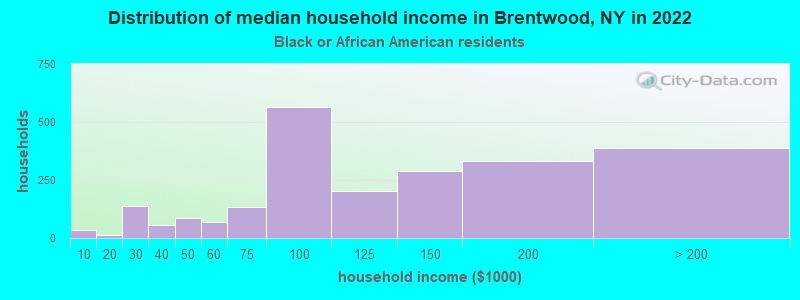
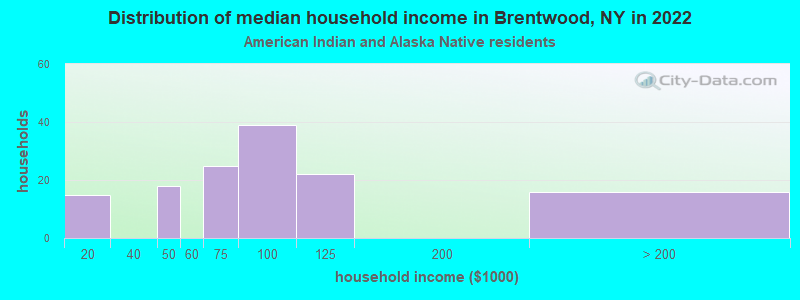
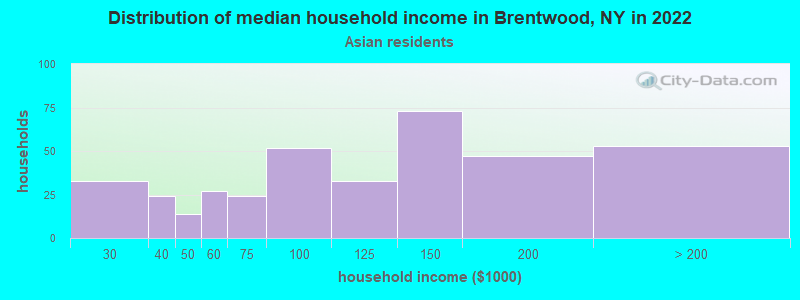
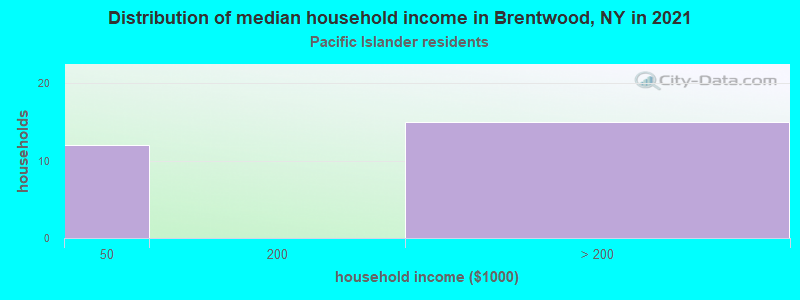
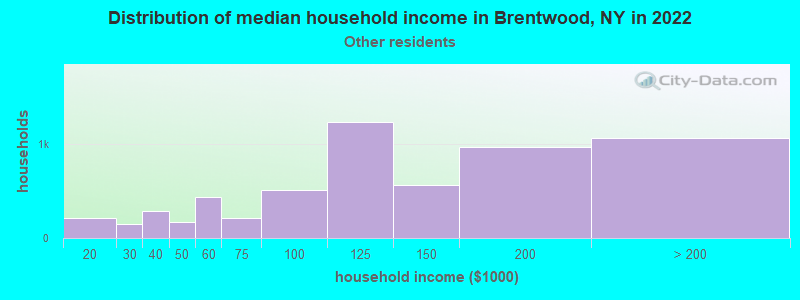
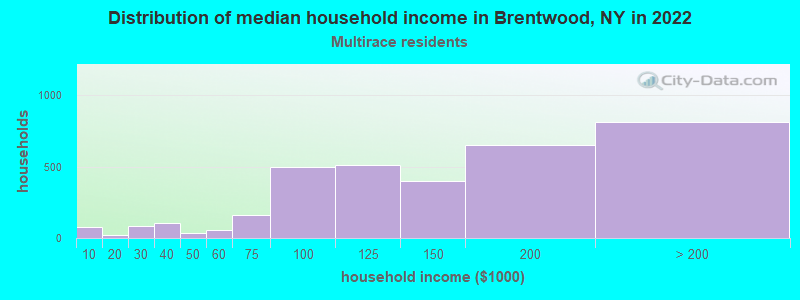
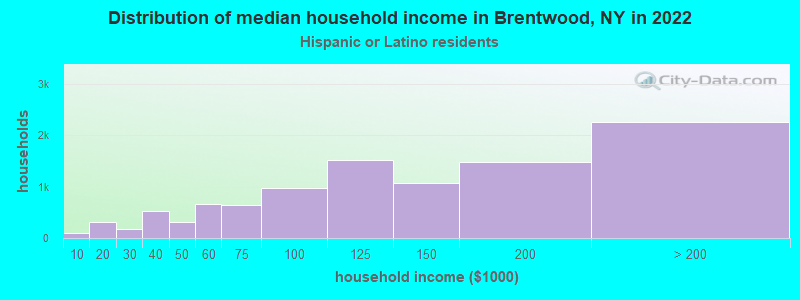
Income and house value in Brentwood Median household income in 2022 $69,924 White non-Hispanic householders$103,299 Black householders$70,402 American Indian and Alaska Native householders$91,517 Asian householders$116,716 Some other race householders$141,354 Two or more races householders$121,945 Hispanic or Latino race householdersMedian 2022 house value $448,929 White Non-Hispanic householders$477,795 Black or African American householders$513,630 American Indian or Alaska Native householders $456,560 Asian householders$461,869 Some other race householders$483,436 Two or more races householders$463,860 Hispanic or Latino householders
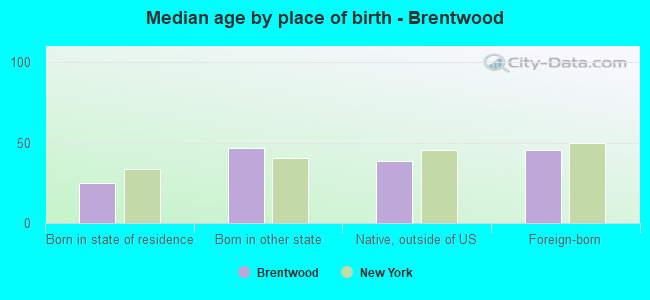
Median age by race in Brentwood
37.7 Median age for White residents37.4 37.6 34.9 Median age for Black or African American residents34.5 34.8 32.9 Median age for American Indian / Alaska Native residents34.4 24.2 37.7 Median age for Asian residents52.5 31.8 40.7 Median age for Native Hawaiian / Pacific Islander residents-831,187,409.8 40.4 36.2 Median age for Other race residents38.1 34.7 38.5 Median age for Two or more races residents35.3 43.0 56.6 Median age for White alone residents57.8 56.2 34.9 Median age for Hispanic or Latino residents36.0 32.8
Owner/renter occupied households by race in Brentwood
House owners and renters - White residents 4,344 85.8% Owner occupied718 14.2% Renter occupiedHouse owners and renters - Black or African American residents 1,638 69.3% Owner occupied726 30.7% Renter occupiedHouse owners and renters - American Indian / Alaska Native residents 105 76.1% Owner occupied33 23.9% Renter occupiedHouse owners and renters - Asian residents 356 87.0% Owner occupied53 13.0% Renter occupiedHouse owners and renters - Native Hawaiian / Pacific Islander residents 23 100.0% Owner occupiedHouse owners and renters - Other race residents 4,487 78.0% Owner occupied1,267 22.0% Renter occupiedHouse owners and renters - Two or more races residents 2,575 77.2% Owner occupied762 22.8% Renter occupiedHouse owners and renters - White alone residents 1,954 90.0% Owner occupied217 10.0% Renter occupiedHouse owners and renters - Hispanic or Latino residents 7,830 78.1% Owner occupied2,196 21.9% Renter occupied
Language usage in Brentwood
English speakers - Total 30.8% of residents of Brentwood speak English at home.
65.8% of residents speak Spanish at home 18,783 46.6% Speak English very well21,495 53.4% Speak English less than very well7.3% of residents speak other language at home 3,015 67.7% Speak English very well1,439 32.3% Speak English less than very well
English speakers - Born in the United States 42.5% of residents of Brentwood speak English at home.
43.7% of residents speak Spanish at home 813 65.0% Speak English very well437 35.0% Speak English less than very well0.3% of residents speak other language at home 9 100.0% Speak English very well
English speakers - Native, born elsewhere 26.6% of residents of Brentwood speak English at home.
63.1% of residents speak Spanish at home 1,364 60.5% Speak English very well890 39.5% Speak English less than very well2.6% of residents speak other language at home 92 100.0% Speak English very well
English speakers - Foreign-born 10.8% of residents of Brentwood speak English at home.
81.8% of residents speak Spanish at home 5,612 23.9% Speak English very well17,887 76.1% Speak English less than very well11.3% of residents speak other language at home 1,913 59.1% Speak English very well1,324 40.9% Speak English less than very well
White (Caucasian) - Speak only English Native:
58.3% (7,709)Foreign-born:
9.2% (453)
White (Caucasian) - Speak another language Native:
32.0% (4,239)Foreign-born:
84.6% (4,176)
Black or African American - Speak only English Native:
71.4% (3,944)Foreign-born:
31.4% (1,388)
Black or African American - Speak another language Native:
34.4% (1,898)Foreign-born:
64.1% (2,835)
American Indian / Alaska Native - Speak another language Native:
100.0% (534)Foreign-born:
100.0% (618)
Asian - Speak only English Native:
34.1% (202)Foreign-born:
16.0% (182)
Asian - Speak another language Native:
68.0% (402)Foreign-born:
81.0% (921)
Other race - Speak only English Native:
22.0% (2,649)Foreign-born:
6.9% (974)
Other race - Speak another language Native:
76.0% (9,146)Foreign-born:
93.2% (13,134)
Two or more races - Speak only English Native:
37.1% (2,558)Foreign-born:
7.0% (462)
Two or more races - Speak another language Native:
61.8% (4,255)Foreign-born:
93.8% (6,230)
White alone - Speak only English Native:
90.2% (5,758)Foreign-born:
42.3% (146)
White alone - Speak another language Native:
10.2% (652)Foreign-born:
57.7% (199)
Hispanic or Latino - Speak only English Native:
26.2% (5,816)Foreign-born:
6.0% (1,467)
Hispanic or Latino - Speak another language Native:
72.4% (16,079)Foreign-born:
94.1% (22,906)
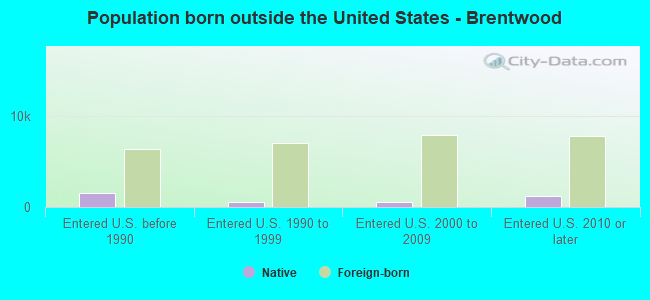
Foreign-born residents in Brentwood 26,787 residents are foreign born (38.0% Latin America ).
This city:
41.2%New York:
22.6%
Marital status for residents in Brentwood Marital status - White (Caucasian) population 15 years and over
Males 46.7% Never married40.6% Now married2.4% Separated2.0% Widowed8.3% DivorcedFemales 39.2% Never married37.3% Now married2.6% Separated11.4% Widowed9.5% DivorcedWomen who gave birth in the past 12 months Now married:
13.9% (32)Unmarried:
86.1% (198)
Women who did not give birth in the past 12 months Now married:
37.4% (1,718)Unmarried:
62.6% (2,870)
Marital status - Black or African American population 15 years and over
Males 55.4% Never married33.9% Now married1.7% Separated1.0% Widowed8.0% DivorcedFemales 46.4% Never married37.3% Now married2.3% Separated4.8% Widowed9.3% DivorcedWomen who gave birth in the past 12 months Now married:
34.0% (85)Unmarried:
66.0% (166)
Women who did not give birth in the past 12 months Now married:
34.3% (982)Unmarried:
65.7% (1,880)
Marital status - American Indian / Alaska Native population 15 years and over
Males 39.8% Never married47.5% Now married0.0% Separated9.7% Widowed3.0% DivorcedFemales 61.2% Never married34.2% Now married0.0% Separated0.0% Widowed4.6% DivorcedWomen who gave birth in the past 12 months Now married:
100.0% (13)Unmarried:
0.0% (0)
Women who did not give birth in the past 12 months Now married:
5.6% (17)Unmarried:
94.4% (289)
Marital status - Asian population 15 years and over
Males 20.8% Never married68.3% Now married0.0% Separated0.0% Widowed10.9% DivorcedFemales 49.7% Never married33.4% Now married1.7% Separated6.1% Widowed9.2% DivorcedWomen who gave birth in the past 12 months Now married:
17.0% (9)Unmarried:
83.0% (46)
Women who did not give birth in the past 12 months Now married:
21.8% (134)Unmarried:
78.2% (482)
Marital status - Native Hawaiian / Pacific Islander population 15 years and over
Males 0.0% Never married46.7% Now married0.0% Separated53.3% Widowed0.0% DivorcedFemales 50.0% Never married30.9% Now married0.0% Separated0.0% Widowed19.1% DivorcedWomen who did not give birth in the past 12 months Now married:
29.2% (15)Unmarried:
70.8% (36)
Marital status - Other race population 15 years and over
Males 43.9% Never married46.7% Now married2.3% Separated0.8% Widowed6.3% DivorcedFemales 45.4% Never married39.1% Now married3.5% Separated6.0% Widowed6.1% DivorcedWomen who gave birth in the past 12 months Now married:
45.8% (158)Unmarried:
54.2% (187)
Women who did not give birth in the past 12 months Now married:
43.1% (2,806)Unmarried:
56.9% (3,706)
Marital status - Two or more races population 15 years and over
Males 53.7% Never married33.2% Now married0.7% Separated3.2% Widowed9.2% DivorcedFemales 40.8% Never married39.7% Now married5.2% Separated5.9% Widowed8.4% DivorcedWomen who gave birth in the past 12 months Now married:
37.9% (37)Unmarried:
62.1% (60)
Women who did not give birth in the past 12 months Now married:
40.5% (1,247)Unmarried:
59.5% (1,831)
Marital status - White alone, not Hispanic / Latino population 15 years and over
Males 48.7% Never married34.4% Now married1.2% Separated5.9% Widowed9.8% DivorcedFemales 40.5% Never married29.5% Now married1.0% Separated19.9% Widowed9.1% DivorcedWomen who gave birth in the past 12 months Now married:
0.0% (0)Unmarried:
100.0% (12)
Women who did not give birth in the past 12 months Now married:
26.2% (374)Unmarried:
73.8% (1,051)
Marital status - Hispanic or Latino population 15 years and over
Males 48.0% Never married42.0% Now married1.9% Separated1.3% Widowed6.8% DivorcedFemales 43.1% Never married40.1% Now married3.8% Separated5.3% Widowed7.7% DivorcedWomen who gave birth in the past 12 months Now married:
22.4% (156)Unmarried:
77.6% (540)
Women who did not give birth in the past 12 months Now married:
41.9% (4,784)Unmarried:
58.1% (6,646)
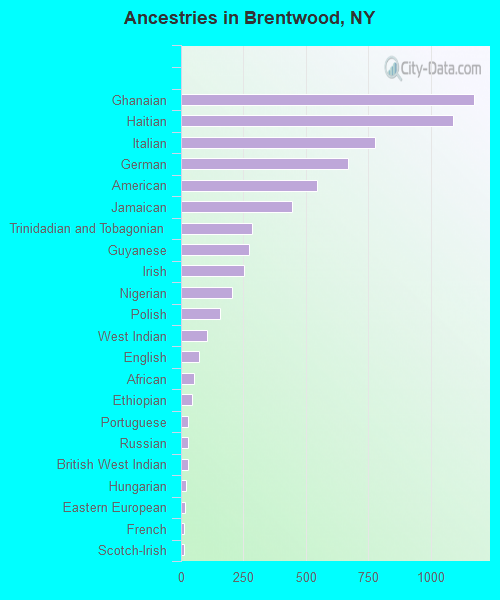
Ancestries in Brentwood
1,174 3.4% Ghanaian1,087 3.1% Haitian777 2.2% Italian668 1.9% German545 1.6% American445 1.3% Jamaican285 0.8% Trinidadian and Tobagonian274 0.8% Guyanese252 0.7% Irish203 0.6% Nigerian155 0.4% Polish104 0.3% West Indian74 0.2% English51 0.1% African45 0.1% Ethiopian30 0.09% Portuguese27 0.08% Russian27 0.08% British West Indian21 0.06% Hungarian16 0.05% Eastern European14 0.04% French14 0.04% Scotch-Irish10 0.03% Croatian10 0.03% Welsh9 0.03% Swiss9 0.03% Ukrainian7 0.02% Greek5 0.01% Norwegian4 0.01% European4 0.01% French Canadian4 0.01% Scottish3 0.01% Czech
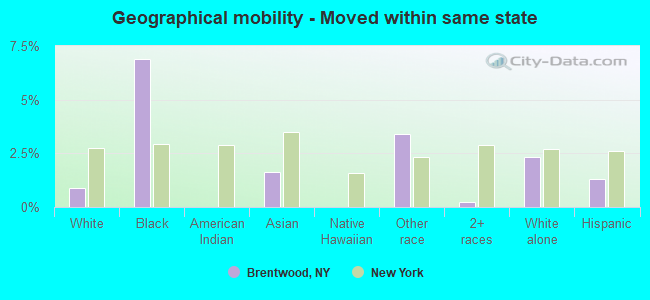
Geographical mobility in Brentwood Same house 1 year ago 19,791 95.8% White (Caucasian)9,557 92.0% Black or African American822 86.2% American Indian / Alaska Native1,723 98.6% Asian56 67.0% Native Hawaiian / Pacific Islander24,761 91.8% Other race13,870 98.0% Two or more races6,424 94.8% White alone, not Hispanic / Latino46,423 95.0% Hispanic or LatinoMoved within same county 570 2.8% White / Caucasian184 1.8% Black or African American97 10.2% American Indian / Alaska Native14 0.8% Asian26 30.9% Native Hawaiian / Pacific Islander798 3.0% Other race286 2.0% Two or more races144 2.1% White alone, not Hispanic / Latino1,395 2.9% Hispanic or LatinoMoved within same state 186 0.9% White / Caucasian717 6.9% Black or African American29 1.7% Asian919 3.4% Other race35 0.3% Two or more races158 2.3% White alone, not Hispanic / Latino639 1.3% Hispanic or LatinoMoved from different state 46 0.2% White / Caucasian2 0.0% Black or African American3 0.2% Asian15 0.1% Other race30 0.2% Two or more races28 0.4% White alone, not Hispanic / Latino24 0.0% Hispanic or LatinoMoved from abroad 82 0.4% White9 1.0% American Indian / Alaska Native4 0.2% Asian198 0.7% Other race37 0.3% Two or more races20 0.3% White alone, not Hispanic / Latino228 0.5% Hispanic or Latino
Children Nativity (place of birth) in Brentwood
Children under 6 years - Living with two parents Both parents native 474 86.4% Native75 13.6% Foreign-bornBoth parents foreign-born 894 89.2% Native108 10.8% Foreign-bornOne native, one foreign-born parent 234 100.0% NativeChildren under 6 years - Living with one parent Native parent 946 97.5% Native24 2.5% Foreign-bornForeign-born parent 1,512 93.9% Native98 6.1% Foreign-bornChildren 6 to 17 years - Living with two parents Both parents native 166 99.4% Native1 0.6% Foreign-bornBoth parents foreign-born 3,150 90.8% Native318 9.2% Foreign-bornOne native, one foreign-born parent 492 100.0% NativeChildren 6 to 17 years - Living with one parent Native parent 706 100.0% NativeForeign-born parent 3,389 57.6% Native2,495 42.4% Foreign-born
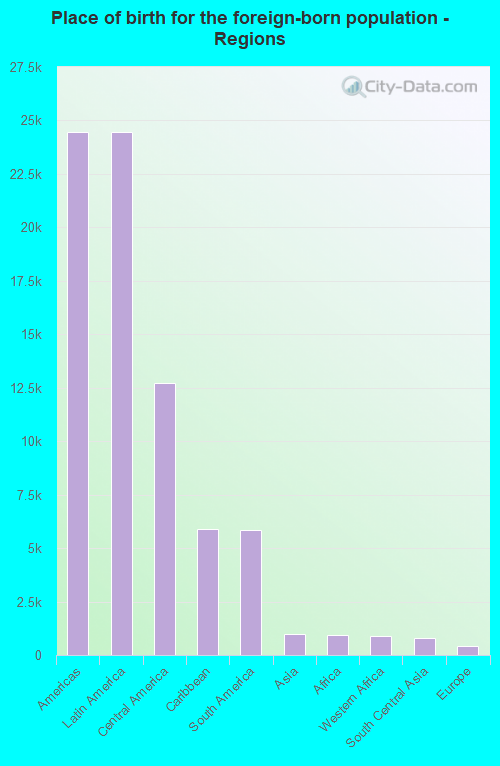
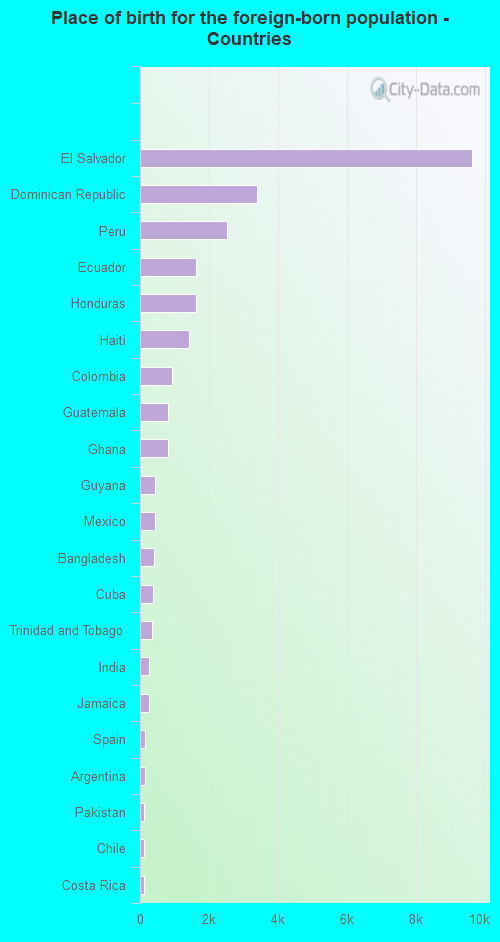
Place of birth for residents in Brentwood 24,459 Americas24,459 Latin America12,740 Central America5,871 Caribbean5,847 South America969 Asia919 Africa870 Western Africa784 South Central Asia439 Europe195 Southern Europe114 South Eastern Asia100 Northern Europe88 Eastern Europe67 Eastern Asia57 China54 Western Europe21 Eastern Africa2 Western Asia9,636 El Salvador3,397 Dominican Republic2,529 Peru1,631 Ecuador1,619 Honduras1,419 Haiti925 Colombia820 Guatemala804 Ghana448 Guyana439 Mexico397 Bangladesh388 Cuba344 Trinidad and Tobago270 India262 Jamaica136 Spain131 Argentina111 Pakistan110 Chile104 Costa Rica79 Nicaragua70 Vietnam66 Nigeria57 China54 Germany46 Ireland44 Poland43 Uruguay42 Portugal41 England40 Panama27 Venezuela23 Philippines21 Ethiopia21 Hungary20 Indonesia18 Grenada16 Italy15 St. Vincent and the Grenadines12 Russia12 United Kingdom9 Korea8 Ukraine4 Nepal2 Israel
Grandparents responsible for own grandchildren in Brentwood
Grandparents (30 to 59 years) White / Caucasian 77 16.8% Responsible for grandchildren379 83.2% Not responsible for grandchildrenBlack or African American 42 33.7% Responsible for grandchildren82 66.3% Not responsible for grandchildrenAmerican Indian / Alaska Native 29 100.0% Not responsible for grandchildrenOther race 111 17.7% Responsible for grandchildren517 82.3% Not responsible for grandchildrenTwo or more races 92 21.8% Responsible for grandchildren329 78.2% Not responsible for grandchildrenWhite alone, not Hispanic / Latino 7 100.0% Not responsible for grandchildrenHispanic or Latino 235 16.3% Responsible for grandchildren1,205 83.7% Not responsible for grandchildrenGrandparents (60 years and over) White / Caucasian 85 19.3% Responsible for grandchildren358 80.7% Not responsible for grandchildrenBlack or African American 76 29.7% Responsible for grandchildren179 70.3% Not responsible for grandchildrenAmerican Indian / Alaska Native 18 100.0% Not responsible for grandchildrenOther race 23 2.1% Responsible for grandchildren1,054 97.9% Not responsible for grandchildrenTwo or more races 144 13.8% Responsible for grandchildren905 86.2% Not responsible for grandchildrenWhite alone, not Hispanic / Latino 23 18.5% Responsible for grandchildren103 81.5% Not responsible for grandchildrenHispanic or Latino 143 7.2% Responsible for grandchildren1,844 92.8% Not responsible for grandchildren