Races in Brentwood, Pennsylvania (PA) Detailed Stats
Data:
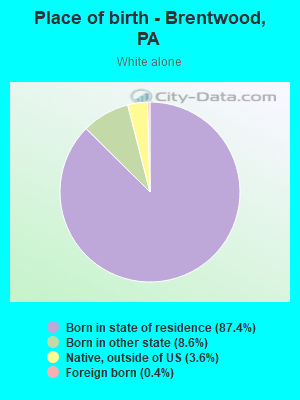
Races - White alone (%)
Races - White alone (% change since 2000)
Races - Black alone (%)
Races - Black alone (% change since 2000)
Races - American Indian alone (%)
Races - American Indian alone (% change since 2000)
Races - Asian alone (%)
Races - Asian alone (% change since 2000)
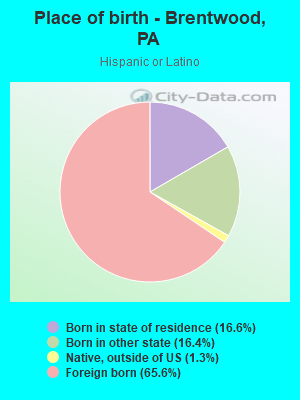
Races - Hispanic (%)
Races - Hispanic (% change since 2000)
Races - Native Hawaiian and Other Pacific Islander alone (%)
Races - Native Hawaiian and Other Pacific Islander alone (% change since 2000)
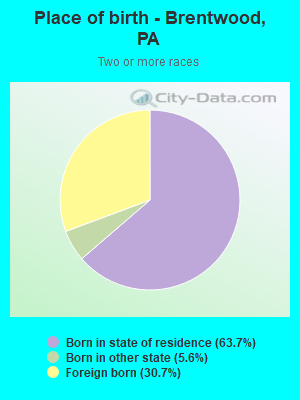
Races - Two or more races(%)
Races - Two or more races(% change since 2000)
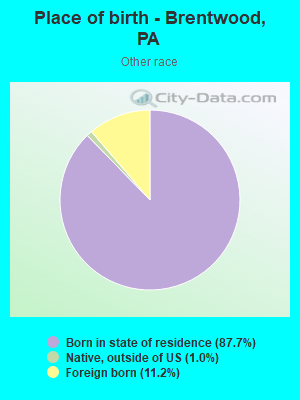
Races - Other race alone (%)
Races - Other race alone (% change since 2000)
Racial diversity
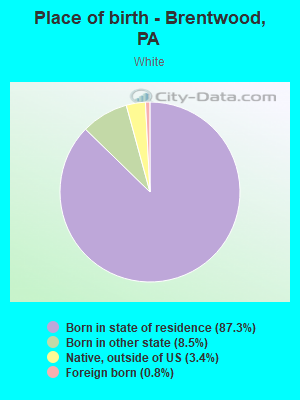
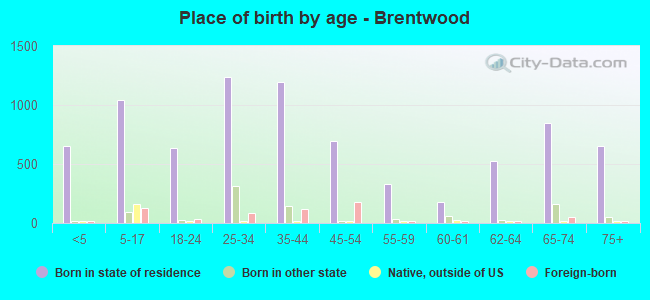
Place of birth - Born in state of residence (%)
Place of birth - Born in state of residence (%) - White
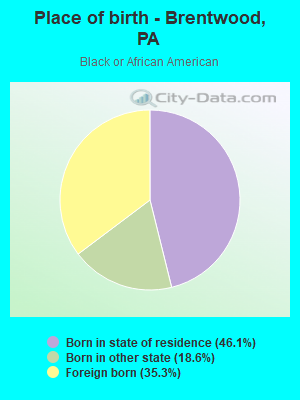
Place of birth - Born in state of residence (%) - Black or African American
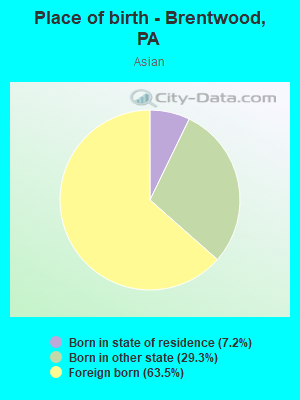
Place of birth - Born in state of residence (%) - Asian
Place of birth - Born in state of residence (%) - Hispanic or Latino
Place of birth - Born in state of residence (%) - American Indian and Alaska Native
Place of birth - Born in state of residence (%) - Multirace
Place of birth - Born in state of residence (%) - Other Race
Place of birth - Born in other state (%)
Place of birth - Born in other state (%) - White
Place of birth - Born in other state (%) - Black or African American
Place of birth - Born in other state (%) - Asian
Place of birth - Born in other state (%) - Hispanic or Latino
Place of birth - Born in other state (%) - American Indian and Alaska Native
Place of birth - Born in other state (%) - Multirace
Place of birth - Born in other state (%) - Other Race
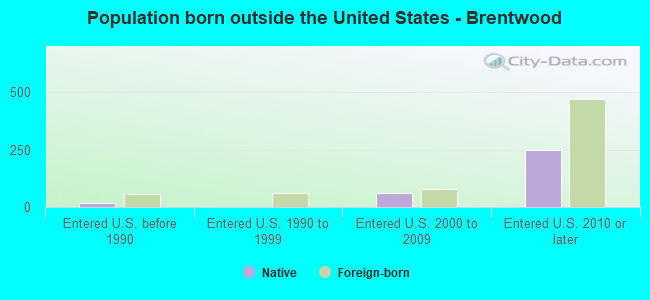
Place of birth - Native, outside of US (%)
Place of birth - Native, outside of US (%) - White
Place of birth - Native, outside of US (%) - Black or African American
Place of birth - Native, outside of US (%) - Asian
Place of birth - Native, outside of US (%) - Hispanic or Latino
Place of birth - Native, outside of US (%) - American Indian and Alaska Native
Place of birth - Native, outside of US (%) - Multirace
Place of birth - Native, outside of US (%) - Other Race
Place of birth - Foreign born (%)
Place of birth - Foreign born (%) - White
Place of birth - Foreign born (%) - Black or African American
Place of birth - Foreign born (%) - Asian
Place of birth - Foreign born (%) - Hispanic or Latino
Place of birth - Foreign born (%) - American Indian and Alaska Native
Place of birth - Foreign born (%) - Multirace
Place of birth - Foreign born (%) - Other Race
Residents speaking English at home (%)
Residents speaking English at home - Born in the United States (%)
Residents speaking English at home - Native, born elsewhere (%)
Residents speaking English at home - Foreign born (%)
Residents speaking Spanish at home (%)
Residents speaking Spanish at home - Born in the United States (%)
Residents speaking Spanish at home - Native, born elsewhere (%)
Residents speaking Spanish at home - Foreign born (%)
Residents speaking other language at home (%)
Residents speaking other language at home - Born in the United States (%)
Residents speaking other language at home - Native, born elsewhere (%)
Residents speaking other language at home - Foreign born (%)
Marital status - Never married (%)
Marital status - Now married (%)
Marital status - Separated (%)
Marital status - Widowed (%)
Marital status - Divorced (%)
Ancestries Reported - Arab (%)
Ancestries Reported - Czech (%)
Ancestries Reported - Danish (%)
Ancestries Reported - Dutch (%)
Ancestries Reported - English (%)
Ancestries Reported - French (%)
Ancestries Reported - French Canadian (%)
Ancestries Reported - German (%)
Ancestries Reported - Greek (%)
Ancestries Reported - Hungarian (%)
Ancestries Reported - Irish (%)
Ancestries Reported - Italian (%)
Ancestries Reported - Lithuanian (%)
Ancestries Reported - Norwegian (%)
Ancestries Reported - Polish (%)
Ancestries Reported - Portuguese (%)
Ancestries Reported - Russian (%)
Ancestries Reported - Scotch-Irish (%)
Ancestries Reported - Scottish (%)
Ancestries Reported - Slovak (%)
Ancestries Reported - Subsaharan African (%)
Ancestries Reported - Swedish (%)
Ancestries Reported - Swiss (%)
Ancestries Reported - Ukrainian (%)
Ancestries Reported - United States (%)
Ancestries Reported - Welsh (%)
Ancestries Reported - West Indian (%)
Ancestries Reported - Other (%)
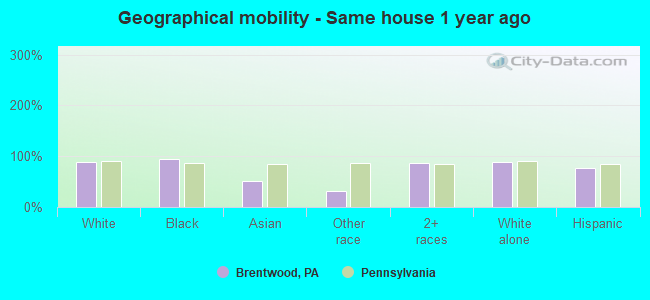
Geographical mobility - Same house 1 year ago (%)
Geographical mobility - Same house 1 year ago (%) - White
Geographical mobility - Same house 1 year ago (%) - Black or African American
Geographical mobility - Same house 1 year ago (%) - Asian
Geographical mobility - Same house 1 year ago (%) - Hispanic or Latino
Geographical mobility - Same house 1 year ago (%) - American Indian and Alaska Native
Geographical mobility - Same house 1 year ago (%) - Multirace
Geographical mobility - Same house 1 year ago (%) - Other Race
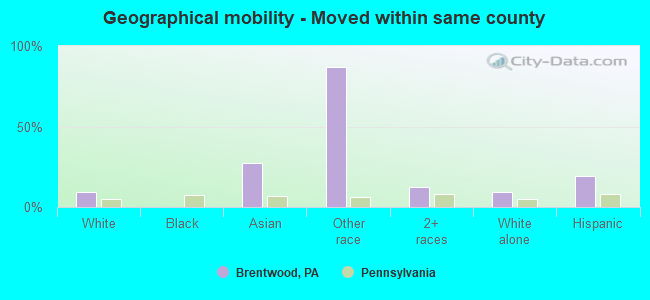
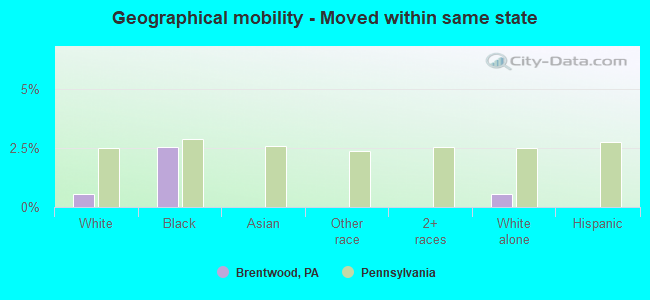
Geographical mobility - Moved within same county (%)
Geographical mobility - Moved within same county (%) - White
Geographical mobility - Moved within same county (%) - Black or African American
Geographical mobility - Moved within same county (%) - Asian
Geographical mobility - Moved within same county (%) - Hispanic or Latino
Geographical mobility - Moved within same county (%) - American Indian and Alaska Native
Geographical mobility - Moved within same county (%) - Multirace
Geographical mobility - Moved within same county (%) - Other Race
Geographical mobility - Moved from different county within same state (%)
Geographical mobility - Moved from different county within same state (%) - White
Geographical mobility - Moved from different county within same state (%) - Black or African American
Geographical mobility - Moved from different county within same state (%) - Asian
Geographical mobility - Moved from different county within same state (%) - Hispanic or Latino
Geographical mobility - Moved from different county within same state (%) - American Indian and Alaska Native
Geographical mobility - Moved from different county within same state (%) - Multirace
Geographical mobility - Moved from different county within same state (%) - Other Race
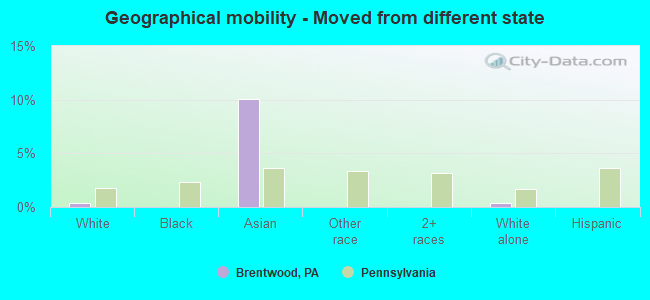
Geographical mobility - Moved from different state (%)
Geographical mobility - Moved from different state (%) - White
Geographical mobility - Moved from different state (%) - Black or African American
Geographical mobility - Moved from different state (%) - Asian
Geographical mobility - Moved from different state (%) - Hispanic or Latino
Geographical mobility - Moved from different state (%) - American Indian and Alaska Native
Geographical mobility - Moved from different state (%) - Multirace
Geographical mobility - Moved from different state (%) - Other Race
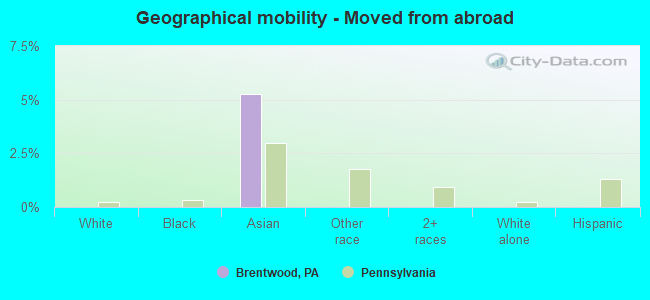
Geographical mobility - Moved from abroad (%)
Geographical mobility - Moved from abroad (%) - White
Geographical mobility - Moved from abroad (%) - Black or African American
Geographical mobility - Moved from abroad (%) - Asian
Geographical mobility - Moved from abroad (%) - Hispanic or Latino
Geographical mobility - Moved from abroad (%) - American Indian and Alaska Native
Geographical mobility - Moved from abroad (%) - Multirace
Geographical mobility - Moved from abroad (%) - Other Race
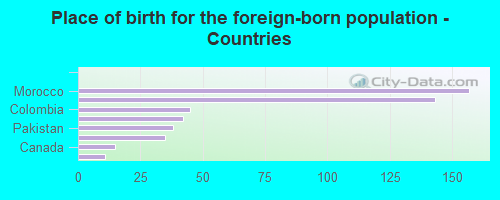
Place of birth for the foreign-born population - Ireland (%)
Place of birth for the foreign-born population - Denmark (%)
Place of birth for the foreign-born population - Norway (%)
Place of birth for the foreign-born population - Sweden (%)
Place of birth for the foreign-born population - United Kingdom (%)
Place of birth for the foreign-born population - England (%)
Place of birth for the foreign-born population - Scotland (%)
Place of birth for the foreign-born population - Other Northern Europe (%)
Place of birth for the foreign-born population - Austria (%)
Place of birth for the foreign-born population - Belgium (%)
Place of birth for the foreign-born population - France (%)
Place of birth for the foreign-born population - Germany (%)
Place of birth for the foreign-born population - Netherlands (%)
Place of birth for the foreign-born population - Switzerland (%)
Place of birth for the foreign-born population - Other Western Europe (%)
Place of birth for the foreign-born population - Greece (%)
Place of birth for the foreign-born population - Italy (%)
Place of birth for the foreign-born population - Portugal (%)
Place of birth for the foreign-born population - Spain (%)
Place of birth for the foreign-born population - Other Southern Europe (%)
Place of birth for the foreign-born population - Albania (%)
Place of birth for the foreign-born population - Belarus (%)
Place of birth for the foreign-born population - Bosnia and Herzegovina (%)
Place of birth for the foreign-born population - Bulgaria (%)
Place of birth for the foreign-born population - Croatia (%)
Place of birth for the foreign-born population - Czechoslovakia (%)
Place of birth for the foreign-born population - Hungary (%)
Place of birth for the foreign-born population - Latvia (%)
Place of birth for the foreign-born population - Lithuania (%)
Place of birth for the foreign-born population - North Macedonia (Macedonia) (%)
Place of birth for the foreign-born population - Moldova (%)
Place of birth for the foreign-born population - Poland (%)
Place of birth for the foreign-born population - Romania (%)
Place of birth for the foreign-born population - Russia (%)
Place of birth for the foreign-born population - Serbia (%)
Place of birth for the foreign-born population - Ukraine (%)
Place of birth for the foreign-born population - Other Eastern Europe (%)
Place of birth for the foreign-born population - China (%)
Place of birth for the foreign-born population - Hong Kong (%)
Place of birth for the foreign-born population - Taiwan (%)
Place of birth for the foreign-born population - Japan (%)
Place of birth for the foreign-born population - Korea (%)
Place of birth for the foreign-born population - Other Eastern Asia (%)
Place of birth for the foreign-born population - Afghanistan (%)
Place of birth for the foreign-born population - Bangladesh (%)
Place of birth for the foreign-born population - India (%)
Place of birth for the foreign-born population - Iran (%)
Place of birth for the foreign-born population - Kazakhstan (%)
Place of birth for the foreign-born population - Nepal (%)
Place of birth for the foreign-born population - Pakistan (%)
Place of birth for the foreign-born population - Sri Lanka (%)
Place of birth for the foreign-born population - Uzbekistan (%)
Place of birth for the foreign-born population - Other South Central Asia (%)
Place of birth for the foreign-born population - Burma (%)
Place of birth for the foreign-born population - Cambodia (%)
Place of birth for the foreign-born population - Indonesia (%)
Place of birth for the foreign-born population - Laos (%)
Place of birth for the foreign-born population - Malaysia (%)
Place of birth for the foreign-born population - Philippines (%)
Place of birth for the foreign-born population - Singapore (%)
Place of birth for the foreign-born population - Thailand (%)
Place of birth for the foreign-born population - Vietnam (%)
Place of birth for the foreign-born population - Other South Eastern Asia (%)
Place of birth for the foreign-born population - Armenia (%)
Place of birth for the foreign-born population - Iraq (%)
Place of birth for the foreign-born population - Israel (%)
Place of birth for the foreign-born population - Jordan (%)
Place of birth for the foreign-born population - Kuwait (%)
Place of birth for the foreign-born population - Lebanon (%)
Place of birth for the foreign-born population - Saudi Arabia (%)
Place of birth for the foreign-born population - Syria (%)
Place of birth for the foreign-born population - Turkey (%)
Place of birth for the foreign-born population - Yemen (%)
Place of birth for the foreign-born population - Other Western Asia (%)
Place of birth for the foreign-born population - Eritrea (%)
Place of birth for the foreign-born population - Ethiopia (%)
Place of birth for the foreign-born population - Kenya (%)
Place of birth for the foreign-born population - Somalia (%)
Place of birth for the foreign-born population - Uganda (%)
Place of birth for the foreign-born population - Zimbabwe (%)
Place of birth for the foreign-born population - Other Eastern Africa (%)
Place of birth for the foreign-born population - Cameroon (%)
Place of birth for the foreign-born population - Congo (%)
Place of birth for the foreign-born population - Democratic Republic of Congo (Zaire) (%)
Place of birth for the foreign-born population - Other Middle Africa (%)
Place of birth for the foreign-born population - Egypt (%)
Place of birth for the foreign-born population - Morocco (%)
Place of birth for the foreign-born population - Sudan (%)
Place of birth for the foreign-born population - Other Northern Africa (%)
Place of birth for the foreign-born population - South Africa (%)
Place of birth for the foreign-born population - Other Southern Africa (%)
Place of birth for the foreign-born population - Cabo Verde (%)
Place of birth for the foreign-born population - Ghana (%)
Place of birth for the foreign-born population - Liberia (%)
Place of birth for the foreign-born population - Nigeria (%)
Place of birth for the foreign-born population - Senegal (%)
Place of birth for the foreign-born population - Sierra Leone (%)
Place of birth for the foreign-born population - Other Western Africa (%)
Place of birth for the foreign-born population - Australia (%)
Place of birth for the foreign-born population - New Zealand (%)
Place of birth for the foreign-born population - Fiji (%)
Place of birth for the foreign-born population - Micronesia (%)
Place of birth for the foreign-born population - Bahamas (%)
Place of birth for the foreign-born population - Barbados (%)
Place of birth for the foreign-born population - Cuba (%)
Place of birth for the foreign-born population - Dominica (%)
Place of birth for the foreign-born population - Dominican Republic (%)
Place of birth for the foreign-born population - Grenada (%)
Place of birth for the foreign-born population - Haiti (%)
Place of birth for the foreign-born population - Jamaica (%)
Place of birth for the foreign-born population - St. Vincent and the Grenadines (%)
Place of birth for the foreign-born population - Trinidad and Tobago (%)
Place of birth for the foreign-born population - West Indies (%)
Place of birth for the foreign-born population - Other Caribbean (%)
Place of birth for the foreign-born population - Belize (%)
Place of birth for the foreign-born population - Costa Rica (%)
Place of birth for the foreign-born population - El Salvador (%)
Place of birth for the foreign-born population - Guatemala (%)
Place of birth for the foreign-born population - Honduras (%)
Place of birth for the foreign-born population - Mexico (%)
Place of birth for the foreign-born population - Nicaragua (%)
Place of birth for the foreign-born population - Panama (%)
Place of birth for the foreign-born population - Other Central America (%)
Place of birth for the foreign-born population - Argentina (%)
Place of birth for the foreign-born population - Bolivia (%)
Place of birth for the foreign-born population - Brazil (%)
Place of birth for the foreign-born population - Chile (%)
Place of birth for the foreign-born population - Colombia (%)
Place of birth for the foreign-born population - Ecuador (%)
Place of birth for the foreign-born population - Guyana (%)
Place of birth for the foreign-born population - Peru (%)
Place of birth for the foreign-born population - Uruguay (%)
Place of birth for the foreign-born population - Venezuela (%)
Place of birth for the foreign-born population - Other South America (%)
Place of birth for the foreign-born population - Canada (%)
Place of birth for the foreign-born population - Other Northern America (%)
Place of birth for the foreign-born population - Other (%)
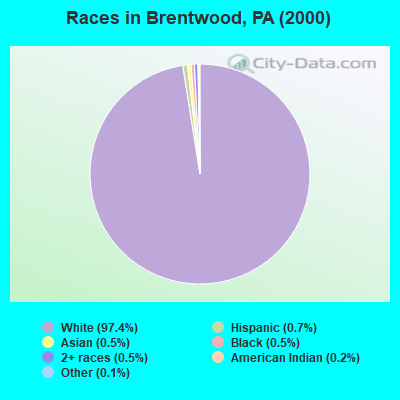
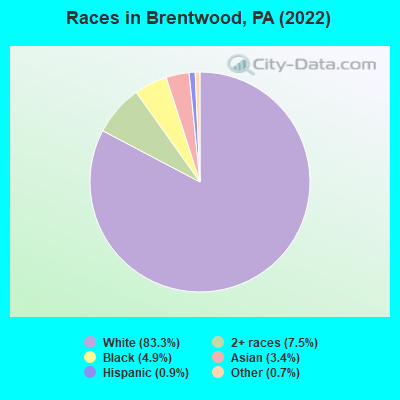
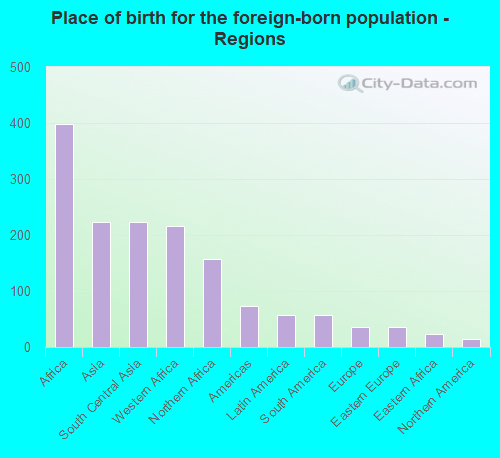
According to 2022 data, the most numerous races in Brentwood, PA are White alone (8,235 residents), Black alone (487 residents), and Hispanic (93 residents). 93.5% of Brentwood residents speak English at home. 7.4% of Brentwood, PA residents are foreign-born (3.8% born in Africa, 2.2% born in Asia), which is 5.5% greater than the foreign-born rate of 7.0% across the entire state of Pennsylvania.
Race distribution in Brentwood
2000 2022
10,322,455 84.1% White alone 1,202,437 9.8% Black alone 394,088 3.2% Hispanic 218,296 1.8% Asian alone 113,097 0.9% Two or more races 13,086 0.1% Other race alone 14,904 0.1% American Indian alone 2,691 0.02% Native Hawaiian and Other
9,487,228 73.1% White alone 1,311,581 10.1% Black alone 1,115,997 8.6% Hispanic 493,942 3.8% Two or more races 487,124 3.8% Asian alone 63,582 0.5% Other race alone 10,130 0.08% American Indian alone 2,424 0.02% Native Hawaiian and Other
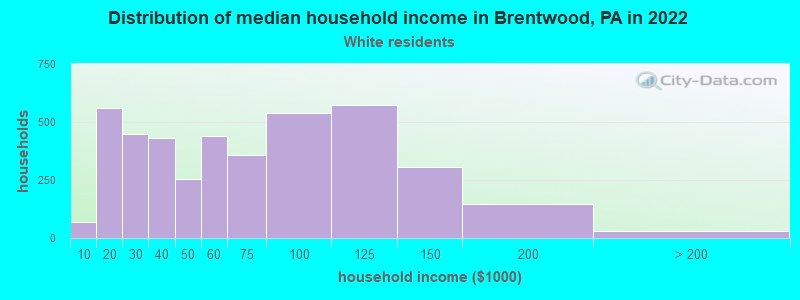
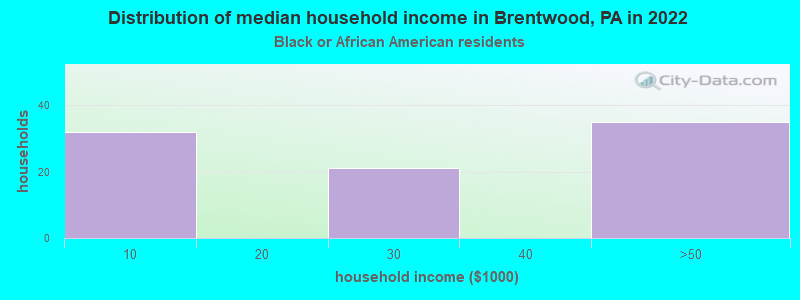
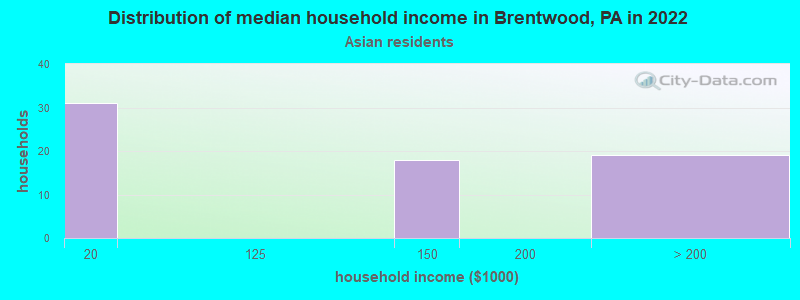
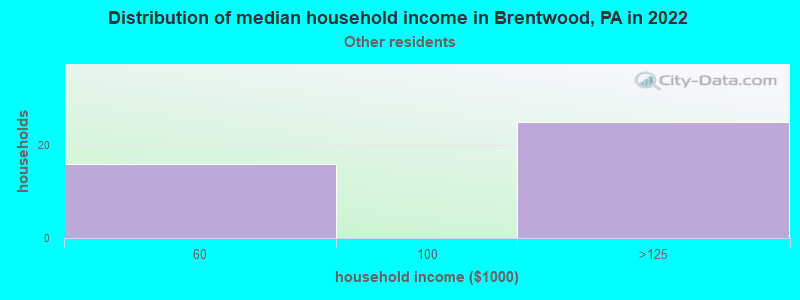
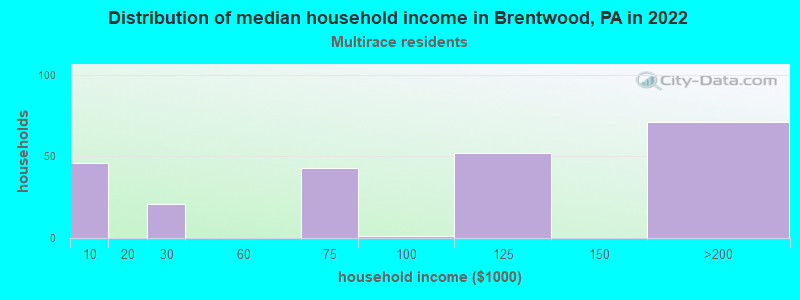
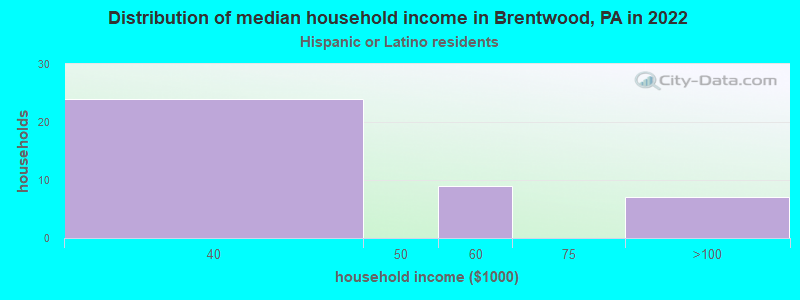
Income and house value in Brentwood Median household income in 2022 $57,282 White non-Hispanic householders$103,814 Two or more races householders$53,405 Hispanic or Latino race householdersMedian 2022 house value $142,294 White Non-Hispanic householders$318,059 Black or African American householders$220,194 Two or more races householders$301,813 Hispanic or Latino householders
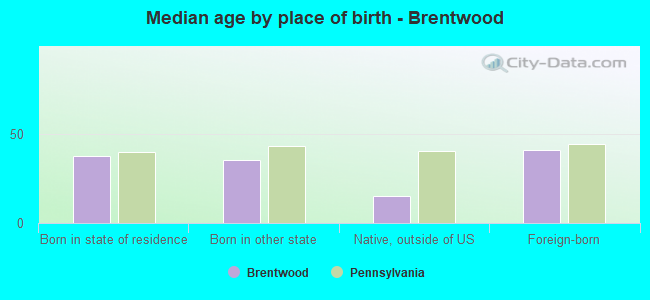
Median age by race in Brentwood
39.2 Median age for White residents39.9 37.5 25.8 Median age for Black or African American residents29.2 17.2 -642,857,142.2 Median age for American Indian / Alaska Native residents-714,583,332.6 -577,519,379.3 38.0 Median age for Asian residents33.9 40.2 -656,534,953.8 Median age for Native Hawaiian / Pacific Islander residents-919,148,935.3 -747,474,746.7 27.8 Median age for Other race residents17.4 30.2 30.2 Median age for Two or more races residents48.3 11.3 39.1 Median age for White alone residents39.7 37.3 47.2 Median age for Hispanic or Latino residents47.0 62.3
Owner/renter occupied households by race in Brentwood
House owners and renters - White residents 2,827 68.0% Owner occupied1,330 32.0% Renter occupiedHouse owners and renters - Black or African American residents 94 100.0% Renter occupiedHouse owners and renters - Asian residents 39 50.0% Owner occupied39 50.0% Renter occupiedHouse owners and renters - Other race residents 13 46.6% Owner occupied15 53.4% Renter occupiedHouse owners and renters - Two or more races residents 47 19.4% Owner occupied194 80.6% Renter occupiedHouse owners and renters - White alone residents 2,821 68.1% Owner occupied1,321 31.9% Renter occupiedHouse owners and renters - Hispanic or Latino residents 23 59.4% Owner occupied16 40.6% Renter occupied
Language usage in Brentwood
English speakers - Total 93.5% of residents of Brentwood speak English at home.
0.6% of residents speak Spanish at home 42 77.8% Speak English very well12 22.2% Speak English less than very well5.9% of residents speak other language at home 223 40.8% Speak English very well324 59.2% Speak English less than very well
English speakers - Born in the United States 95.4% of residents of Brentwood speak English at home.
0.6% of residents speak Spanish at home 5 100.0% Speak English very well3.3% of residents speak other language at home 30 100.0% Speak English very well
English speakers - Native, born elsewhere 84.6% of residents of Brentwood speak English at home.
English speakers - Foreign-born 27.3% of residents of Brentwood speak English at home.
8.0% of residents speak Spanish at home 41 78.8% Speak English very well11 21.2% Speak English less than very well66.3% of residents speak other language at home 148 34.3% Speak English very well284 65.7% Speak English less than very well
White (Caucasian) - Speak another language Native:
0.5% (36)Foreign-born:
97.3% (64)
Black or African American - Speak only English Native:
100.0% (265)Foreign-born:
60.0% (98)
Asian - Speak only English Native:
42.4% (37)Foreign-born:
15.8% (35)
Asian - Speak another language Native:
49.1% (43)Foreign-born:
84.2% (185)
Other race - Speak only English Native:
100.0% (83)Foreign-born:
45.7% (5)
Two or more races - Speak only English Native:
98.0% (366)Foreign-born:
20.3% (49)
White alone - Speak another language Native:
0.5% (38)Foreign-born:
100.0% (31)
Hispanic or Latino - Speak only English Native:
93.8% (32)Foreign-born:
15.1% (10)
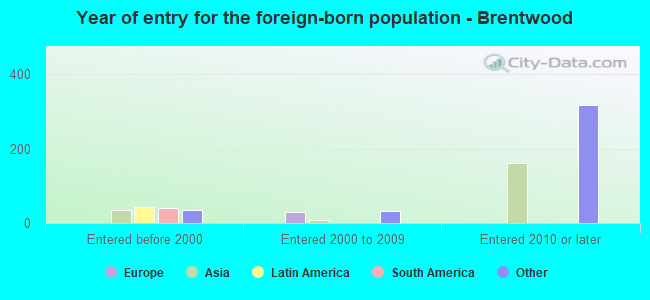
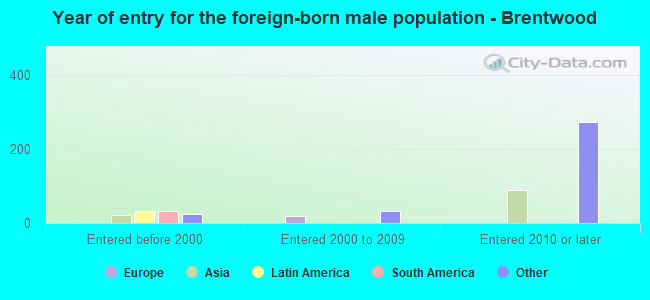
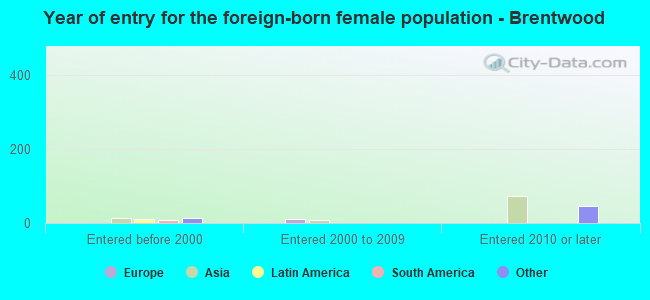
Foreign-born residents in Brentwood 732 residents are foreign born (3.8% Africa , 2.2% Asia ).
This city:
7.4%Pennsylvania:
7.3%
Marital status for residents in Brentwood Marital status - White (Caucasian) population 15 years and over
Males 43.1% Never married41.3% Now married0.7% Separated7.8% Widowed7.1% DivorcedFemales 35.0% Never married36.4% Now married0.8% Separated8.9% Widowed18.9% DivorcedWomen who gave birth in the past 12 months Now married:
47.9% (65)Unmarried:
52.1% (71)
Women who did not give birth in the past 12 months Now married:
39.2% (785)Unmarried:
60.8% (1,217)
Marital status - Black or African American population 15 years and over
Males 100.0% Never married0.0% Now married0.0% Separated0.0% Widowed0.0% DivorcedFemales 68.9% Never married31.1% Now married0.0% Separated0.0% Widowed0.0% DivorcedWomen who did not give birth in the past 12 months Now married:
31.1% (21)Unmarried:
68.9% (46)
Marital status - Asian population 15 years and over
Males 40.4% Never married46.2% Now married0.0% Separated13.5% Widowed0.0% DivorcedFemales 0.0% Never married23.2% Now married0.0% Separated63.4% Widowed13.4% DivorcedWomen who gave birth in the past 12 months Now married:
100.0% (17)Unmarried:
0.0% (0)
Women who did not give birth in the past 12 months Now married:
14.9% (10)Unmarried:
85.1% (60)
Marital status - Other race population 15 years and over
Males 97.0% Never married0.0% Now married0.0% Separated0.0% Widowed3.0% DivorcedFemales 47.4% Never married0.0% Now married0.0% Separated0.0% Widowed52.6% DivorcedWomen who did not give birth in the past 12 months Now married:
0.0% (0)Unmarried:
100.0% (47)
Marital status - Two or more races population 15 years and over
Males 86.0% Never married14.0% Now married0.0% Separated0.0% Widowed0.0% DivorcedFemales 75.0% Never married25.0% Now married0.0% Separated0.0% Widowed0.0% DivorcedWomen who did not give birth in the past 12 months Now married:
25.0% (26)Unmarried:
75.0% (78)
Marital status - White alone, not Hispanic / Latino population 15 years and over
Males 43.5% Never married41.5% Now married0.0% Separated7.9% Widowed7.1% DivorcedFemales 34.8% Never married36.3% Now married0.8% Separated9.0% Widowed19.0% DivorcedWomen who gave birth in the past 12 months Now married:
47.9% (65)Unmarried:
52.1% (71)
Women who did not give birth in the past 12 months Now married:
39.2% (788)Unmarried:
60.8% (1,220)
Marital status - Hispanic or Latino population 15 years and over
Males 25.0% Never married18.2% Now married54.5% Separated0.0% Widowed2.3% DivorcedFemales 31.8% Never married68.2% Now married0.0% Separated0.0% Widowed0.0% DivorcedWomen who did not give birth in the past 12 months Now married:
100.0% (19)Unmarried:
0.0% (0)
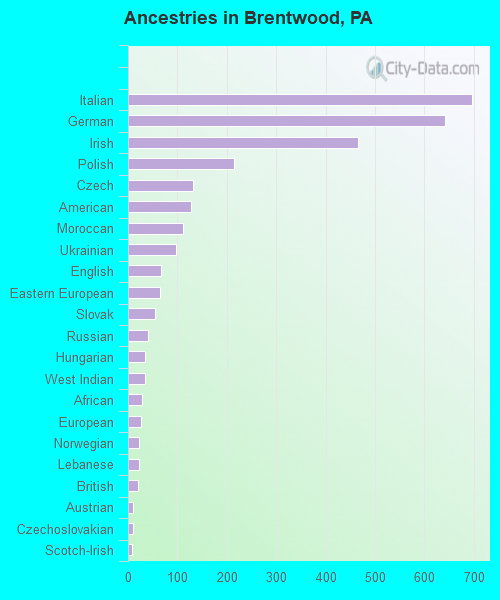
Ancestries in Brentwood
696 20.1% Italian641 18.5% German465 13.4% Irish214 6.2% Polish132 3.8% Czech127 3.7% American111 3.2% Moroccan97 2.8% Ukrainian67 1.9% English65 1.9% Eastern European54 1.6% Slovak40 1.2% Russian35 1.0% Hungarian34 1.0% West Indian28 0.8% African27 0.8% European23 0.7% Norwegian22 0.6% Lebanese21 0.6% British10 0.3% Austrian10 0.3% Czechoslovakian8 0.2% Scotch-Irish6 0.2% Syrian
Children Nativity (place of birth) in Brentwood
Children under 6 years - Living with two parents Both parents native 385 100.0% NativeBoth parents foreign-born 26 100.0% NativeChildren under 6 years - Living with one parent Native parent 361 100.0% NativeChildren 6 to 17 years - Living with two parents Both parents native 511 99.6% Native2 0.4% Foreign-bornBoth parents foreign-born 32 28.0% Native82 72.0% Foreign-bornChildren 6 to 17 years - Living with one parent Native parent 692 92.3% Native58 7.7% Foreign-bornForeign-born parent 39 100.0% Native
Grandparents responsible for own grandchildren in Brentwood
Grandparents (30 to 59 years) White / Caucasian 18 100.0% Not responsible for grandchildrenWhite alone, not Hispanic / Latino 18 100.0% Not responsible for grandchildren
Grandparents (60 years and over) White / Caucasian 13 100.0% Not responsible for grandchildrenWhite alone, not Hispanic / Latino 14 100.0% Not responsible for grandchildren