Races in Bridgewater, Maine (ME) Detailed Stats
Ancestries, Foreign-born residents, place of birth

Recent posts about races in Bridgewater, Maine on our local forum with over 2,400,000 registered users:
 | Municipal Solid Waste: incinerators, landfills, out-of-state waste for profit, PERC, MRC (17 replies) |
| Maine or NH for relocation? (46 replies) |
| Aroostook County questions (46 replies) |
| Lupc (3 replies) |
6.5% of Bridgewater, ME residents are foreign-born (6.5% born in North America), which is 54.1% greater than the foreign-born rate of 3.0% across the entire state of Maine.
Race distribution in Bridgewater

- 60098.0%White alone
- 50.8%Two or more races
- 40.7%Hispanic
- 30.5%American Indian alone

2000
2022
-
- 1,230,29796.5%White alone
- 11,7310.9%Two or more races
- 9,3600.7%Hispanic
- 9,0140.7%Asian alone
- 6,4400.5%Black alone
- 6,9110.5%American Indian alone
- 8360.07%Other race alone
- 3340.03%Native Hawaiian and Other
Pacific Islander alone

-
- 1,249,23390.2%White alone
- 58,3574.2%Two or more races
- 28,7172.1%Hispanic
- 21,5831.6%Black alone
- 16,1511.2%Asian alone
- 5,8730.4%Other race alone
- 5,2050.4%American Indian alone
- 2210.02%Native Hawaiian and Other
Pacific Islander alone

Income and house value in Bridgewater
- Median household income in 2022
- $50,061White non-Hispanic householders
- $82,631American Indian and Alaska Native householders
- Median 2022 house value
- $113,797White Non-Hispanic householders
- $54,477American Indian or Alaska Native householders
Household income for White non-Hispanic householders

Household income for American Indian and Alaska Native householders

Foreign-born residents in Bridgewater
40 residents are foreign born (6.5% North America).
| This city: | 6.5% |
| Maine: | 2.9% |
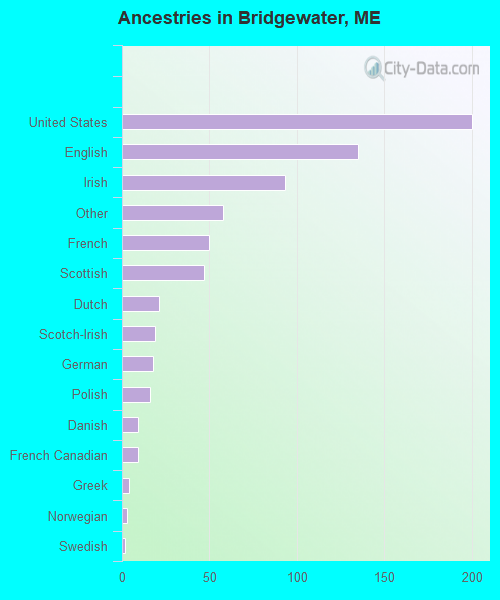
Ancestries in Bridgewater

- 20029.2%United States
- 13519.7%English
- 9313.6%Irish
- 588.5%Other
- 507.3%French
- 476.9%Scottish
- 213.1%Dutch
- 192.8%Scotch-Irish
- 182.6%German
- 162.3%Polish
- 91.3%Danish
- 91.3%French Canadian
- 40.6%Greek
- 30.4%Norwegian
- 20.3%Swedish
- 10.1%Russian
Zip codes: 04735.