Races in Brier, Washington (WA) Detailed Stats
Ancestries, Foreign-born residents, place of birth
Settings
X


Recent posts about races in Brier, Washington on our local forum with over 2,400,000 registered users:
 | Would you buy a house that is 500 ft from high power transmission lines? (16 replies) |
| Horse property close to town? (7 replies) |
| Mountlake Terrace schools (2 replies) |
| living on camano island (27 replies) |
| Do you ever reminisce about Seattle back before it became crap? (33 replies) |
| Why are new homes so close together? (50 replies) |
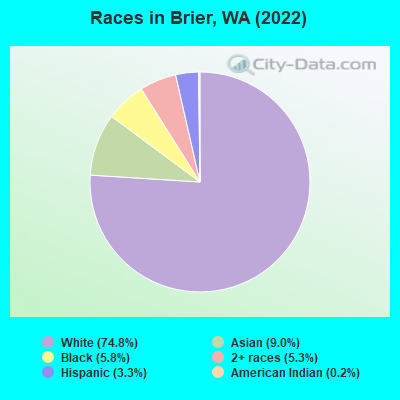
According to 2022 data, the most numerous races in Brier, WA are White alone (4,959 residents), Hispanic (222 residents), and Asian alone (594 residents). 81.2% of Brier residents speak English at home. 10.9% of Brier, WA residents are foreign-born (5.6% born in Asia, 2.1% born in Europe, 2.1% born in Africa), which is 38.0% less than the foreign-born rate of 15.0% across the entire state of Washington.
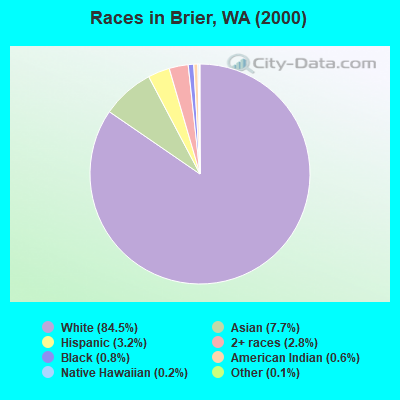
Race distribution in Brier
2000
2022

- 5,39684.5%White alone
- 4907.7%Asian alone
- 2063.2%Hispanic
- 1792.8%Two or more races
- 530.8%Black alone
- 400.6%American Indian alone
- 100.2%Native Hawaiian and Other
Pacific Islander alone - 90.1%Other race alone
-
- 4,95974.8%White alone
- 5949.0%Asian alone
- 3855.8%Black alone
- 3505.3%Two or more races
- 2223.3%Hispanic
- 140.2%American Indian alone
2000
2022
-
- 4,652,49078.9%White alone
- 441,5097.5%Hispanic
- 319,4015.4%Asian alone
- 184,6313.1%Black alone
- 175,9263.0%Two or more races
- 85,3961.4%American Indian alone
- 22,7790.4%Native Hawaiian and Other
Pacific Islander alone - 11,9890.2%Other race alone

-
- 4,941,45663.5%White alone
- 1,093,31314.0%Hispanic
- 755,8329.7%Asian alone
- 523,4486.7%Two or more races
- 299,5373.8%Black alone
- 69,0240.9%American Indian alone
- 52,2310.7%Native Hawaiian and Other
Pacific Islander alone - 50,9450.7%Other race alone

Income and house value in Brier
- Median household income in 2022
- $139,063White non-Hispanic householders
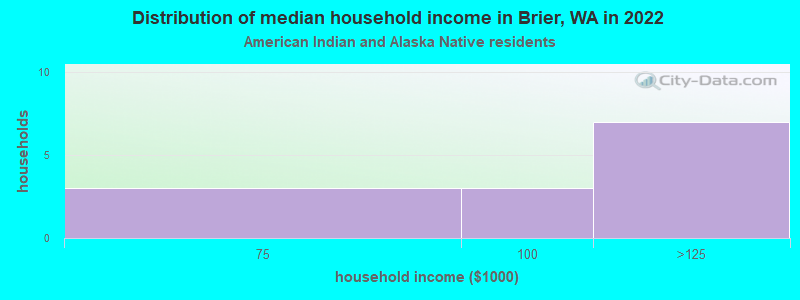
- $135,760American Indian and Alaska Native householders
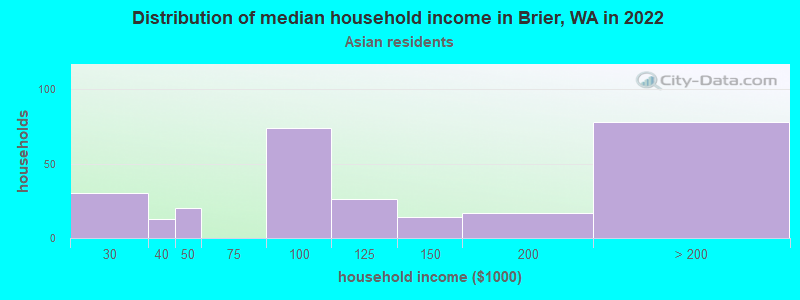
- $114,371Asian householders
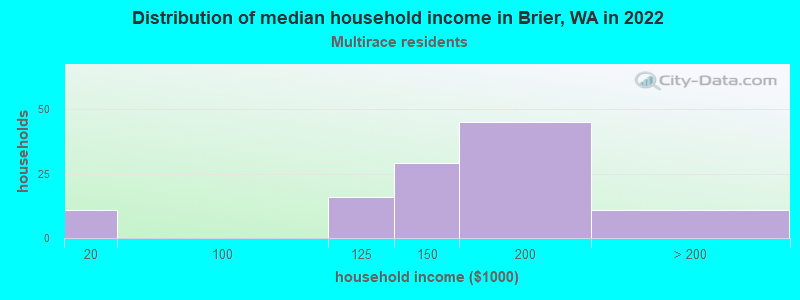
- $158,240Two or more races householders
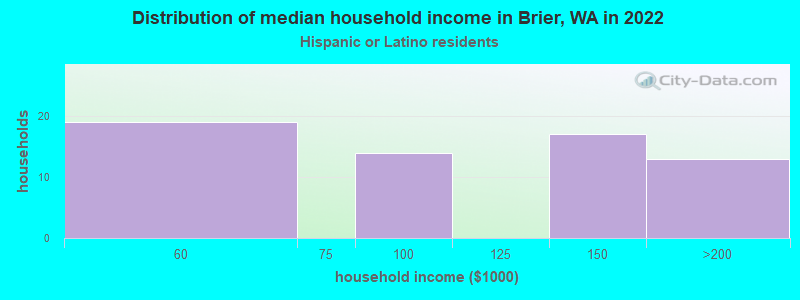
- $100,859Hispanic or Latino race householders
- Median 2022 house value
- $959,759White Non-Hispanic householders
- over $1,000,000Black or African American householders
- $919,871Asian householders
- $925,217Native Hawaiian and other Pacific Islander householders
- over $1,000,000Two or more races householders
- $692,473Hispanic or Latino householders
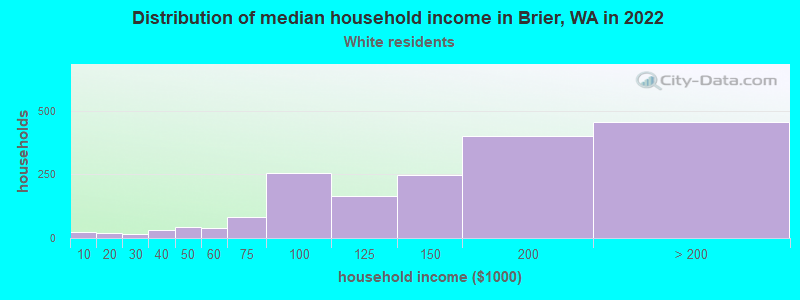
Household income for White non-Hispanic householders
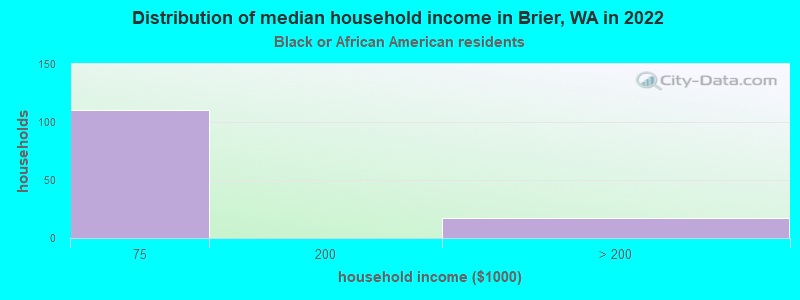
Household income for Black householders
Household income for American Indian and Alaska Native householders
Household income for Asian householders
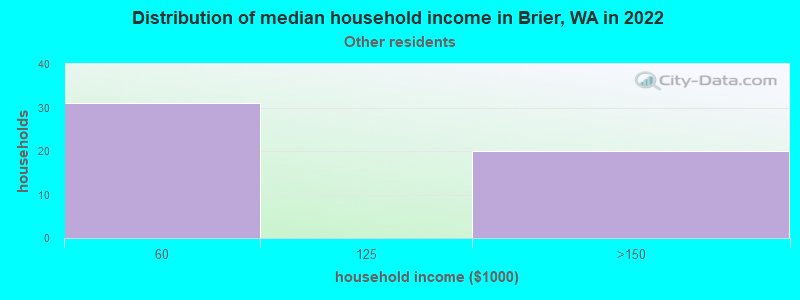
Household income for Some other race householders
Household income for Two or more races householders
Household income for Hispanic or Latino race householders
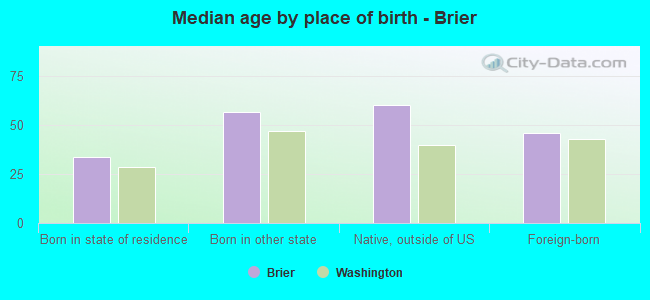
Median age by race in Brier
- 49.4Median age for White residents
- 48.8Males
- 50.4Females
- 19.2Median age for Black or African American residents
- 9.0Males
- 47.0Females
- 27.8Median age for American Indian / Alaska Native residents
- -736,637,511.4Males
- 25.0Females
- 46.3Median age for Asian residents
- 44.3Males
- 49.7Females
- -677,839,850.3Median age for Native Hawaiian / Pacific Islander residents
- -661,202,185.1Males
- -844,317,095.6Females
- 37.6Median age for Other race residents
- 40.2Males
- -680,851,063.1Females
- 20.8Median age for Two or more races residents
- 20.7Males
- 21.3Females
- 50.0Median age for White alone residents
- 49.0Males
- 50.1Females
- 35.6Median age for Hispanic or Latino residents
- 37.9Males
- 7.4Females
Owner/renter occupied households by race in Brier
- House owners and renters - White residents
- 1,64893.0%Owner occupied
- 1237.0%Renter occupied
- House owners and renters - Black or African American residents
- 132100.0%Owner occupied
- House owners and renters - American Indian / Alaska Native residents
- 10100.0%Renter occupied
- House owners and renters - Asian residents
- 23190.3%Owner occupied
- 259.7%Renter occupied
- House owners and renters - Other race residents
- 1332.8%Owner occupied
- 2667.2%Renter occupied
- House owners and renters - Two or more races residents
- 9192.4%Owner occupied
- 77.6%Renter occupied
- House owners and renters - White alone residents
- 1,64092.9%Owner occupied
- 1257.1%Renter occupied
- House owners and renters - Hispanic or Latino residents
- 3964.9%Owner occupied
- 2135.1%Renter occupied
Language usage in Brier
- English speakers - Total
- 81.2% of residents of Brier speak English at home.
- 3.6% of residents speak Spanish at home
- 17276.8%Speak English very well
- 5223.2%Speak English less than very well
- 15.2% of residents speak other language at home
- 76880.8%Speak English very well
- 18219.2%Speak English less than very well
- English speakers - Born in the United States
- 93.6% of residents of Brier speak English at home.
- 4.4% of residents speak Spanish at home
- 81100.0%Speak English very well
- 1.9% of residents speak other language at home
- 36100.0%Speak English very well
All residents speak only English at home
- English speakers - Foreign-born
- 20.2% of residents of Brier speak English at home.
- 6.6% of residents speak Spanish at home
- 48100.0%Speak English less than very well
- 74.0% of residents speak other language at home
- 37469.5%Speak English very well
- 16430.5%Speak English less than very well
White (Caucasian) - Speak only English
| Native: | 93.6% (4,366) |
| Foreign-born: | 35.1% (41) |
White (Caucasian) - Speak another language
| Native: | 5.8% (272) |
| Foreign-born: | 65.2% (76) |
Black or African American - Speak only English
| Native: | 18.2% (43) |
| Foreign-born: | 1.4% (2) |
Black or African American - Speak another language
| Native: | 69.2% (165) |
| Foreign-born: | 81.7% (116) |
American Indian / Alaska Native - Speak only English
| Native: | 75.0% (10) |
| Foreign-born: | 67.1% (6) |
Asian - Speak only English
| Native: | 64.8% (96) |
| Foreign-born: | 21.4% (85) |
Asian - Speak another language
| Native: | 35.0% (52) |
| Foreign-born: | 79.8% (318) |
Two or more races - Speak only English
| Native: | 98.9% (294) |
| Foreign-born: | 48.7% (5) |
Two or more races - Speak another language
| Native: | 2.2% (6) |
| Foreign-born: | 57.6% (6) |
White alone - Speak only English
| Native: | 93.0% (4,313) |
| Foreign-born: | 33.4% (41) |
White alone - Speak another language
| Native: | 6.9% (319) |
| Foreign-born: | 66.2% (82) |
Hispanic or Latino - Speak another language
| Native: | 6.8% (8) |
| Foreign-born: | 99.2% (50) |
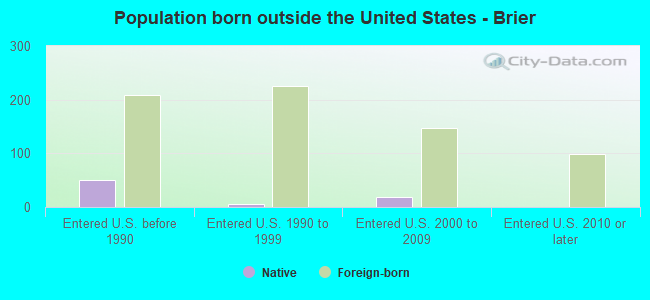
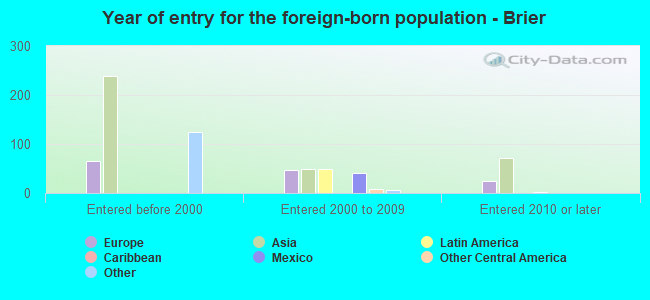
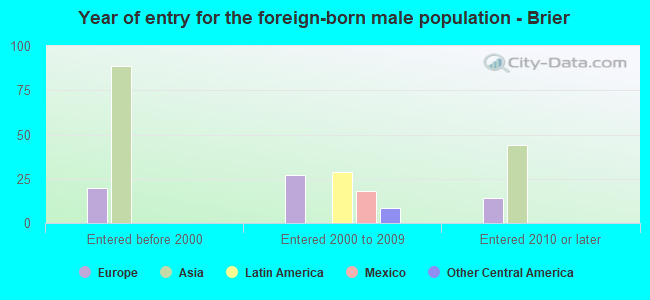
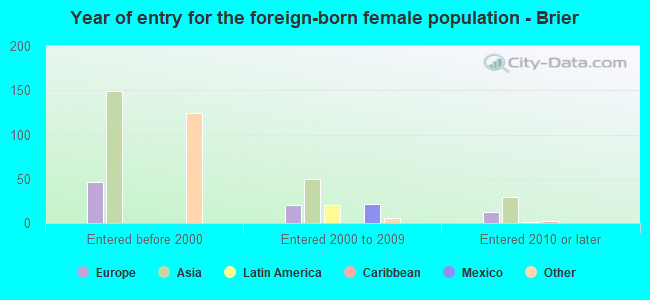
Foreign-born residents in Brier
721 residents are foreign born (5.6% Asia, 2.1% Europe, 2.1% Africa).
| This city: | 10.9% |
| Washington: | 14.9% |
Marital status for residents in Brier
Marital status - White (Caucasian) population 15 years and over
- Males
- 26.2%Never married
- 64.9%Now married
- 0.0%Separated
- 0.9%Widowed
- 8.0%Divorced
- Females
- 16.7%Never married
- 65.8%Now married
- 0.7%Separated
- 3.7%Widowed
- 13.0%Divorced
Women who gave birth in the past 12 months
| Now married: | 100.0% (43) |
| Unmarried: | 0.0% (0) |
Women who did not give birth in the past 12 months
| Now married: | 57.4% (478) |
| Unmarried: | 42.6% (355) |
Marital status - Black or African American population 15 years and over
- Males
- 30.6%Never married
- 69.4%Now married
- 0.0%Separated
- 0.0%Widowed
- 0.0%Divorced
- Females
- 22.0%Never married
- 0.0%Now married
- 0.0%Separated
- 78.0%Widowed
- 0.0%Divorced
Women who did not give birth in the past 12 months
| Now married: | 0.0% (0) |
| Unmarried: | 100.0% (198) |
Marital status - American Indian / Alaska Native population 15 years and over
- Males
- 0.0%Never married
- 100.0%Now married
- 0.0%Separated
- 0.0%Widowed
- 0.0%Divorced
- Females
- 50.0%Never married
- 50.0%Now married
- 0.0%Separated
- 0.0%Widowed
- 0.0%Divorced
Women who did not give birth in the past 12 months
| Now married: | 50.0% (9) |
| Unmarried: | 50.0% (9) |
Marital status - Asian population 15 years and over
- Males
- 14.7%Never married
- 81.6%Now married
- 0.0%Separated
- 0.6%Widowed
- 3.1%Divorced
- Females
- 12.3%Never married
- 66.2%Now married
- 0.0%Separated
- 13.0%Widowed
- 8.5%Divorced
Women who did not give birth in the past 12 months
| Now married: | 62.8% (102) |
| Unmarried: | 37.2% (60) |
Marital status - Other race population 15 years and over
- Males
- 0.0%Never married
- 100.0%Now married
- 0.0%Separated
- 0.0%Widowed
- 0.0%Divorced
- Females
- 0.0%Never married
- 100.0%Now married
- 0.0%Separated
- 0.0%Widowed
- 0.0%Divorced
Women who did not give birth in the past 12 months
| Now married: | 100.0% (27) |
| Unmarried: | 0.0% (0) |
Marital status - Two or more races population 15 years and over
- Males
- 20.3%Never married
- 59.5%Now married
- 0.0%Separated
- 10.1%Widowed
- 10.1%Divorced
- Females
- 72.3%Never married
- 17.8%Now married
- 0.0%Separated
- 0.0%Widowed
- 9.9%Divorced
Women who did not give birth in the past 12 months
| Now married: | 0.0% (0) |
| Unmarried: | 100.0% (80) |
Marital status - White alone, not Hispanic / Latino population 15 years and over
- Males
- 26.6%Never married
- 64.9%Now married
- 0.0%Separated
- 0.9%Widowed
- 7.6%Divorced
- Females
- 16.9%Never married
- 65.9%Now married
- 0.7%Separated
- 3.7%Widowed
- 12.8%Divorced
Women who gave birth in the past 12 months
| Now married: | 100.0% (44) |
| Unmarried: | 0.0% (0) |
Women who did not give birth in the past 12 months
| Now married: | 57.3% (481) |
| Unmarried: | 42.7% (358) |
Marital status - Hispanic or Latino population 15 years and over
- Males
- 2.5%Never married
- 83.8%Now married
- 0.0%Separated
- 0.0%Widowed
- 13.8%Divorced
- Females
- 0.0%Never married
- 85.7%Now married
- 0.0%Separated
- 0.0%Widowed
- 14.3%Divorced
Women who did not give birth in the past 12 months
| Now married: | 85.7% (32) |
| Unmarried: | 14.3% (5) |
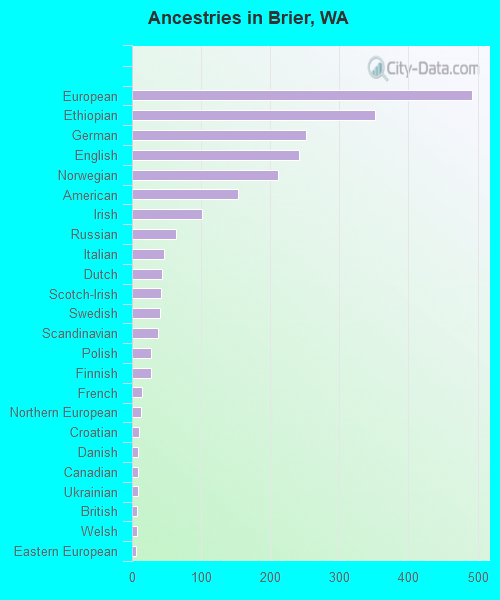
Ancestries in Brier

- 49216.5%European
- 35111.8%Ethiopian
- 2528.5%German
- 2428.1%English
- 2117.1%Norwegian
- 1545.2%American
- 1013.4%Irish
- 642.2%Russian
- 471.6%Italian
- 441.5%Dutch
- 421.4%Scotch-Irish
- 411.4%Swedish
- 381.3%Scandinavian
- 280.9%Polish
- 270.9%Finnish
- 140.5%French
- 130.4%Northern European
- 100.3%Croatian
- 90.3%Danish
- 80.3%Canadian
- 80.3%Ukrainian
- 70.2%British
- 70.2%Welsh
- 60.2%Eastern European
- 40.1%Lithuanian
- 40.1%Pennsylvania German
- 10.03%Jamaican
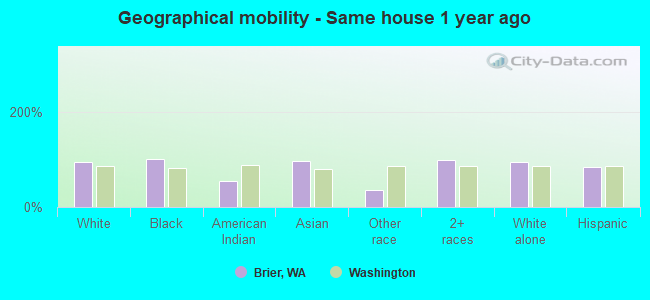
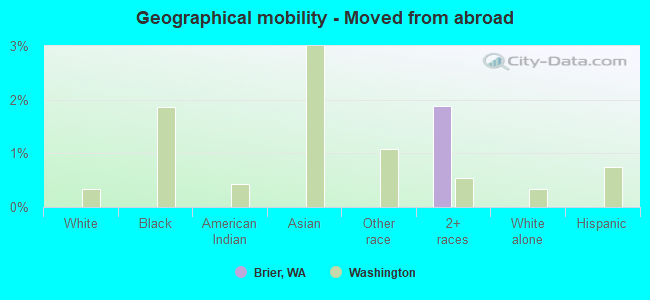
Geographical mobility in Brier

- Same house 1 year ago
- 4,66993.8%White (Caucasian)
- 385100.0%Black or African American
- 1155.0%American Indian / Alaska Native
- 56495.9%Asian
- 2835.4%Other race
- 33997.5%Two or more races
- 4,63193.7%White alone, not Hispanic / Latino
- 18683.1%Hispanic or Latino
-
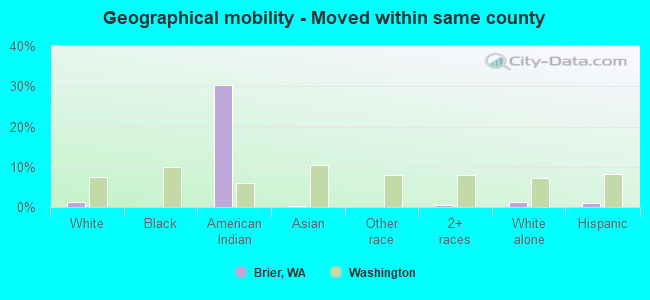
- Moved within same county
- 591.2%White / Caucasian
- 630.2%American Indian / Alaska Native
- 20.3%Asian
- 20.6%Two or more races
- 601.2%White alone, not Hispanic / Latino
- 20.9%Hispanic or Latino
-
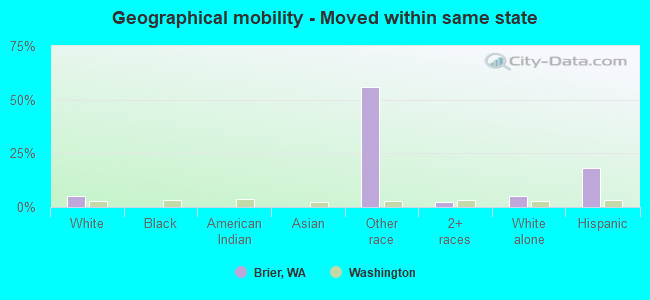
- Moved within same state
- 2464.9%White / Caucasian
- 4555.7%Other race
- 92.4%Two or more races
- 2555.2%White alone, not Hispanic / Latino
- 4018.0%Hispanic or Latino
-
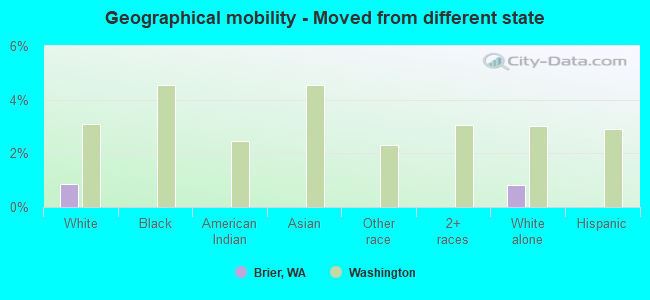
- Moved from different state
- 420.9%White / Caucasian
- 400.8%White alone, not Hispanic / Latino
-
- Moved from abroad
- 71.9%Two or more races
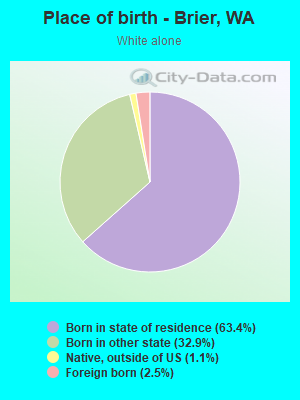
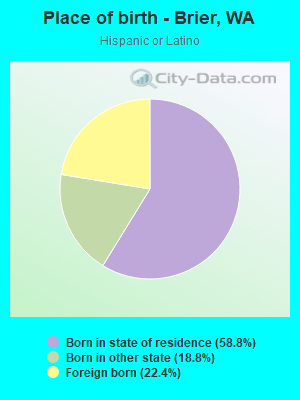
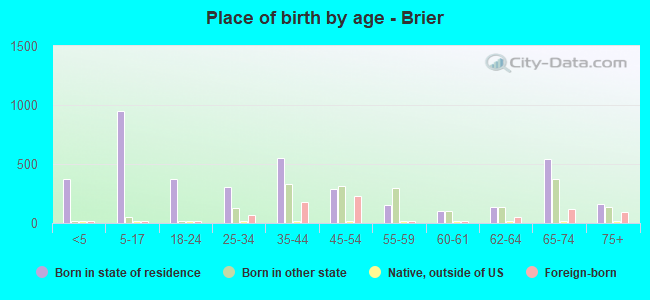
Children Nativity (place of birth) in Brier
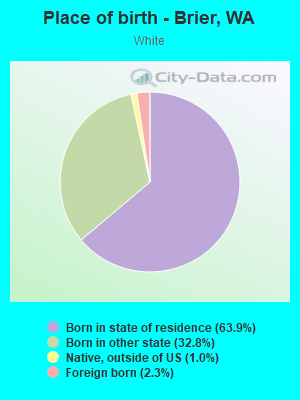
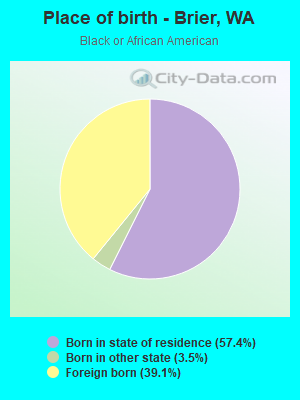
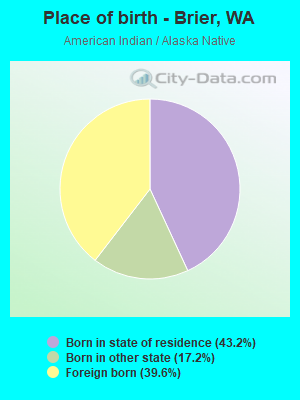
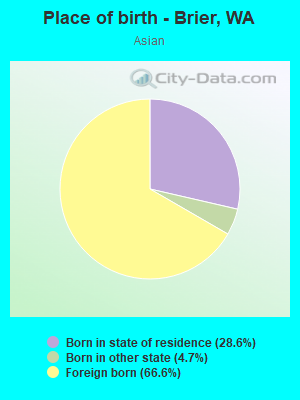
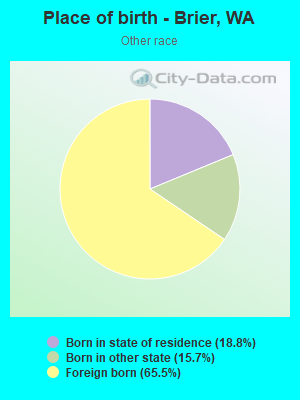
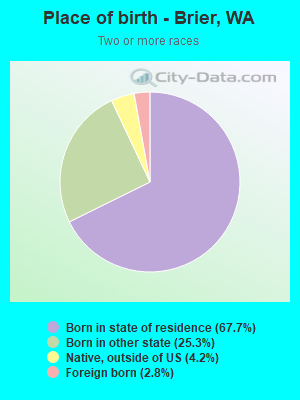
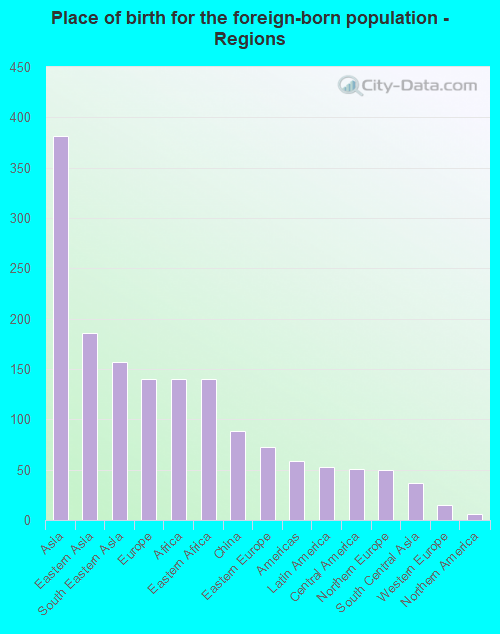
Place of birth for residents in Brier
![Place of birth for the foreign-born population - Regions]()
- 381Asia
- 186Eastern Asia
- 157South Eastern Asia
- 140Europe
- 140Africa
- 140Eastern Africa
- 88China
- 73Eastern Europe
- 59Americas
- 53Latin America
- 51Central America
- 50Northern Europe
- 37South Central Asia
- 15Western Europe
- 6Northern America
- 1Caribbean
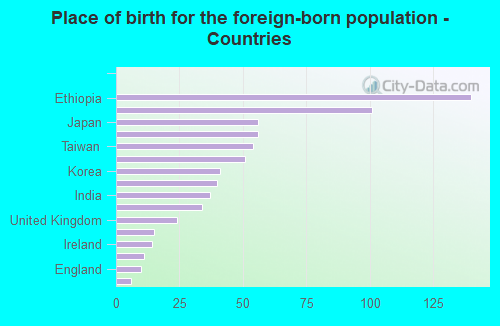
![Place of birth for the foreign-born population - Countries]()
- 140Ethiopia
- 101Philippines
- 56Japan
- 56Vietnam
- 54Taiwan
- 51Russia
- 41Korea
- 40Mexico
- 37India
- 34China
- 24United Kingdom
- 15France
- 14Ireland
- 11El Salvador
- 10England
- 6Canada
- 1Denmark
- 1Jamaica
Grandparents responsible for own grandchildren in Brier
Zip codes: 98036.