Races in Brighton, New York (NY) Detailed Stats
Data:
Races - White alone (%)
Races - White alone (% change since 2000)
Races - Black alone (%)
Races - Black alone (% change since 2000)
Races - American Indian alone (%)
Races - American Indian alone (% change since 2000)
Races - Asian alone (%)
Races - Asian alone (% change since 2000)
Races - Hispanic (%)
Races - Hispanic (% change since 2000)
Races - Native Hawaiian and Other Pacific Islander alone (%)
Races - Native Hawaiian and Other Pacific Islander alone (% change since 2000)
Races - Two or more races(%)
Races - Two or more races(% change since 2000)
Races - Other race alone (%)
Races - Other race alone (% change since 2000)
Racial diversity
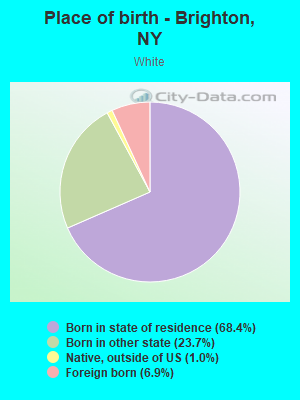
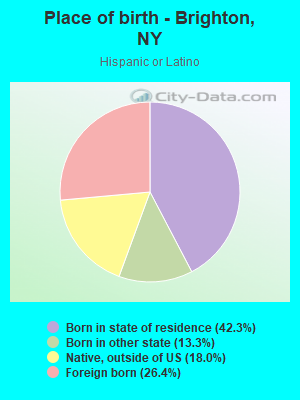
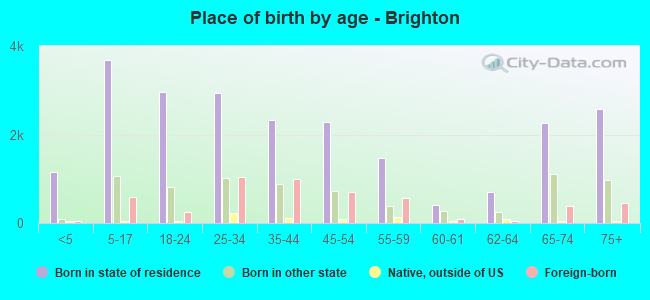
Place of birth - Born in state of residence (%)
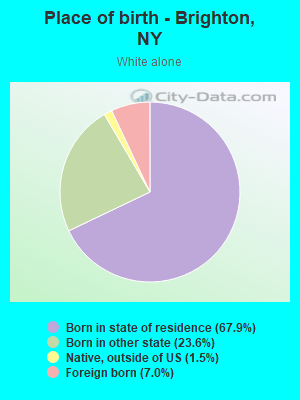
Place of birth - Born in state of residence (%) - White
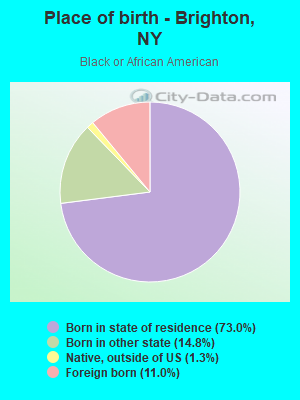
Place of birth - Born in state of residence (%) - Black or African American
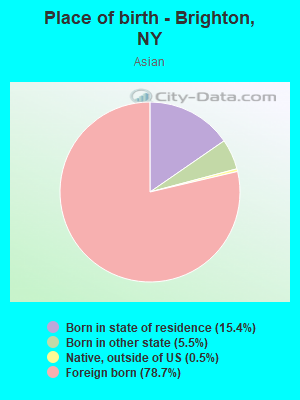
Place of birth - Born in state of residence (%) - Asian
Place of birth - Born in state of residence (%) - Hispanic or Latino
Place of birth - Born in state of residence (%) - American Indian and Alaska Native
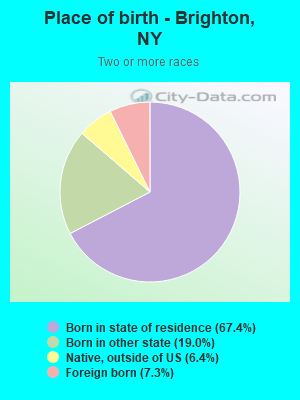
Place of birth - Born in state of residence (%) - Multirace
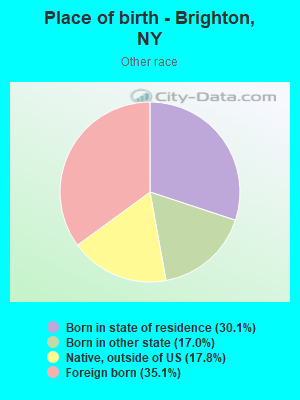
Place of birth - Born in state of residence (%) - Other Race
Place of birth - Born in other state (%)
Place of birth - Born in other state (%) - White
Place of birth - Born in other state (%) - Black or African American
Place of birth - Born in other state (%) - Asian
Place of birth - Born in other state (%) - Hispanic or Latino
Place of birth - Born in other state (%) - American Indian and Alaska Native
Place of birth - Born in other state (%) - Multirace
Place of birth - Born in other state (%) - Other Race
Place of birth - Native, outside of US (%)
Place of birth - Native, outside of US (%) - White
Place of birth - Native, outside of US (%) - Black or African American
Place of birth - Native, outside of US (%) - Asian
Place of birth - Native, outside of US (%) - Hispanic or Latino
Place of birth - Native, outside of US (%) - American Indian and Alaska Native
Place of birth - Native, outside of US (%) - Multirace
Place of birth - Native, outside of US (%) - Other Race
Place of birth - Foreign born (%)
Place of birth - Foreign born (%) - White
Place of birth - Foreign born (%) - Black or African American
Place of birth - Foreign born (%) - Asian
Place of birth - Foreign born (%) - Hispanic or Latino
Place of birth - Foreign born (%) - American Indian and Alaska Native
Place of birth - Foreign born (%) - Multirace
Place of birth - Foreign born (%) - Other Race
Residents speaking English at home (%)
Residents speaking English at home - Born in the United States (%)
Residents speaking English at home - Native, born elsewhere (%)
Residents speaking English at home - Foreign born (%)
Residents speaking Spanish at home (%)
Residents speaking Spanish at home - Born in the United States (%)
Residents speaking Spanish at home - Native, born elsewhere (%)
Residents speaking Spanish at home - Foreign born (%)
Residents speaking other language at home (%)
Residents speaking other language at home - Born in the United States (%)
Residents speaking other language at home - Native, born elsewhere (%)
Residents speaking other language at home - Foreign born (%)
Marital status - Never married (%)
Marital status - Now married (%)
Marital status - Separated (%)
Marital status - Widowed (%)
Marital status - Divorced (%)
Ancestries Reported - Arab (%)
Ancestries Reported - Czech (%)
Ancestries Reported - Danish (%)
Ancestries Reported - Dutch (%)
Ancestries Reported - English (%)
Ancestries Reported - French (%)
Ancestries Reported - French Canadian (%)
Ancestries Reported - German (%)
Ancestries Reported - Greek (%)
Ancestries Reported - Hungarian (%)
Ancestries Reported - Irish (%)
Ancestries Reported - Italian (%)
Ancestries Reported - Lithuanian (%)
Ancestries Reported - Norwegian (%)
Ancestries Reported - Polish (%)
Ancestries Reported - Portuguese (%)
Ancestries Reported - Russian (%)
Ancestries Reported - Scotch-Irish (%)
Ancestries Reported - Scottish (%)
Ancestries Reported - Slovak (%)
Ancestries Reported - Subsaharan African (%)
Ancestries Reported - Swedish (%)
Ancestries Reported - Swiss (%)
Ancestries Reported - Ukrainian (%)
Ancestries Reported - United States (%)
Ancestries Reported - Welsh (%)
Ancestries Reported - West Indian (%)
Ancestries Reported - Other (%)
Geographical mobility - Same house 1 year ago (%)
Geographical mobility - Same house 1 year ago (%) - White
Geographical mobility - Same house 1 year ago (%) - Black or African American
Geographical mobility - Same house 1 year ago (%) - Asian
Geographical mobility - Same house 1 year ago (%) - Hispanic or Latino
Geographical mobility - Same house 1 year ago (%) - American Indian and Alaska Native
Geographical mobility - Same house 1 year ago (%) - Multirace
Geographical mobility - Same house 1 year ago (%) - Other Race
Geographical mobility - Moved within same county (%)
Geographical mobility - Moved within same county (%) - White
Geographical mobility - Moved within same county (%) - Black or African American
Geographical mobility - Moved within same county (%) - Asian
Geographical mobility - Moved within same county (%) - Hispanic or Latino
Geographical mobility - Moved within same county (%) - American Indian and Alaska Native
Geographical mobility - Moved within same county (%) - Multirace
Geographical mobility - Moved within same county (%) - Other Race
Geographical mobility - Moved from different county within same state (%)
Geographical mobility - Moved from different county within same state (%) - White
Geographical mobility - Moved from different county within same state (%) - Black or African American
Geographical mobility - Moved from different county within same state (%) - Asian
Geographical mobility - Moved from different county within same state (%) - Hispanic or Latino
Geographical mobility - Moved from different county within same state (%) - American Indian and Alaska Native
Geographical mobility - Moved from different county within same state (%) - Multirace
Geographical mobility - Moved from different county within same state (%) - Other Race
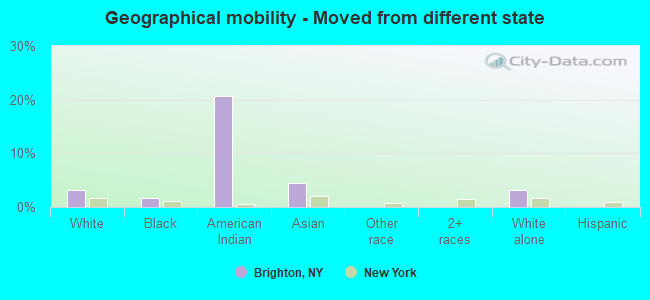
Geographical mobility - Moved from different state (%)
Geographical mobility - Moved from different state (%) - White
Geographical mobility - Moved from different state (%) - Black or African American
Geographical mobility - Moved from different state (%) - Asian
Geographical mobility - Moved from different state (%) - Hispanic or Latino
Geographical mobility - Moved from different state (%) - American Indian and Alaska Native
Geographical mobility - Moved from different state (%) - Multirace
Geographical mobility - Moved from different state (%) - Other Race
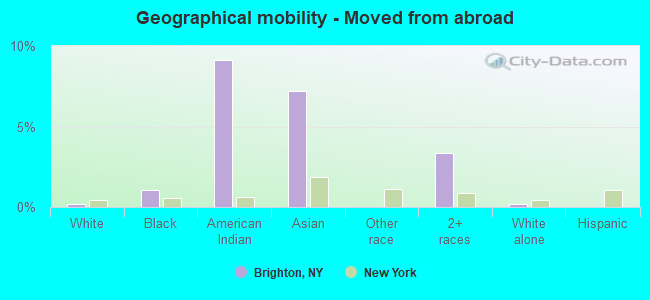
Geographical mobility - Moved from abroad (%)
Geographical mobility - Moved from abroad (%) - White
Geographical mobility - Moved from abroad (%) - Black or African American
Geographical mobility - Moved from abroad (%) - Asian
Geographical mobility - Moved from abroad (%) - Hispanic or Latino
Geographical mobility - Moved from abroad (%) - American Indian and Alaska Native
Geographical mobility - Moved from abroad (%) - Multirace
Geographical mobility - Moved from abroad (%) - Other Race
Place of birth for the foreign-born population - Ireland (%)
Place of birth for the foreign-born population - Denmark (%)
Place of birth for the foreign-born population - Norway (%)
Place of birth for the foreign-born population - Sweden (%)
Place of birth for the foreign-born population - United Kingdom (%)
Place of birth for the foreign-born population - England (%)
Place of birth for the foreign-born population - Scotland (%)
Place of birth for the foreign-born population - Other Northern Europe (%)
Place of birth for the foreign-born population - Austria (%)
Place of birth for the foreign-born population - Belgium (%)
Place of birth for the foreign-born population - France (%)
Place of birth for the foreign-born population - Germany (%)
Place of birth for the foreign-born population - Netherlands (%)
Place of birth for the foreign-born population - Switzerland (%)
Place of birth for the foreign-born population - Other Western Europe (%)
Place of birth for the foreign-born population - Greece (%)
Place of birth for the foreign-born population - Italy (%)
Place of birth for the foreign-born population - Portugal (%)
Place of birth for the foreign-born population - Spain (%)
Place of birth for the foreign-born population - Other Southern Europe (%)
Place of birth for the foreign-born population - Albania (%)
Place of birth for the foreign-born population - Belarus (%)
Place of birth for the foreign-born population - Bosnia and Herzegovina (%)
Place of birth for the foreign-born population - Bulgaria (%)
Place of birth for the foreign-born population - Croatia (%)
Place of birth for the foreign-born population - Czechoslovakia (%)
Place of birth for the foreign-born population - Hungary (%)
Place of birth for the foreign-born population - Latvia (%)
Place of birth for the foreign-born population - Lithuania (%)
Place of birth for the foreign-born population - North Macedonia (Macedonia) (%)
Place of birth for the foreign-born population - Moldova (%)
Place of birth for the foreign-born population - Poland (%)
Place of birth for the foreign-born population - Romania (%)
Place of birth for the foreign-born population - Russia (%)
Place of birth for the foreign-born population - Serbia (%)
Place of birth for the foreign-born population - Ukraine (%)
Place of birth for the foreign-born population - Other Eastern Europe (%)
Place of birth for the foreign-born population - China (%)
Place of birth for the foreign-born population - Hong Kong (%)
Place of birth for the foreign-born population - Taiwan (%)
Place of birth for the foreign-born population - Japan (%)
Place of birth for the foreign-born population - Korea (%)
Place of birth for the foreign-born population - Other Eastern Asia (%)
Place of birth for the foreign-born population - Afghanistan (%)
Place of birth for the foreign-born population - Bangladesh (%)
Place of birth for the foreign-born population - India (%)
Place of birth for the foreign-born population - Iran (%)
Place of birth for the foreign-born population - Kazakhstan (%)
Place of birth for the foreign-born population - Nepal (%)
Place of birth for the foreign-born population - Pakistan (%)
Place of birth for the foreign-born population - Sri Lanka (%)
Place of birth for the foreign-born population - Uzbekistan (%)
Place of birth for the foreign-born population - Other South Central Asia (%)
Place of birth for the foreign-born population - Burma (%)
Place of birth for the foreign-born population - Cambodia (%)
Place of birth for the foreign-born population - Indonesia (%)
Place of birth for the foreign-born population - Laos (%)
Place of birth for the foreign-born population - Malaysia (%)
Place of birth for the foreign-born population - Philippines (%)
Place of birth for the foreign-born population - Singapore (%)
Place of birth for the foreign-born population - Thailand (%)
Place of birth for the foreign-born population - Vietnam (%)
Place of birth for the foreign-born population - Other South Eastern Asia (%)
Place of birth for the foreign-born population - Armenia (%)
Place of birth for the foreign-born population - Iraq (%)
Place of birth for the foreign-born population - Israel (%)
Place of birth for the foreign-born population - Jordan (%)
Place of birth for the foreign-born population - Kuwait (%)
Place of birth for the foreign-born population - Lebanon (%)
Place of birth for the foreign-born population - Saudi Arabia (%)
Place of birth for the foreign-born population - Syria (%)
Place of birth for the foreign-born population - Turkey (%)
Place of birth for the foreign-born population - Yemen (%)
Place of birth for the foreign-born population - Other Western Asia (%)
Place of birth for the foreign-born population - Eritrea (%)
Place of birth for the foreign-born population - Ethiopia (%)
Place of birth for the foreign-born population - Kenya (%)
Place of birth for the foreign-born population - Somalia (%)
Place of birth for the foreign-born population - Uganda (%)
Place of birth for the foreign-born population - Zimbabwe (%)
Place of birth for the foreign-born population - Other Eastern Africa (%)
Place of birth for the foreign-born population - Cameroon (%)
Place of birth for the foreign-born population - Congo (%)
Place of birth for the foreign-born population - Democratic Republic of Congo (Zaire) (%)
Place of birth for the foreign-born population - Other Middle Africa (%)
Place of birth for the foreign-born population - Egypt (%)
Place of birth for the foreign-born population - Morocco (%)
Place of birth for the foreign-born population - Sudan (%)
Place of birth for the foreign-born population - Other Northern Africa (%)
Place of birth for the foreign-born population - South Africa (%)
Place of birth for the foreign-born population - Other Southern Africa (%)
Place of birth for the foreign-born population - Cabo Verde (%)
Place of birth for the foreign-born population - Ghana (%)
Place of birth for the foreign-born population - Liberia (%)
Place of birth for the foreign-born population - Nigeria (%)
Place of birth for the foreign-born population - Senegal (%)
Place of birth for the foreign-born population - Sierra Leone (%)
Place of birth for the foreign-born population - Other Western Africa (%)
Place of birth for the foreign-born population - Australia (%)
Place of birth for the foreign-born population - New Zealand (%)
Place of birth for the foreign-born population - Fiji (%)
Place of birth for the foreign-born population - Micronesia (%)
Place of birth for the foreign-born population - Bahamas (%)
Place of birth for the foreign-born population - Barbados (%)
Place of birth for the foreign-born population - Cuba (%)
Place of birth for the foreign-born population - Dominica (%)
Place of birth for the foreign-born population - Dominican Republic (%)
Place of birth for the foreign-born population - Grenada (%)
Place of birth for the foreign-born population - Haiti (%)
Place of birth for the foreign-born population - Jamaica (%)
Place of birth for the foreign-born population - St. Vincent and the Grenadines (%)
Place of birth for the foreign-born population - Trinidad and Tobago (%)
Place of birth for the foreign-born population - West Indies (%)
Place of birth for the foreign-born population - Other Caribbean (%)
Place of birth for the foreign-born population - Belize (%)
Place of birth for the foreign-born population - Costa Rica (%)
Place of birth for the foreign-born population - El Salvador (%)
Place of birth for the foreign-born population - Guatemala (%)
Place of birth for the foreign-born population - Honduras (%)
Place of birth for the foreign-born population - Mexico (%)
Place of birth for the foreign-born population - Nicaragua (%)
Place of birth for the foreign-born population - Panama (%)
Place of birth for the foreign-born population - Other Central America (%)
Place of birth for the foreign-born population - Argentina (%)
Place of birth for the foreign-born population - Bolivia (%)
Place of birth for the foreign-born population - Brazil (%)
Place of birth for the foreign-born population - Chile (%)
Place of birth for the foreign-born population - Colombia (%)
Place of birth for the foreign-born population - Ecuador (%)
Place of birth for the foreign-born population - Guyana (%)
Place of birth for the foreign-born population - Peru (%)
Place of birth for the foreign-born population - Uruguay (%)
Place of birth for the foreign-born population - Venezuela (%)
Place of birth for the foreign-born population - Other South America (%)
Place of birth for the foreign-born population - Canada (%)
Place of birth for the foreign-born population - Other Northern America (%)
Place of birth for the foreign-born population - Other (%)
Latest news about races in Brighton, NY collected exclusively by city-data.com from local newspapers, TV, and radio stations
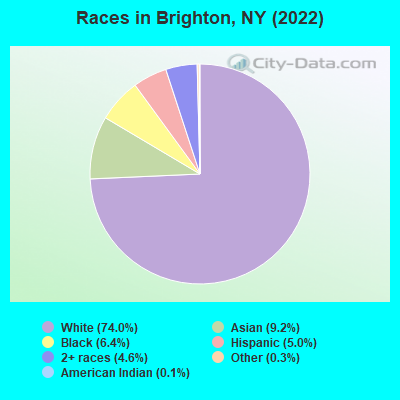
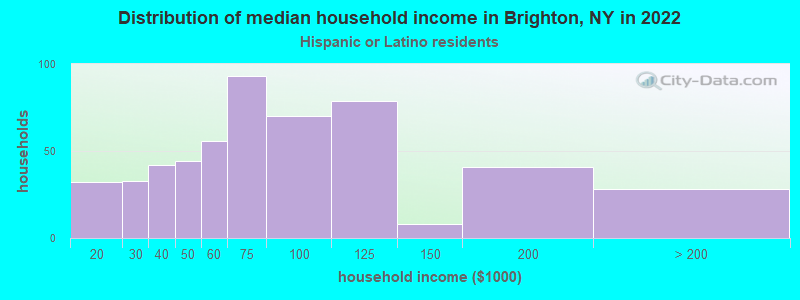
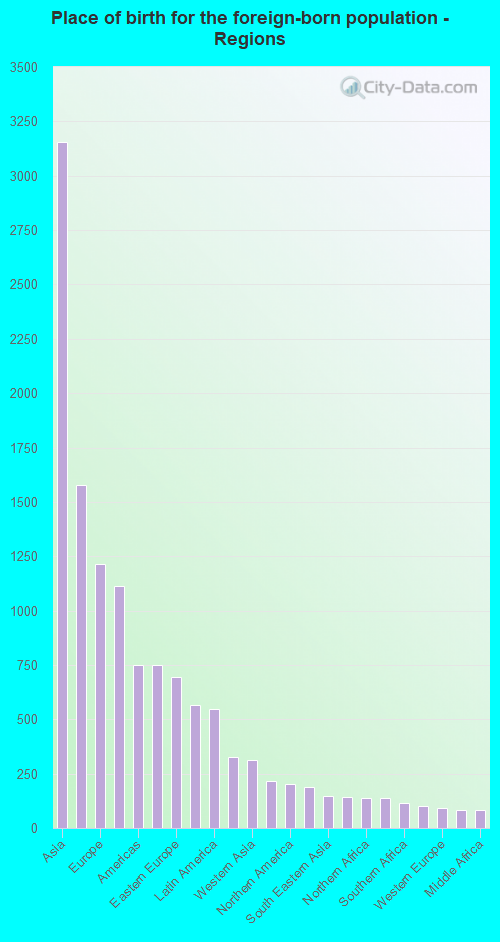
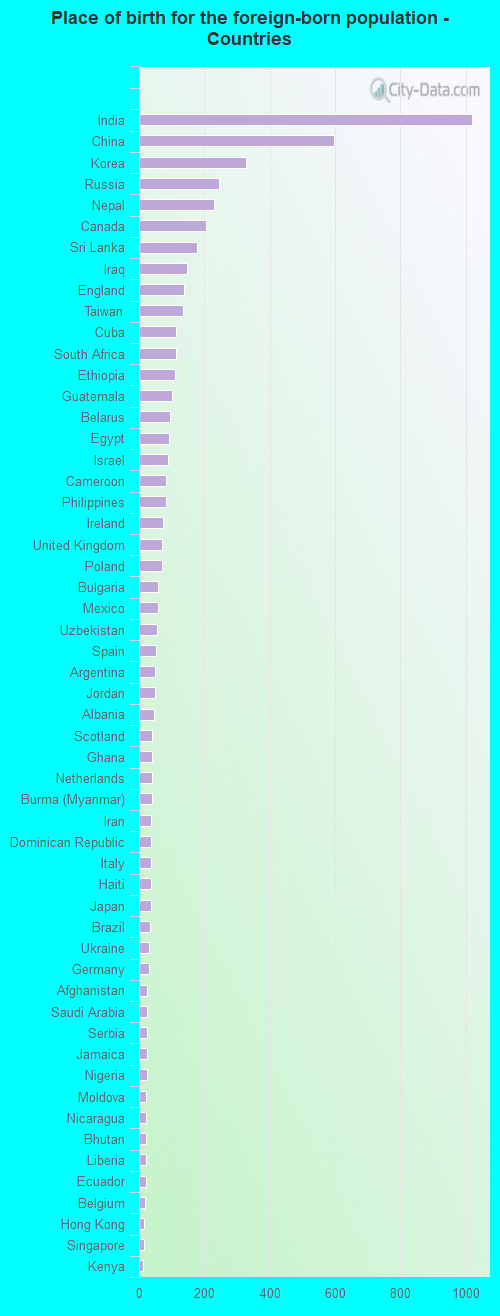
According to 2022 data, the most numerous races in Brighton, NY are White alone (27,089 residents), Hispanic (1,845 residents), and Black alone (2,355 residents). 84.6% of Brighton residents speak English at home. 15.5% of Brighton, NY residents are foreign-born (8.7% born in Asia, 3.3% born in Europe, 1.6% born in Africa), which is 41.5% less than the foreign-born rate of 22.0% across the entire state of New York.
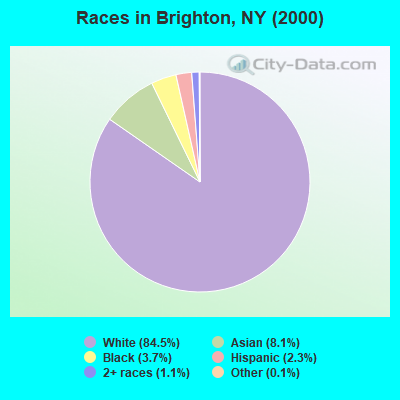
Race distribution in Brighton
2000 2022
11,760,981 62.0% White alone 2,867,583 15.1% Hispanic 2,812,623 14.8% Black alone 1,035,926 5.5% Asian alone 366,116 1.9% Two or more races 75,499 0.4% Other race alone 52,499 0.3% American Indian alone 5,230 0.03% Native Hawaiian and Other
10,408,933 52.9% White alone 3,867,299 19.7% Hispanic 2,633,840 13.4% Black alone 1,776,286 9.0% Asian alone 732,670 3.7% Two or more races 216,110 1.1% Other race alone 35,082 0.2% American Indian alone 6,931 0.04% Native Hawaiian and Other
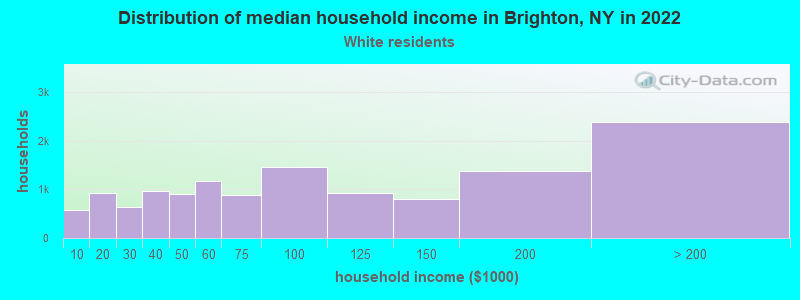
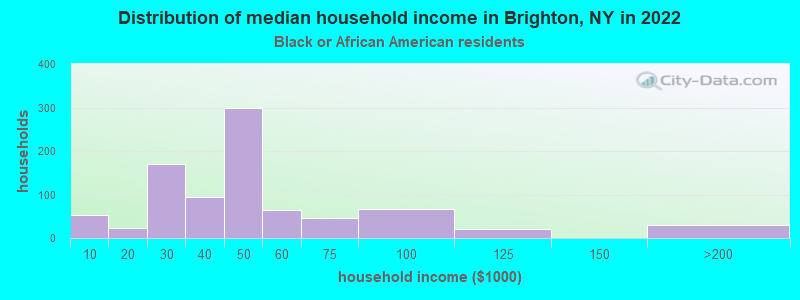
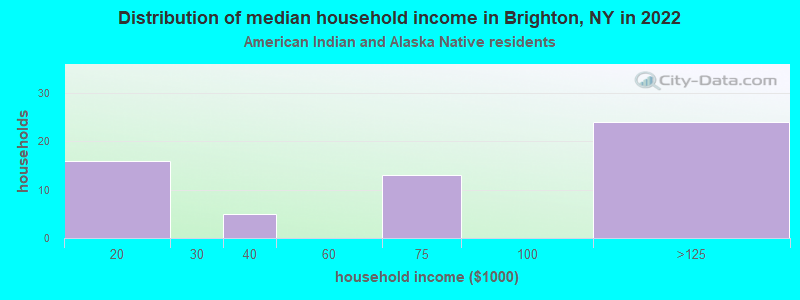
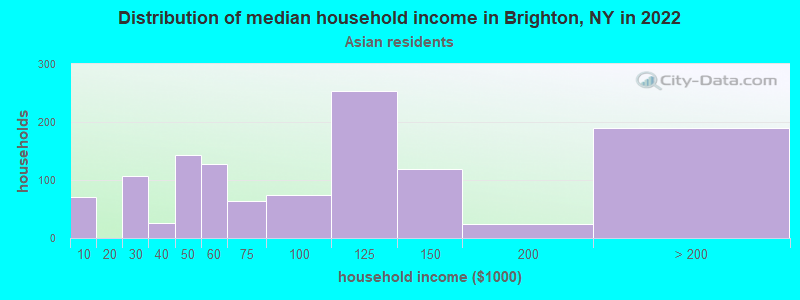
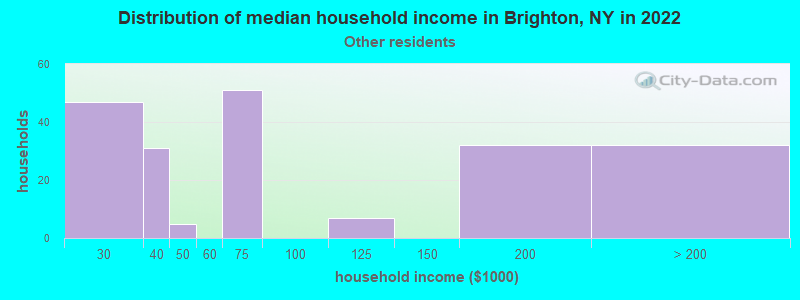
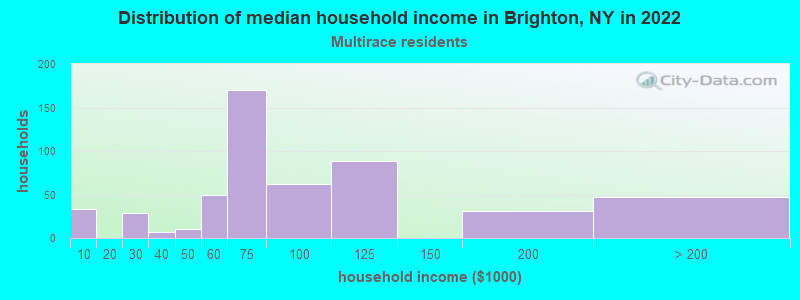
Income and house value in Brighton Median household income in 2022 $82,015 White non-Hispanic householders$36,205 Black householders$82,127 Asian householders$60,096 Some other race householders$73,522 Two or more races householders$60,377 Hispanic or Latino race householdersMedian 2022 house value $259,649 White Non-Hispanic householders$231,263 Black or African American householders$156,541 American Indian or Alaska Native householders $284,905 Asian householders$244,204 Some other race householders$156,541 Two or more races householders$263,406 Hispanic or Latino householders
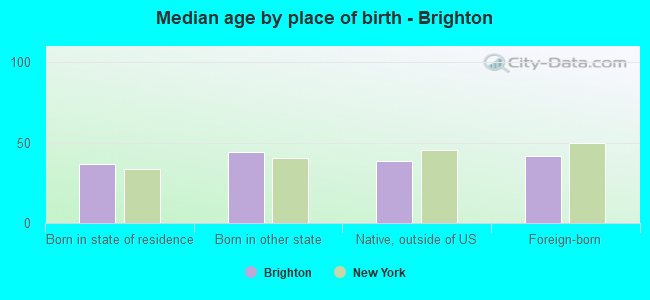
Median age by race in Brighton
44.7 Median age for White residents42.4 47.9 33.6 Median age for Black or African American residents31.4 38.6 59.3 Median age for American Indian / Alaska Native residents50.4 112.8 33.1 Median age for Asian residents30.6 33.7 -487,992,314.6 Median age for Native Hawaiian / Pacific Islander residents-477,502,295.2 -497,387,669.3 25.8 Median age for Other race residents25.2 26.7 20.5 Median age for Two or more races residents21.5 20.1 44.9 Median age for White alone residents42.7 47.5 29.1 Median age for Hispanic or Latino residents29.0 29.7
Owner/renter occupied households by race in Brighton
House owners and renters - White residents 7,825 60.0% Owner occupied5,213 40.0% Renter occupiedHouse owners and renters - Black or African American residents 192 23.0% Owner occupied642 77.0% Renter occupiedHouse owners and renters - American Indian / Alaska Native residents 21 34.4% Owner occupied40 65.6% Renter occupiedHouse owners and renters - Asian residents 432 35.4% Owner occupied790 64.6% Renter occupiedHouse owners and renters - Other race residents 110 40.7% Owner occupied160 59.3% Renter occupiedHouse owners and renters - Two or more races residents 300 58.6% Owner occupied212 41.4% Renter occupiedHouse owners and renters - White alone residents 7,846 59.7% Owner occupied5,299 40.3% Renter occupiedHouse owners and renters - Hispanic or Latino residents 202 39.1% Owner occupied315 60.9% Renter occupied
Language usage in Brighton
English speakers - Total 84.6% of residents of Brighton speak English at home.
2.0% of residents speak Spanish at home 604 85.0% Speak English very well107 15.0% Speak English less than very well12.9% of residents speak other language at home 3,125 68.4% Speak English very well1,443 31.6% Speak English less than very well
English speakers - Born in the United States 92.6% of residents of Brighton speak English at home.
1.0% of residents speak Spanish at home 73 100.0% Speak English very well7.0% of residents speak other language at home 418 80.5% Speak English very well101 19.5% Speak English less than very well
English speakers - Native, born elsewhere 74.9% of residents of Brighton speak English at home.
19.4% of residents speak Spanish at home 143 90.5% Speak English very well15 9.5% Speak English less than very well7.2% of residents speak other language at home 47 79.7% Speak English very well12 20.3% Speak English less than very well
English speakers - Foreign-born 32.8% of residents of Brighton speak English at home.
5.2% of residents speak Spanish at home 209 78.9% Speak English very well56 21.1% Speak English less than very well60.9% of residents speak other language at home 1,861 59.5% Speak English very well1,268 40.5% Speak English less than very well
White (Caucasian) - Speak only English Native:
97.1% (23,674)Foreign-born:
53.7% (988)
White (Caucasian) - Speak another language Native:
2.9% (704)Foreign-born:
47.2% (869)
Black or African American - Speak only English Native:
98.2% (2,052)Foreign-born:
53.7% (136)
Black or African American - Speak another language Native:
1.8% (37)Foreign-born:
46.1% (117)
Asian - Speak only English Native:
54.2% (330)Foreign-born:
17.6% (470)
Asian - Speak another language Native:
44.3% (270)Foreign-born:
81.8% (2,185)
Other race - Speak only English Native:
82.8% (364)Foreign-born:
49.6% (123)
Other race - Speak another language Native:
28.8% (126)Foreign-born:
35.0% (87)
Two or more races - Speak another language Native:
20.3% (395)Foreign-born:
100.0% (179)
White alone - Speak only English Native:
96.1% (23,477)Foreign-born:
52.4% (979)
White alone - Speak another language Native:
3.8% (923)Foreign-born:
48.0% (896)
Hispanic or Latino - Speak only English Native:
73.6% (876)Foreign-born:
39.0% (188)
Hispanic or Latino - Speak another language Native:
32.2% (384)Foreign-born:
61.8% (299)
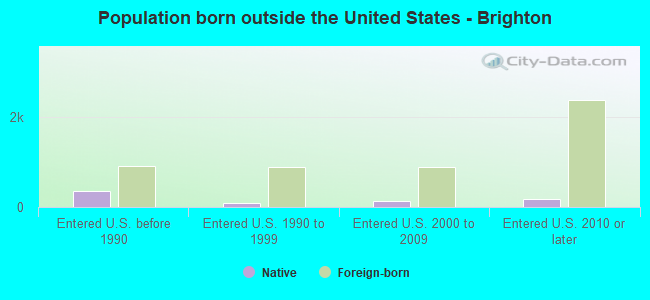
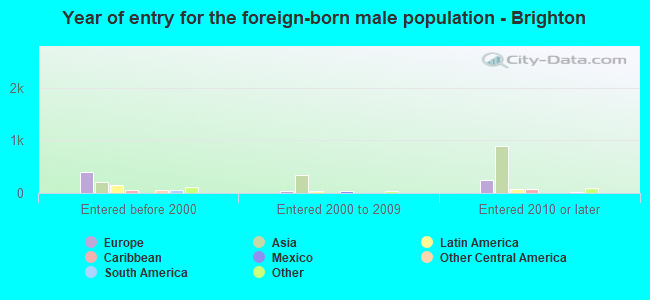
Foreign-born residents in Brighton 5,690 residents are foreign born (8.7% Asia , 3.3% Europe , 1.6% Africa ).
This city:
15.5%New York:
22.6%
Marital status for residents in Brighton Marital status - White (Caucasian) population 15 years and over
Males 34.2% Never married55.2% Now married1.9% Separated3.0% Widowed5.7% DivorcedFemales 30.2% Never married45.1% Now married0.4% Separated11.4% Widowed12.9% DivorcedWomen who gave birth in the past 12 months Now married:
92.3% (166)Unmarried:
7.7% (14)
Women who did not give birth in the past 12 months Now married:
41.6% (2,358)Unmarried:
58.4% (3,314)
Marital status - Black or African American population 15 years and over
Males 67.0% Never married24.1% Now married0.0% Separated6.1% Widowed2.8% DivorcedFemales 58.6% Never married25.4% Now married2.3% Separated6.9% Widowed6.7% DivorcedWomen who gave birth in the past 12 months Now married:
100.0% (10)Unmarried:
0.0% (0)
Women who did not give birth in the past 12 months Now married:
24.6% (214)Unmarried:
75.4% (656)
Marital status - American Indian / Alaska Native population 15 years and over
Males 53.1% Never married46.9% Now married0.0% Separated0.0% Widowed0.0% DivorcedFemales 50.0% Never married37.5% Now married0.0% Separated0.0% Widowed12.5% DivorcedMarital status - Asian population 15 years and over
Males 36.7% Never married51.4% Now married1.7% Separated1.6% Widowed8.6% DivorcedFemales 25.9% Never married62.0% Now married0.0% Separated4.0% Widowed8.1% DivorcedWomen who gave birth in the past 12 months Now married:
100.0% (43)Unmarried:
0.0% (0)
Women who did not give birth in the past 12 months Now married:
57.4% (565)Unmarried:
42.6% (420)
Marital status - Other race population 15 years and over
Males 40.3% Never married40.8% Now married0.0% Separated0.0% Widowed18.9% DivorcedFemales 74.4% Never married17.2% Now married0.0% Separated2.0% Widowed6.4% DivorcedWomen who did not give birth in the past 12 months Now married:
8.1% (20)Unmarried:
91.9% (227)
Marital status - Two or more races population 15 years and over
Males 58.6% Never married30.0% Now married0.8% Separated7.0% Widowed3.6% DivorcedFemales 44.3% Never married40.4% Now married0.0% Separated0.8% Widowed14.5% DivorcedWomen who did not give birth in the past 12 months Now married:
33.6% (123)Unmarried:
66.4% (243)
Marital status - White alone, not Hispanic / Latino population 15 years and over
Males 33.7% Never married55.9% Now married1.8% Separated3.0% Widowed5.6% DivorcedFemales 30.0% Never married45.0% Now married0.4% Separated11.6% Widowed13.1% DivorcedWomen who gave birth in the past 12 months Now married:
100.0% (154)Unmarried:
0.0% (0)
Women who did not give birth in the past 12 months Now married:
41.0% (2,349)Unmarried:
59.0% (3,375)
Marital status - Hispanic or Latino population 15 years and over
Males 55.7% Never married29.8% Now married3.3% Separated1.5% Widowed9.7% DivorcedFemales 46.7% Never married40.5% Now married0.0% Separated1.0% Widowed11.7% DivorcedWomen who gave birth in the past 12 months Now married:
57.1% (20)Unmarried:
42.9% (15)
Women who did not give birth in the past 12 months Now married:
40.5% (196)Unmarried:
59.5% (288)
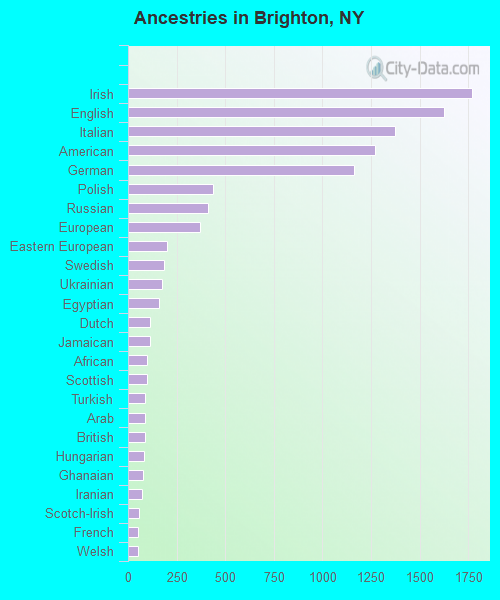
Ancestries in Brighton
1,769 10.8% Irish1,624 9.9% English1,373 8.4% Italian1,270 7.8% American1,164 7.1% German438 2.7% Polish414 2.5% Russian371 2.3% European201 1.2% Eastern European183 1.1% Swedish174 1.1% Ukrainian162 1.0% Egyptian114 0.7% Dutch114 0.7% Jamaican100 0.6% African99 0.6% Scottish89 0.5% Turkish88 0.5% Arab87 0.5% British80 0.5% Hungarian77 0.5% Ghanaian74 0.5% Iranian59 0.4% Scotch-Irish54 0.3% French51 0.3% Welsh47 0.3% Scandinavian43 0.3% Albanian39 0.2% Israeli30 0.2% Afghan29 0.2% Lebanese29 0.2% Serbian26 0.2% Norwegian25 0.2% Greek24 0.1% Nigerian23 0.1% French Canadian21 0.1% Celtic20 0.1% Alsatian19 0.1% Danish16 0.10% Swiss14 0.09% Haitian12 0.07% Canadian12 0.07% Belgian11 0.07% Lithuanian7 0.04% Slovak5 0.03% Liberian5 0.03% Macedonian4 0.02% Czechoslovakian4 0.02% Czech3 0.02% Austrian3 0.02% Northern European3 0.02% Moroccan3 0.02% West Indian
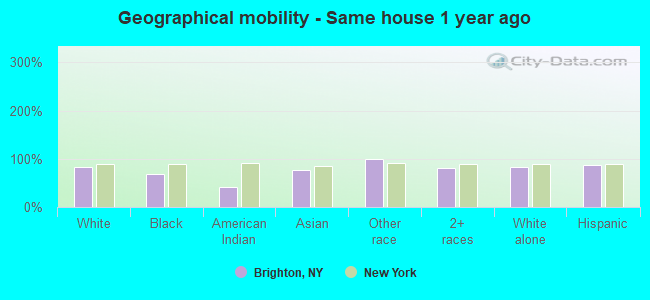
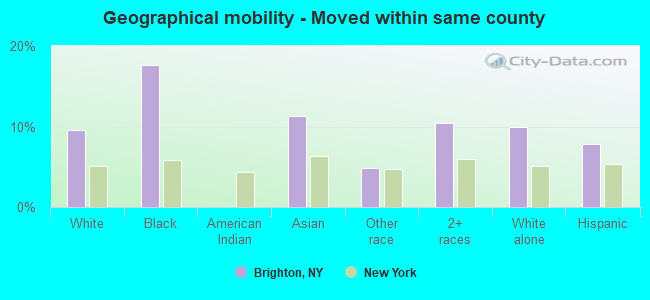
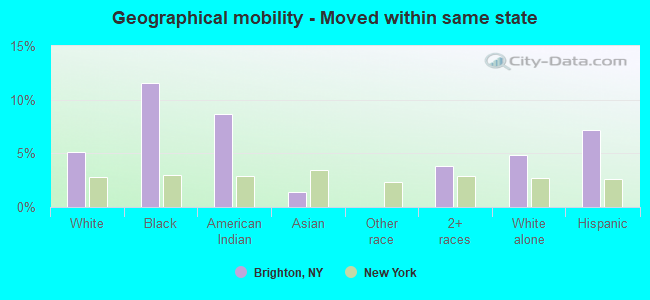
Geographical mobility in Brighton Same house 1 year ago 22,211 82.1% White (Caucasian)1,677 69.0% Black or African American42 42.2% American Indian / Alaska Native2,577 75.9% Asian733 99.9% Other race1,893 80.7% Two or more races22,101 81.8% White alone, not Hispanic / Latino1,604 87.0% Hispanic or LatinoMoved within same county 2,584 9.6% White / Caucasian427 17.6% Black or African American383 11.3% Asian35 4.8% Other race245 10.4% Two or more races2,690 10.0% White alone, not Hispanic / Latino144 7.8% Hispanic or LatinoMoved within same state 1,376 5.1% White / Caucasian280 11.5% Black or African American9 8.6% American Indian / Alaska Native48 1.4% Asian90 3.9% Two or more races1,302 4.8% White alone, not Hispanic / Latino132 7.1% Hispanic or LatinoMoved from different state 837 3.1% White / Caucasian41 1.7% Black or African American21 20.6% American Indian / Alaska Native152 4.5% Asian870 3.2% White alone, not Hispanic / LatinoMoved from abroad 42 0.2% White26 1.1% Black or African American9 9.1% American Indian / Alaska Native243 7.2% Asian78 3.3% Two or more races50 0.2% White alone, not Hispanic / Latino
Children Nativity (place of birth) in Brighton
Children under 6 years - Living with two parents Both parents native 996 93.3% Native72 6.7% Foreign-bornBoth parents foreign-born 262 89.4% Native31 10.6% Foreign-bornOne native, one foreign-born parent 173 100.0% NativeChildren under 6 years - Living with one parent Native parent 99 100.0% NativeForeign-born parent 17 100.0% NativeChildren 6 to 17 years - Living with two parents Both parents native 2,436 99.9% Native1 0.1% Foreign-bornBoth parents foreign-born 432 55.4% Native347 44.6% Foreign-bornOne native, one foreign-born parent 456 89.5% Native53 10.5% Foreign-bornChildren 6 to 17 years - Living with one parent Native parent 706 100.0% NativeForeign-born parent 282 57.5% Native208 42.5% Foreign-born
Grandparents responsible for own grandchildren in Brighton
Grandparents (30 to 59 years) White / Caucasian 8 100.0% Responsible for grandchildrenWhite alone, not Hispanic / Latino 9 100.0% Responsible for grandchildrenGrandparents (60 years and over) White / Caucasian 30 41.0% Responsible for grandchildren43 59.0% Not responsible for grandchildrenWhite alone, not Hispanic / Latino 31 41.7% Responsible for grandchildren44 58.3% Not responsible for grandchildren