Races in Bristol, Connecticut (CT) Detailed Stats
Data:
Races - White alone (%)
Races - White alone (% change since 2000)
Races - Black alone (%)
Races - Black alone (% change since 2000)
Races - American Indian alone (%)
Races - American Indian alone (% change since 2000)
Races - Asian alone (%)
Races - Asian alone (% change since 2000)
Races - Hispanic (%)
Races - Hispanic (% change since 2000)
Races - Native Hawaiian and Other Pacific Islander alone (%)
Races - Native Hawaiian and Other Pacific Islander alone (% change since 2000)
Races - Two or more races(%)
Races - Two or more races(% change since 2000)
Races - Other race alone (%)
Races - Other race alone (% change since 2000)
Racial diversity
Place of birth - Born in state of residence (%)
Place of birth - Born in state of residence (%) - White
Place of birth - Born in state of residence (%) - Black or African American
Place of birth - Born in state of residence (%) - Asian
Place of birth - Born in state of residence (%) - Hispanic or Latino
Place of birth - Born in state of residence (%) - American Indian and Alaska Native
Place of birth - Born in state of residence (%) - Multirace
Place of birth - Born in state of residence (%) - Other Race
Place of birth - Born in other state (%)
Place of birth - Born in other state (%) - White
Place of birth - Born in other state (%) - Black or African American
Place of birth - Born in other state (%) - Asian
Place of birth - Born in other state (%) - Hispanic or Latino
Place of birth - Born in other state (%) - American Indian and Alaska Native
Place of birth - Born in other state (%) - Multirace
Place of birth - Born in other state (%) - Other Race
Place of birth - Native, outside of US (%)
Place of birth - Native, outside of US (%) - White
Place of birth - Native, outside of US (%) - Black or African American
Place of birth - Native, outside of US (%) - Asian
Place of birth - Native, outside of US (%) - Hispanic or Latino
Place of birth - Native, outside of US (%) - American Indian and Alaska Native
Place of birth - Native, outside of US (%) - Multirace
Place of birth - Native, outside of US (%) - Other Race
Place of birth - Foreign born (%)
Place of birth - Foreign born (%) - White
Place of birth - Foreign born (%) - Black or African American
Place of birth - Foreign born (%) - Asian
Place of birth - Foreign born (%) - Hispanic or Latino
Place of birth - Foreign born (%) - American Indian and Alaska Native
Place of birth - Foreign born (%) - Multirace
Place of birth - Foreign born (%) - Other Race
Residents speaking English at home (%)
Residents speaking English at home - Born in the United States (%)
Residents speaking English at home - Native, born elsewhere (%)
Residents speaking English at home - Foreign born (%)
Residents speaking Spanish at home (%)
Residents speaking Spanish at home - Born in the United States (%)
Residents speaking Spanish at home - Native, born elsewhere (%)
Residents speaking Spanish at home - Foreign born (%)
Residents speaking other language at home (%)
Residents speaking other language at home - Born in the United States (%)
Residents speaking other language at home - Native, born elsewhere (%)
Residents speaking other language at home - Foreign born (%)
Marital status - Never married (%)
Marital status - Now married (%)
Marital status - Separated (%)
Marital status - Widowed (%)
Marital status - Divorced (%)
Ancestries Reported - Arab (%)
Ancestries Reported - Czech (%)
Ancestries Reported - Danish (%)
Ancestries Reported - Dutch (%)
Ancestries Reported - English (%)
Ancestries Reported - French (%)
Ancestries Reported - French Canadian (%)
Ancestries Reported - German (%)
Ancestries Reported - Greek (%)
Ancestries Reported - Hungarian (%)
Ancestries Reported - Irish (%)
Ancestries Reported - Italian (%)
Ancestries Reported - Lithuanian (%)
Ancestries Reported - Norwegian (%)
Ancestries Reported - Polish (%)
Ancestries Reported - Portuguese (%)
Ancestries Reported - Russian (%)
Ancestries Reported - Scotch-Irish (%)
Ancestries Reported - Scottish (%)
Ancestries Reported - Slovak (%)
Ancestries Reported - Subsaharan African (%)
Ancestries Reported - Swedish (%)
Ancestries Reported - Swiss (%)
Ancestries Reported - Ukrainian (%)
Ancestries Reported - United States (%)
Ancestries Reported - Welsh (%)
Ancestries Reported - West Indian (%)
Ancestries Reported - Other (%)
Geographical mobility - Same house 1 year ago (%)
Geographical mobility - Same house 1 year ago (%) - White
Geographical mobility - Same house 1 year ago (%) - Black or African American
Geographical mobility - Same house 1 year ago (%) - Asian
Geographical mobility - Same house 1 year ago (%) - Hispanic or Latino
Geographical mobility - Same house 1 year ago (%) - American Indian and Alaska Native
Geographical mobility - Same house 1 year ago (%) - Multirace
Geographical mobility - Same house 1 year ago (%) - Other Race
Geographical mobility - Moved within same county (%)
Geographical mobility - Moved within same county (%) - White
Geographical mobility - Moved within same county (%) - Black or African American
Geographical mobility - Moved within same county (%) - Asian
Geographical mobility - Moved within same county (%) - Hispanic or Latino
Geographical mobility - Moved within same county (%) - American Indian and Alaska Native
Geographical mobility - Moved within same county (%) - Multirace
Geographical mobility - Moved within same county (%) - Other Race
Geographical mobility - Moved from different county within same state (%)
Geographical mobility - Moved from different county within same state (%) - White
Geographical mobility - Moved from different county within same state (%) - Black or African American
Geographical mobility - Moved from different county within same state (%) - Asian
Geographical mobility - Moved from different county within same state (%) - Hispanic or Latino
Geographical mobility - Moved from different county within same state (%) - American Indian and Alaska Native
Geographical mobility - Moved from different county within same state (%) - Multirace
Geographical mobility - Moved from different county within same state (%) - Other Race
Geographical mobility - Moved from different state (%)
Geographical mobility - Moved from different state (%) - White
Geographical mobility - Moved from different state (%) - Black or African American
Geographical mobility - Moved from different state (%) - Asian
Geographical mobility - Moved from different state (%) - Hispanic or Latino
Geographical mobility - Moved from different state (%) - American Indian and Alaska Native
Geographical mobility - Moved from different state (%) - Multirace
Geographical mobility - Moved from different state (%) - Other Race
Geographical mobility - Moved from abroad (%)
Geographical mobility - Moved from abroad (%) - White
Geographical mobility - Moved from abroad (%) - Black or African American
Geographical mobility - Moved from abroad (%) - Asian
Geographical mobility - Moved from abroad (%) - Hispanic or Latino
Geographical mobility - Moved from abroad (%) - American Indian and Alaska Native
Geographical mobility - Moved from abroad (%) - Multirace
Geographical mobility - Moved from abroad (%) - Other Race
Place of birth for the foreign-born population - Ireland (%)
Place of birth for the foreign-born population - Denmark (%)
Place of birth for the foreign-born population - Norway (%)
Place of birth for the foreign-born population - Sweden (%)
Place of birth for the foreign-born population - United Kingdom (%)
Place of birth for the foreign-born population - England (%)
Place of birth for the foreign-born population - Scotland (%)
Place of birth for the foreign-born population - Other Northern Europe (%)
Place of birth for the foreign-born population - Austria (%)
Place of birth for the foreign-born population - Belgium (%)
Place of birth for the foreign-born population - France (%)
Place of birth for the foreign-born population - Germany (%)
Place of birth for the foreign-born population - Netherlands (%)
Place of birth for the foreign-born population - Switzerland (%)
Place of birth for the foreign-born population - Other Western Europe (%)
Place of birth for the foreign-born population - Greece (%)
Place of birth for the foreign-born population - Italy (%)
Place of birth for the foreign-born population - Portugal (%)
Place of birth for the foreign-born population - Spain (%)
Place of birth for the foreign-born population - Other Southern Europe (%)
Place of birth for the foreign-born population - Albania (%)
Place of birth for the foreign-born population - Belarus (%)
Place of birth for the foreign-born population - Bosnia and Herzegovina (%)
Place of birth for the foreign-born population - Bulgaria (%)
Place of birth for the foreign-born population - Croatia (%)
Place of birth for the foreign-born population - Czechoslovakia (%)
Place of birth for the foreign-born population - Hungary (%)
Place of birth for the foreign-born population - Latvia (%)
Place of birth for the foreign-born population - Lithuania (%)
Place of birth for the foreign-born population - North Macedonia (Macedonia) (%)
Place of birth for the foreign-born population - Moldova (%)
Place of birth for the foreign-born population - Poland (%)
Place of birth for the foreign-born population - Romania (%)
Place of birth for the foreign-born population - Russia (%)
Place of birth for the foreign-born population - Serbia (%)
Place of birth for the foreign-born population - Ukraine (%)
Place of birth for the foreign-born population - Other Eastern Europe (%)
Place of birth for the foreign-born population - China (%)
Place of birth for the foreign-born population - Hong Kong (%)
Place of birth for the foreign-born population - Taiwan (%)
Place of birth for the foreign-born population - Japan (%)
Place of birth for the foreign-born population - Korea (%)
Place of birth for the foreign-born population - Other Eastern Asia (%)
Place of birth for the foreign-born population - Afghanistan (%)
Place of birth for the foreign-born population - Bangladesh (%)
Place of birth for the foreign-born population - India (%)
Place of birth for the foreign-born population - Iran (%)
Place of birth for the foreign-born population - Kazakhstan (%)
Place of birth for the foreign-born population - Nepal (%)
Place of birth for the foreign-born population - Pakistan (%)
Place of birth for the foreign-born population - Sri Lanka (%)
Place of birth for the foreign-born population - Uzbekistan (%)
Place of birth for the foreign-born population - Other South Central Asia (%)
Place of birth for the foreign-born population - Burma (%)
Place of birth for the foreign-born population - Cambodia (%)
Place of birth for the foreign-born population - Indonesia (%)
Place of birth for the foreign-born population - Laos (%)
Place of birth for the foreign-born population - Malaysia (%)
Place of birth for the foreign-born population - Philippines (%)
Place of birth for the foreign-born population - Singapore (%)
Place of birth for the foreign-born population - Thailand (%)
Place of birth for the foreign-born population - Vietnam (%)
Place of birth for the foreign-born population - Other South Eastern Asia (%)
Place of birth for the foreign-born population - Armenia (%)
Place of birth for the foreign-born population - Iraq (%)
Place of birth for the foreign-born population - Israel (%)
Place of birth for the foreign-born population - Jordan (%)
Place of birth for the foreign-born population - Kuwait (%)
Place of birth for the foreign-born population - Lebanon (%)
Place of birth for the foreign-born population - Saudi Arabia (%)
Place of birth for the foreign-born population - Syria (%)
Place of birth for the foreign-born population - Turkey (%)
Place of birth for the foreign-born population - Yemen (%)
Place of birth for the foreign-born population - Other Western Asia (%)
Place of birth for the foreign-born population - Eritrea (%)
Place of birth for the foreign-born population - Ethiopia (%)
Place of birth for the foreign-born population - Kenya (%)
Place of birth for the foreign-born population - Somalia (%)
Place of birth for the foreign-born population - Uganda (%)
Place of birth for the foreign-born population - Zimbabwe (%)
Place of birth for the foreign-born population - Other Eastern Africa (%)
Place of birth for the foreign-born population - Cameroon (%)
Place of birth for the foreign-born population - Congo (%)
Place of birth for the foreign-born population - Democratic Republic of Congo (Zaire) (%)
Place of birth for the foreign-born population - Other Middle Africa (%)
Place of birth for the foreign-born population - Egypt (%)
Place of birth for the foreign-born population - Morocco (%)
Place of birth for the foreign-born population - Sudan (%)
Place of birth for the foreign-born population - Other Northern Africa (%)
Place of birth for the foreign-born population - South Africa (%)
Place of birth for the foreign-born population - Other Southern Africa (%)
Place of birth for the foreign-born population - Cabo Verde (%)
Place of birth for the foreign-born population - Ghana (%)
Place of birth for the foreign-born population - Liberia (%)
Place of birth for the foreign-born population - Nigeria (%)
Place of birth for the foreign-born population - Senegal (%)
Place of birth for the foreign-born population - Sierra Leone (%)
Place of birth for the foreign-born population - Other Western Africa (%)
Place of birth for the foreign-born population - Australia (%)
Place of birth for the foreign-born population - New Zealand (%)
Place of birth for the foreign-born population - Fiji (%)
Place of birth for the foreign-born population - Micronesia (%)
Place of birth for the foreign-born population - Bahamas (%)
Place of birth for the foreign-born population - Barbados (%)
Place of birth for the foreign-born population - Cuba (%)
Place of birth for the foreign-born population - Dominica (%)
Place of birth for the foreign-born population - Dominican Republic (%)
Place of birth for the foreign-born population - Grenada (%)
Place of birth for the foreign-born population - Haiti (%)
Place of birth for the foreign-born population - Jamaica (%)
Place of birth for the foreign-born population - St. Vincent and the Grenadines (%)
Place of birth for the foreign-born population - Trinidad and Tobago (%)
Place of birth for the foreign-born population - West Indies (%)
Place of birth for the foreign-born population - Other Caribbean (%)
Place of birth for the foreign-born population - Belize (%)
Place of birth for the foreign-born population - Costa Rica (%)
Place of birth for the foreign-born population - El Salvador (%)
Place of birth for the foreign-born population - Guatemala (%)
Place of birth for the foreign-born population - Honduras (%)
Place of birth for the foreign-born population - Mexico (%)
Place of birth for the foreign-born population - Nicaragua (%)
Place of birth for the foreign-born population - Panama (%)
Place of birth for the foreign-born population - Other Central America (%)
Place of birth for the foreign-born population - Argentina (%)
Place of birth for the foreign-born population - Bolivia (%)
Place of birth for the foreign-born population - Brazil (%)
Place of birth for the foreign-born population - Chile (%)
Place of birth for the foreign-born population - Colombia (%)
Place of birth for the foreign-born population - Ecuador (%)
Place of birth for the foreign-born population - Guyana (%)
Place of birth for the foreign-born population - Peru (%)
Place of birth for the foreign-born population - Uruguay (%)
Place of birth for the foreign-born population - Venezuela (%)
Place of birth for the foreign-born population - Other South America (%)
Place of birth for the foreign-born population - Canada (%)
Place of birth for the foreign-born population - Other Northern America (%)
Place of birth for the foreign-born population - Other (%)
Latest news about races in Bristol, CT collected exclusively by city-data.com from local newspapers, TV, and radio stations
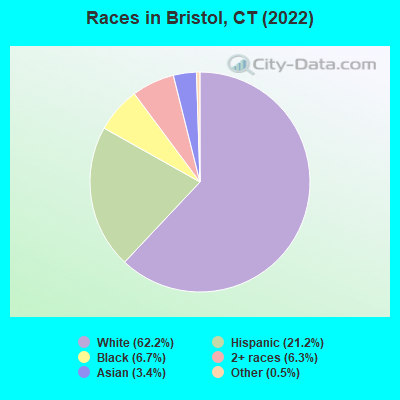
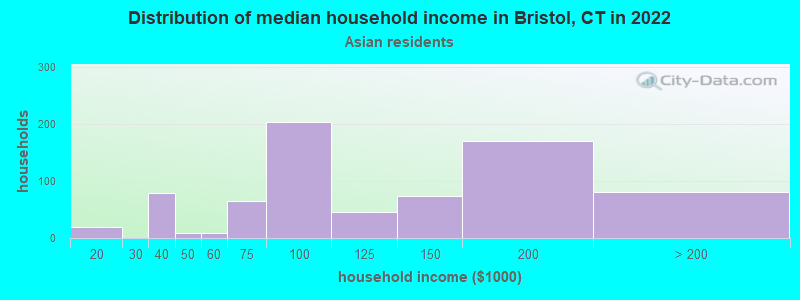
According to 2022 data, the most numerous races in Bristol, CT are White alone (38,161 residents), Hispanic (12,995 residents), and Black alone (4,132 residents). 78.1% of Bristol residents speak English at home. 9.7% of Bristol, CT residents are foreign-born (4.0% born in Latin America, 2.3% born in Asia, 2.1% born in Europe), which is 53.9% less than the foreign-born rate of 15.0% across the entire state of Connecticut.
Race distribution in Bristol
2000 2022
2,638,845 77.5% White alone 320,323 9.4% Hispanic 295,571 8.7% Black alone 81,564 2.4% Asian alone 52,896 1.6% Two or more races 8,141 0.2% Other race alone 7,267 0.2% American Indian alone 958 0.03% Native Hawaiian and Other
2,246,913 62.0% White alone 658,978 18.2% Hispanic 353,973 9.8% Black alone 172,929 4.8% Asian alone 159,631 4.4% Two or more races 29,761 0.8% Other race alone 3,428 0.09% American Indian alone 592 0.02% Native Hawaiian and Other
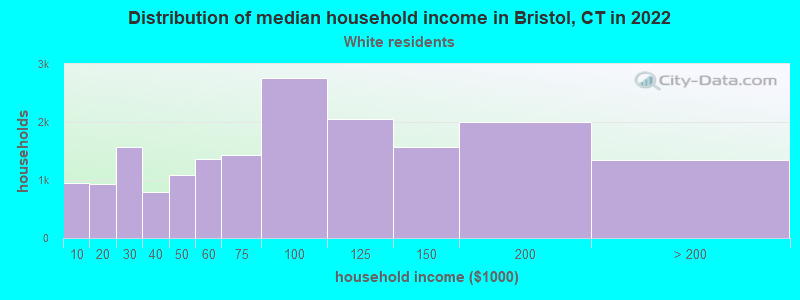
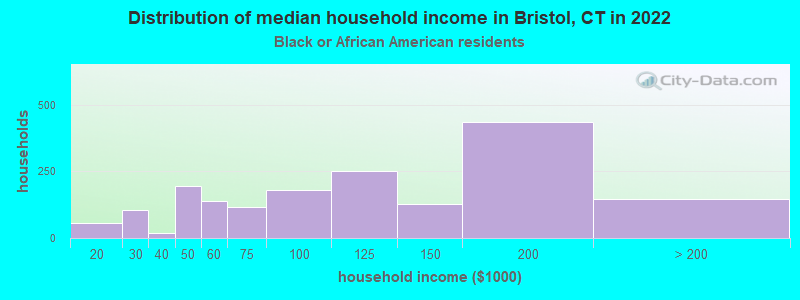
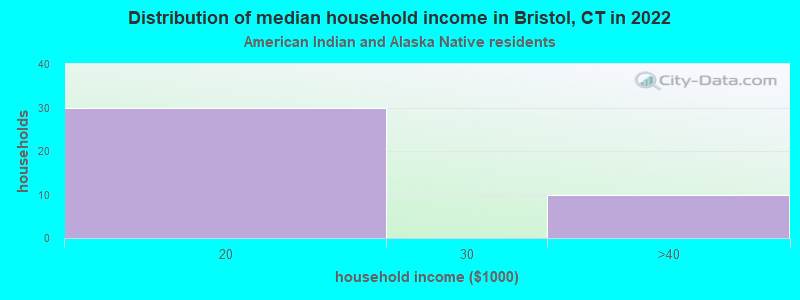
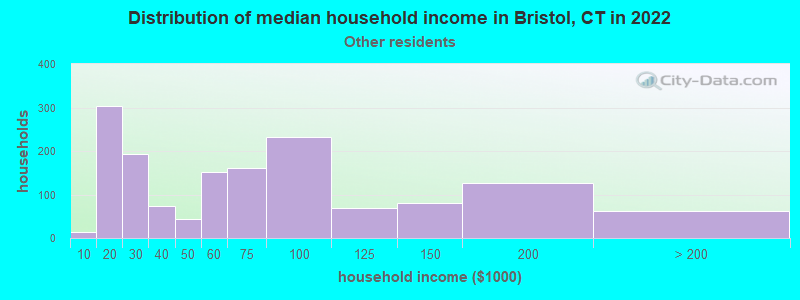
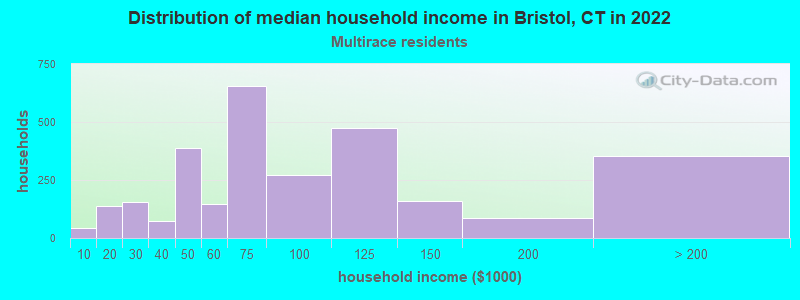
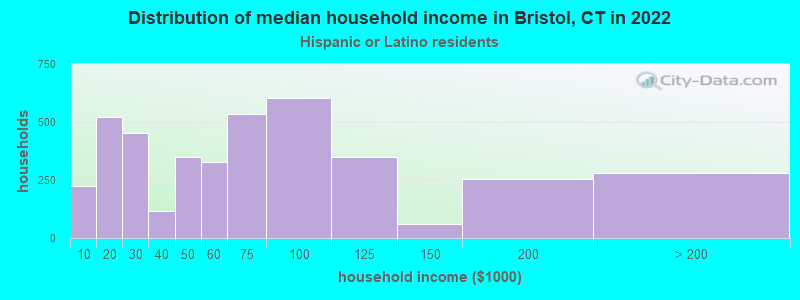
Income and house value in Bristol Median household income in 2022 $84,918 White non-Hispanic householders$114,468 Black householders$16,876 American Indian and Alaska Native householders$93,990 Asian householders$66,549 Some other race householders$76,718 Two or more races householders$62,795 Hispanic or Latino race householdersMedian 2022 house value $265,073 White Non-Hispanic householders$229,308 Black or African American householders$214,593 American Indian or Alaska Native householders $265,482 Asian householders$242,797 Some other race householders$222,155 Two or more races householders$271,000 Hispanic or Latino householders
Median age by race in Bristol
44.6 Median age for White residents43.2 46.3 33.8 Median age for Black or African American residents31.7 33.9 37.4 Median age for American Indian / Alaska Native residents-701,030,927.1 35.4 36.8 Median age for Asian residents26.6 38.2 -641,269,840.6 Median age for Native Hawaiian / Pacific Islander residents-414,239,481.8 -691,588,784.4 30.6 Median age for Other race residents30.3 31.1 24.4 Median age for Two or more races residents26.9 15.3 46.6 Median age for White alone residents44.5 48.7 26.8 Median age for Hispanic or Latino residents27.5 24.5
Owner/renter occupied households by race in Bristol
House owners and renters - White residents 12,134 68.7% Owner occupied5,533 31.3% Renter occupiedHouse owners and renters - Black or African American residents 1,134 62.5% Owner occupied680 37.5% Renter occupiedHouse owners and renters - American Indian / Alaska Native residents 38 100.0% Renter occupiedHouse owners and renters - Asian residents 637 83.0% Owner occupied131 17.0% Renter occupiedHouse owners and renters - Other race residents 640 39.8% Owner occupied967 60.2% Renter occupiedHouse owners and renters - Two or more races residents 1,630 56.9% Owner occupied1,236 43.1% Renter occupiedHouse owners and renters - White alone residents 11,832 70.0% Owner occupied5,083 30.0% Renter occupiedHouse owners and renters - Hispanic or Latino residents 1,744 42.0% Owner occupied2,406 58.0% Renter occupied
Language usage in Bristol
English speakers - Total 78.1% of residents of Bristol speak English at home.
13.1% of residents speak Spanish at home 4,549 59.4% Speak English very well3,108 40.6% Speak English less than very well8.8% of residents speak other language at home 3,811 73.8% Speak English very well1,350 26.2% Speak English less than very well
English speakers - Born in the United States 82.3% of residents of Bristol speak English at home.
12.4% of residents speak Spanish at home 1,189 87.7% Speak English very well167 12.3% Speak English less than very well5.9% of residents speak other language at home 558 87.2% Speak English very well82 12.8% Speak English less than very well
English speakers - Native, born elsewhere 19.6% of residents of Bristol speak English at home.
72.9% of residents speak Spanish at home 1,535 50.9% Speak English very well1,479 49.1% Speak English less than very well6.5% of residents speak other language at home 269 100.0% Speak English very well
English speakers - Foreign-born 25.2% of residents of Bristol speak English at home.
25.8% of residents speak Spanish at home 480 31.1% Speak English very well1,061 68.9% Speak English less than very well48.8% of residents speak other language at home 1,748 60.0% Speak English very well1,164 40.0% Speak English less than very well
White (Caucasian) - Speak only English Native:
93.8% (35,022)Foreign-born:
31.2% (581)
White (Caucasian) - Speak another language Native:
6.1% (2,271)Foreign-born:
68.8% (1,282)
Black or African American - Speak only English Native:
91.6% (3,302)Foreign-born:
49.6% (379)
Black or African American - Speak another language Native:
8.4% (302)Foreign-born:
46.3% (353)
Asian - Speak only English Native:
37.7% (282)Foreign-born:
20.2% (286)
Asian - Speak another language Native:
61.5% (460)Foreign-born:
79.5% (1,126)
Other race - Speak only English Native:
32.5% (1,165)Foreign-born:
10.7% (83)
Other race - Speak another language Native:
67.1% (2,407)Foreign-born:
88.6% (691)
Two or more races - Speak only English Native:
58.6% (4,586)Foreign-born:
10.8% (117)
Two or more races - Speak another language Native:
42.1% (3,296)Foreign-born:
88.3% (954)
White alone - Speak only English Native:
95.9% (33,999)Foreign-born:
32.7% (533)
White alone - Speak another language Native:
4.1% (1,465)Foreign-born:
67.3% (1,097)
Hispanic or Latino - Speak only English Native:
42.6% (4,266)Foreign-born:
10.6% (185)
Hispanic or Latino - Speak another language Native:
57.4% (5,753)Foreign-born:
88.4% (1,542)
Foreign-born residents in Bristol 5,976 residents are foreign born (4.0% Latin America , 2.3% Asia , 2.1% Europe ).
This city:
9.7%Connecticut:
15.0%
Marital status for residents in Bristol Marital status - White (Caucasian) population 15 years and over
Males 37.7% Never married46.3% Now married0.8% Separated3.7% Widowed11.5% DivorcedFemales 29.0% Never married45.3% Now married1.4% Separated9.3% Widowed15.1% DivorcedWomen who gave birth in the past 12 months Now married:
74.6% (291)Unmarried:
25.4% (99)
Women who did not give birth in the past 12 months Now married:
42.9% (3,691)Unmarried:
57.1% (4,920)
Marital status - Black or African American population 15 years and over
Males 45.3% Never married44.1% Now married0.8% Separated0.4% Widowed9.4% DivorcedFemales 43.4% Never married32.8% Now married1.5% Separated3.2% Widowed19.1% DivorcedWomen who did not give birth in the past 12 months Now married:
42.5% (472)Unmarried:
57.5% (639)
Marital status - American Indian / Alaska Native population 15 years and over
Males 43.5% Never married0.0% Now married0.0% Separated0.0% Widowed56.5% DivorcedFemales 79.0% Never married21.0% Now married0.0% Separated0.0% Widowed0.0% DivorcedWomen who gave birth in the past 12 months Now married:
100.0% (14)Unmarried:
0.0% (0)
Women who did not give birth in the past 12 months Now married:
8.8% (8)Unmarried:
91.2% (83)
Marital status - Asian population 15 years and over
Males 44.3% Never married53.8% Now married0.0% Separated0.0% Widowed1.8% DivorcedFemales 36.9% Never married51.5% Now married0.0% Separated10.6% Widowed1.0% DivorcedWomen who gave birth in the past 12 months Now married:
100.0% (12)Unmarried:
0.0% (0)
Women who did not give birth in the past 12 months Now married:
50.7% (378)Unmarried:
49.3% (367)
Marital status - Other race population 15 years and over
Males 41.5% Never married43.3% Now married4.3% Separated1.9% Widowed9.0% DivorcedFemales 43.4% Never married42.5% Now married0.0% Separated3.9% Widowed10.2% DivorcedWomen who gave birth in the past 12 months Now married:
100.0% (39)Unmarried:
0.0% (0)
Women who did not give birth in the past 12 months Now married:
39.2% (547)Unmarried:
60.8% (847)
Marital status - Two or more races population 15 years and over
Males 54.8% Never married36.3% Now married1.2% Separated0.0% Widowed7.7% DivorcedFemales 38.8% Never married32.0% Now married2.6% Separated3.6% Widowed23.0% DivorcedWomen who gave birth in the past 12 months Now married:
24.1% (11)Unmarried:
75.9% (34)
Women who did not give birth in the past 12 months Now married:
31.3% (581)Unmarried:
68.7% (1,273)
Marital status - White alone, not Hispanic / Latino population 15 years and over
Males 36.5% Never married46.8% Now married0.9% Separated3.9% Widowed11.9% DivorcedFemales 27.1% Never married46.0% Now married1.3% Separated10.0% Widowed15.6% DivorcedWomen who gave birth in the past 12 months Now married:
74.4% (284)Unmarried:
25.6% (98)
Women who did not give birth in the past 12 months Now married:
44.1% (3,474)Unmarried:
55.9% (4,406)
Marital status - Hispanic or Latino population 15 years and over
Males 50.0% Never married38.9% Now married1.7% Separated0.8% Widowed8.5% DivorcedFemales 45.2% Never married36.6% Now married1.3% Separated2.8% Widowed14.1% DivorcedWomen who gave birth in the past 12 months Now married:
72.4% (80)Unmarried:
27.6% (30)
Women who did not give birth in the past 12 months Now married:
34.7% (1,158)Unmarried:
65.3% (2,175)
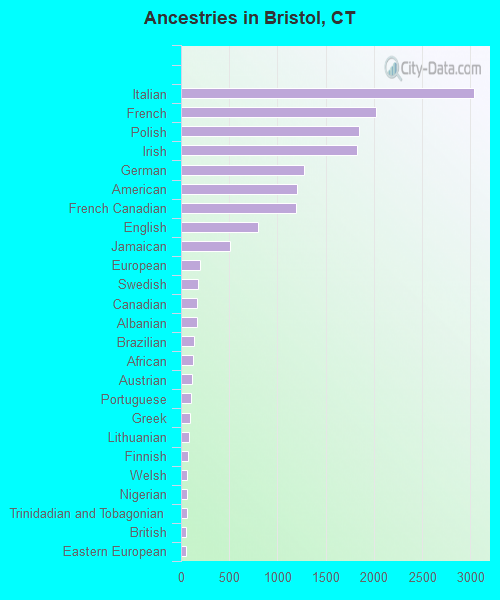
Ancestries in Bristol
3,042 11.2% Italian2,019 7.4% French1,847 6.8% Polish1,821 6.7% Irish1,273 4.7% German1,199 4.4% American1,197 4.4% French Canadian801 3.0% English513 1.9% Jamaican193 0.7% European175 0.6% Swedish163 0.6% Canadian161 0.6% Albanian132 0.5% Brazilian127 0.5% African113 0.4% Austrian106 0.4% Portuguese94 0.3% Greek88 0.3% Lithuanian75 0.3% Finnish63 0.2% Welsh62 0.2% Nigerian59 0.2% Trinidadian and Tobagonian56 0.2% British49 0.2% Eastern European45 0.2% Cape Verdean45 0.2% Scandinavian43 0.2% Scotch-Irish42 0.2% Scottish35 0.1% Belgian24 0.09% Lebanese19 0.07% Slovak18 0.07% Iranian17 0.06% Moroccan14 0.05% Armenian13 0.05% Bulgarian13 0.05% Dutch12 0.04% Russian12 0.04% Haitian10 0.04% British West Indian9 0.03% Czech9 0.03% Romanian9 0.03% Danish8 0.03% West Indian7 0.03% Hungarian7 0.03% Czechoslovakian6 0.02% Celtic5 0.02% Yugoslavian
Geographical mobility in Bristol Same house 1 year ago 35,843 89.3% White (Caucasian)3,834 83.7% Black or African American127 87.4% American Indian / Alaska Native1,921 89.2% Asian16 100.0% Native Hawaiian / Pacific Islander4,515 96.9% Other race8,268 84.6% Two or more races33,909 89.5% White alone, not Hispanic / Latino11,389 88.5% Hispanic or LatinoMoved within same county 1,932 4.8% White / Caucasian224 4.9% Black or African American8 5.7% American Indian / Alaska Native109 5.0% Asian104 2.2% Other race744 7.6% Two or more races1,896 5.0% White alone, not Hispanic / Latino550 4.3% Hispanic or LatinoMoved within same state 949 2.4% White / Caucasian278 6.1% Black or African American60 2.8% Asian85 1.8% Other race456 4.7% Two or more races886 2.3% White alone, not Hispanic / Latino508 3.9% Hispanic or LatinoMoved from different state 1,199 3.0% White / Caucasian243 5.3% Black or African American30 1.4% Asian11 0.2% Other race172 1.8% Two or more races909 2.4% White alone, not Hispanic / Latino451 3.5% Hispanic or LatinoMoved from abroad 69 0.2% White9 0.2% Black or African American86 0.9% Two or more races74 0.2% White alone, not Hispanic / Latino49 0.4% Hispanic or Latino
Children Nativity (place of birth) in Bristol
Children under 6 years - Living with two parents Both parents native 1,581 100.0% NativeBoth parents foreign-born 231 100.0% NativeOne native, one foreign-born parent 464 100.0% NativeChildren under 6 years - Living with one parent Native parent 963 100.0% NativeForeign-born parent 220 100.0% NativeChildren 6 to 17 years - Living with two parents Both parents native 4,210 98.5% Native66 1.5% Foreign-bornBoth parents foreign-born 706 93.2% Native51 6.8% Foreign-bornOne native, one foreign-born parent 478 100.0% NativeChildren 6 to 17 years - Living with one parent Native parent 2,964 100.0% NativeForeign-born parent 176 56.1% Native138 43.9% Foreign-born
Grandparents responsible for own grandchildren in Bristol
Grandparents (30 to 59 years) White / Caucasian 40 23.8% Responsible for grandchildren128 76.2% Not responsible for grandchildrenTwo or more races 36 45.7% Responsible for grandchildren43 54.3% Not responsible for grandchildrenWhite alone, not Hispanic / Latino 45 31.9% Responsible for grandchildren97 68.1% Not responsible for grandchildrenHispanic or Latino 16 14.2% Responsible for grandchildren98 85.8% Not responsible for grandchildrenGrandparents (60 years and over) White / Caucasian 37 7.5% Responsible for grandchildren459 92.5% Not responsible for grandchildrenTwo or more races 25 100.0% Not responsible for grandchildrenWhite alone, not Hispanic / Latino 39 7.5% Responsible for grandchildren484 92.5% Not responsible for grandchildren