Races in Bristol, Rhode Island (RI) Detailed Stats
Ancestries, Foreign-born residents, place of birth

Recent posts about races in Bristol, Rhode Island on our local forum with over 2,400,000 registered users:
 | "Woonsocket Man" (Rocket Man parody) (514 replies) |
| House buyers flooding in from MA & NYC (90 replies) |
| RI Real Estate in huge demand (147 replies) |
| Boston (more than ever) Drives RI's housing market - Up (239 replies) |
| Bristol Library Drag Queen Story Hour Reinstated (13 replies) |
| Crazy Rhode Island real estate market (525 replies) |
Latest news about races in Bristol, RI collected exclusively by city-data.com from local newspapers, TV, and radio stations
13.9% of Bristol, RI residents are foreign-born (12.4% born in Europe), which is about the same as the foreign-born rate of 14.0% across the entire state of Rhode Island.
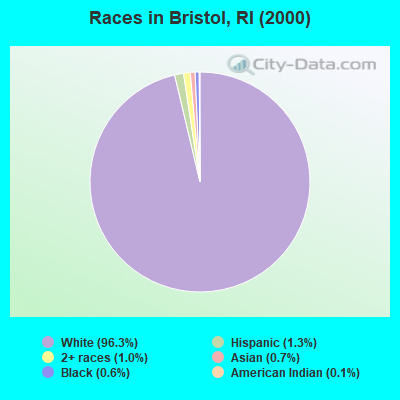
Race distribution in Bristol

- 21,62896.3%White alone
- 2891.3%Hispanic
- 2161.0%Two or more races
- 1470.7%Asian alone
- 1320.6%Black alone
- 320.1%American Indian alone
- 150.07%Other race alone
- 100.04%Native Hawaiian and Other
Pacific Islander alone
2000
2022
-
- 858,43381.9%White alone
- 90,8208.7%Hispanic
- 41,9224.0%Black alone
- 23,4162.2%Asian alone
- 20,8162.0%Two or more races
- 8,4110.8%Other race alone
- 4,1810.4%American Indian alone
- 3200.03%Native Hawaiian and Other
Pacific Islander alone

-
- 745,82568.2%White alone
- 191,97917.6%Hispanic
- 56,7385.2%Two or more races
- 51,3264.7%Black alone
- 37,2343.4%Asian alone
- 9,5140.9%Other race alone
- 9780.09%American Indian alone
- 1400.01%Native Hawaiian and Other
Pacific Islander alone

Income and house value in Bristol
- Median household income in 2022
- $84,859White non-Hispanic householders
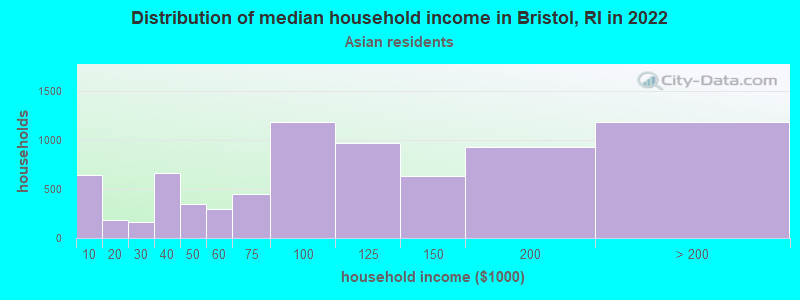
- $58,358Asian householders
- $25,161Some other race householders
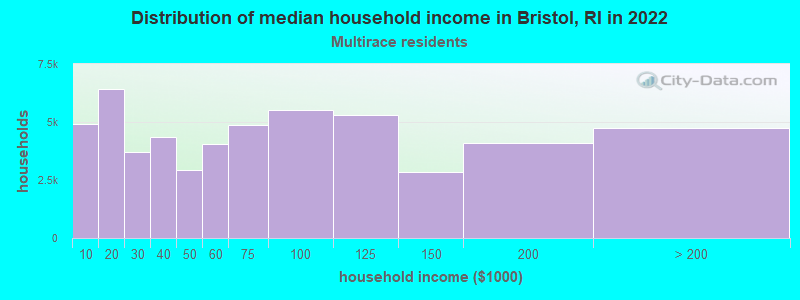
- $84,405Two or more races householders
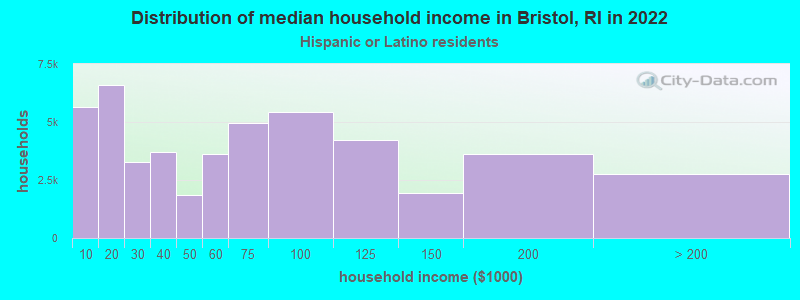
- $45,525Hispanic or Latino race householders
- Median 2022 house value
- $477,636White Non-Hispanic householders
- $417,514Black or African American householders
- over $1,000,000Asian householders
- $417,514Some other race householders
- $371,967Two or more races householders
- $463,061Hispanic or Latino householders
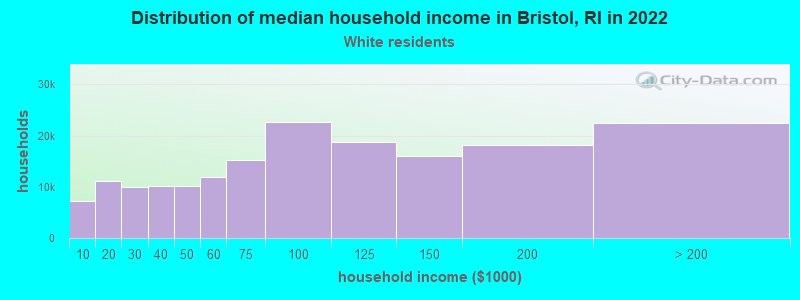
Household income for White non-Hispanic householders
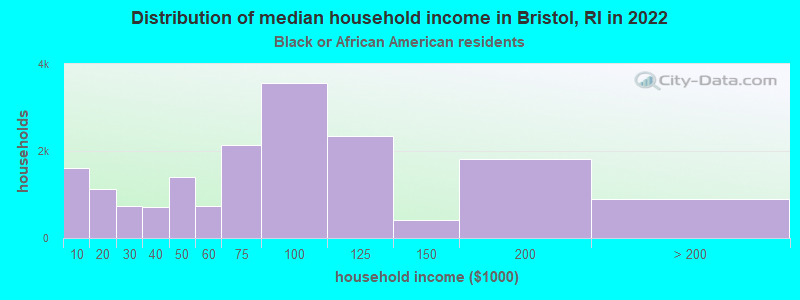
Household income for Black householders
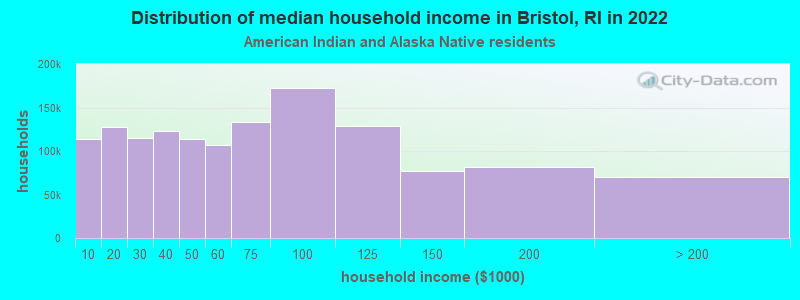
Household income for American Indian and Alaska Native householders
Household income for Asian householders
Household income for Two or more races householders
Household income for Hispanic or Latino race householders
Foreign-born residents in Bristol
3,131 residents are foreign born (12.4% Europe).
| This city: | 13.9% |
| Rhode Island: | 11.4% |
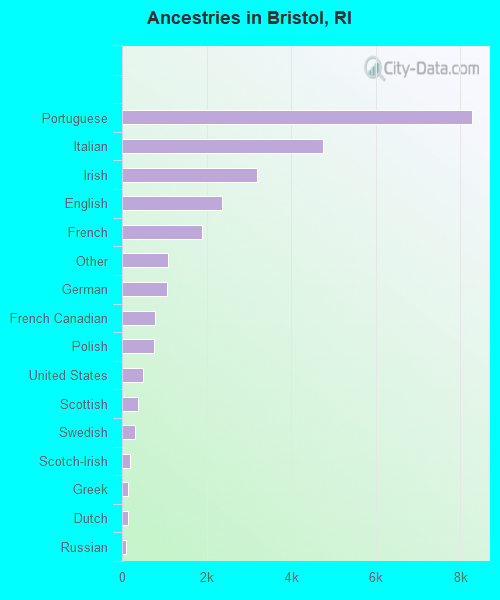
Ancestries in Bristol

- 8,26631.4%Portuguese
- 4,75818.1%Italian
- 3,19512.1%Irish
- 2,3659.0%English
- 1,9037.2%French
- 1,0864.1%Other
- 1,0744.1%German
- 7742.9%French Canadian
- 7552.9%Polish
- 5001.9%United States
- 3771.4%Scottish
- 2981.1%Swedish
- 1780.7%Scotch-Irish
- 1460.6%Greek
- 1370.5%Dutch
- 1020.4%Russian
- 620.2%Norwegian
- 590.2%Hungarian
- 480.2%Lithuanian
- 450.2%Ukrainian
- 390.1%Welsh
- 380.1%Danish
- 380.1%Subsaharan African
- 330.1%Arab
- 170.06%Swiss
- 160.06%Czech
- 140.05%West Indian
Zip codes: 02809.