Races in Brittany Farms-Highlands, Pennsylvania (PA) Detailed Stats
Ancestries, Foreign-born residents, place of birth

Discuss Brittany Farms-Highlands, Pennsylvania races on our local forum with over 2,400,000 registered users
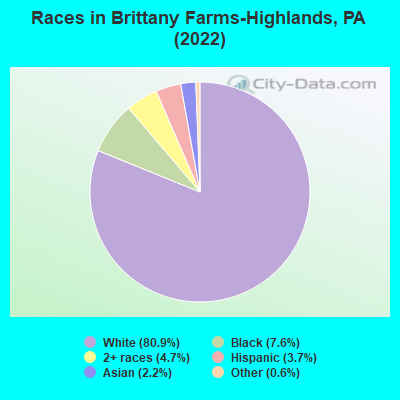
According to 2022 data, the most numerous races in Brittany Farms-Highlands, PA are White alone (3,465 residents), Black alone (324 residents), and Hispanic (160 residents). 93.4% of Brittany Farms-Highlands residents speak English at home. 6.5% of Brittany Farms-Highlands, PA residents are foreign-born (2.7% born in Latin America, 1.4% born in Europe, 1.2% born in Asia, 0.8% born in Oceania), which is 7.1% less than the foreign-born rate of 7.0% across the entire state of Pennsylvania.
Race distribution in Brittany Farms-Highlands

2000
2022

- 10,322,45584.1%White alone
- 1,202,4379.8%Black alone
- 394,0883.2%Hispanic
- 218,2961.8%Asian alone
- 113,0970.9%Two or more races
- 13,0860.1%Other race alone
- 14,9040.1%American Indian alone
- 2,6910.02%Native Hawaiian and Other
Pacific Islander alone

-
- 9,487,22873.1%White alone
- 1,311,58110.1%Black alone
- 1,115,9978.6%Hispanic
- 493,9423.8%Two or more races
- 487,1243.8%Asian alone
- 63,5820.5%Other race alone
- 10,1300.08%American Indian alone
- 2,4240.02%Native Hawaiian and Other
Pacific Islander alone

Income and house value in Brittany Farms-Highlands
- Median household income in 2022
- $91,985White non-Hispanic householders
- $127,637Black householders
- $147,142Asian householders
- Median 2022 house value
- $405,628White Non-Hispanic householders
- $489,416Two or more races householders
- $652,554Hispanic or Latino householders
Household income for White non-Hispanic householders

Household income for Black householders

Household income for Asian householders

Household income for Two or more races householders

Household income for Hispanic or Latino race householders

Median age by race in Brittany Farms-Highlands
- 47.5Median age for White residents
- 45.9Males
- 50.9Females
- 61.9Median age for Black or African American residents
- 60.2Males
- 62.4Females
- -674,382,715.4Median age for American Indian / Alaska Native residents
- -668,138,336.3Males
- -858,283,432.3Females
- 25.4Median age for Asian residents
- 25.5Males
- 40.5Females
- -680,432,644.4Median age for Native Hawaiian / Pacific Islander residents
- -649,523,808.9Males
- -747,474,746.7Females
- 41.8Median age for Other race residents
- -598,837,208.7Males
- -595,103,577.6Females
- 11.3Median age for Two or more races residents
- 9.7Males
- 19.9Females
- 47.6Median age for White alone residents
- 45.7Males
- 51.0Females
- 33.4Median age for Hispanic or Latino residents
- 35.2Males
- -655,629,138.4Females
Owner/renter occupied households by race in Brittany Farms-Highlands
- House owners and renters - White residents
- 1,14070.7%Owner occupied
- 47229.3%Renter occupied
- House owners and renters - Black or African American residents
- 7684.6%Owner occupied
- 1415.4%Renter occupied
- House owners and renters - Asian residents
- 25100.0%Owner occupied
- House owners and renters - Two or more races residents
- 1638.6%Owner occupied
- 2661.4%Renter occupied
- House owners and renters - White alone residents
- 1,13870.5%Owner occupied
- 47729.5%Renter occupied
- House owners and renters - Hispanic or Latino residents
- 1265.3%Owner occupied
- 634.7%Renter occupied
Language usage in Brittany Farms-Highlands
- English speakers - Total
- 93.4% of residents of Brittany Farms-Highlands speak English at home.
- 2.2% of residents speak Spanish at home
- 7074.5%Speak English very well
- 2425.5%Speak English less than very well
- 4.1% of residents speak other language at home
- 9656.1%Speak English very well
- 7543.9%Speak English less than very well
- English speakers - Born in the United States
- 99.9% of residents of Brittany Farms-Highlands speak English at home.
- 0.6% of residents speak other language at home
- 6100.0%Speak English very well
- English speakers - Native, born elsewhere
- 0.0% of residents of Brittany Farms-Highlands speak English at home.
- 69.2% of residents speak Spanish at home
- 1451.9%Speak English very well
- 1348.1%Speak English less than very well
- English speakers - Foreign-born
- 58.8% of residents of Brittany Farms-Highlands speak English at home.
- 37.6% of residents speak other language at home
- 3028.6%Speak English very well
- 7571.4%Speak English less than very well
White (Caucasian) - Speak only English
| Native: | 97.6% (3,253) |
| Foreign-born: | 39.3% (34) |
White (Caucasian) - Speak another language
| Native: | 2.4% (79) |
| Foreign-born: | 60.1% (52) |
Black or African American - Speak only English
| Native: | 98.7% (212) |
| Foreign-born: | 63.6% (70) |
Asian - Speak only English
| Native: | 51.1% (17) |
| Foreign-born: | 32.2% (19) |
Asian - Speak another language
| Native: | 48.9% (16) |
| Foreign-born: | 68.2% (41) |
White alone - Speak only English
| Native: | 98.3% (3,261) |
| Foreign-born: | 37.4% (34) |
White alone - Speak another language
| Native: | 1.8% (59) |
| Foreign-born: | 61.1% (56) |
Foreign-born residents in Brittany Farms-Highlands
280 residents are foreign born (2.7% Latin America, 1.4% Europe, 1.2% Asia, 0.8% Oceania).
| This city: | 6.5% |
| Pennsylvania: | 7.3% |


Marital status for residents in Brittany Farms-Highlands
Marital status - White (Caucasian) population 15 years and over
- Males
- 29.7%Never married
- 57.2%Now married
- 0.8%Separated
- 0.0%Widowed
- 12.4%Divorced
- Females
- 23.4%Never married
- 49.9%Now married
- 0.3%Separated
- 11.1%Widowed
- 15.4%Divorced
Women who did not give birth in the past 12 months
| Now married: | 49.9% (375) |
| Unmarried: | 50.1% (377) |
Marital status - Black or African American population 15 years and over
- Males
- 28.6%Never married
- 26.2%Now married
- 0.0%Separated
- 0.0%Widowed
- 45.2%Divorced
- Females
- 46.0%Never married
- 11.9%Now married
- 0.0%Separated
- 13.4%Widowed
- 28.7%Divorced
Women who did not give birth in the past 12 months
| Now married: | 0.0% (0) |
| Unmarried: | 100.0% (89) |
Marital status - Asian population 15 years and over
- Males
- 48.4%Never married
- 51.6%Now married
- 0.0%Separated
- 0.0%Widowed
- 0.0%Divorced
- Females
- 34.2%Never married
- 47.4%Now married
- 0.0%Separated
- 0.0%Widowed
- 18.4%Divorced
Women who did not give birth in the past 12 months
| Now married: | 47.4% (19) |
| Unmarried: | 52.6% (21) |
Marital status - Two or more races population 15 years and over
- Males
- 21.8%Never married
- 78.2%Now married
- 0.0%Separated
- 0.0%Widowed
- 0.0%Divorced
- Females
- 31.2%Never married
- 68.8%Now married
- 0.0%Separated
- 0.0%Widowed
- 0.0%Divorced
Women who did not give birth in the past 12 months
| Now married: | 66.7% (37) |
| Unmarried: | 33.3% (18) |
Marital status - White alone, not Hispanic / Latino population 15 years and over
- Males
- 30.1%Never married
- 56.6%Now married
- 0.8%Separated
- 0.0%Widowed
- 12.6%Divorced
- Females
- 23.1%Never married
- 49.9%Now married
- 0.3%Separated
- 11.2%Widowed
- 15.5%Divorced
Women who did not give birth in the past 12 months
| Now married: | 49.9% (372) |
| Unmarried: | 50.1% (373) |
Marital status - Hispanic or Latino population 15 years and over
- Males
- 0.0%Never married
- 100.0%Now married
- 0.0%Separated
- 0.0%Widowed
- 0.0%Divorced
- Females
- 53.3%Never married
- 46.7%Now married
- 0.0%Separated
- 0.0%Widowed
- 0.0%Divorced
Women who did not give birth in the past 12 months
| Now married: | 46.7% (8) |
| Unmarried: | 53.3% (9) |
Ancestries in Brittany Farms-Highlands

- 38120.4%Irish
- 27514.7%Italian
- 23112.4%German
- 1729.2%American
- 1276.8%English
- 512.7%Lebanese
- 281.5%Polish
- 251.3%Eastern European
- 211.1%Scottish
- 160.9%Austrian
- 100.5%Pennsylvania German
- 100.5%Slovak
- 90.5%European
- 80.4%Greek
- 70.4%Hungarian
- 70.4%Swedish
- 60.3%Dutch
- 60.3%Northern European
- 50.3%Canadian
- 50.3%French
- 50.3%Scandinavian

Geographical mobility in Brittany Farms-Highlands

- Same house 1 year ago
- 3,16891.2%White (Caucasian)
- 32196.2%Black or African American
- 9398.8%Asian
- 50100.0%Other race
- 29197.4%Two or more races
- 3,15290.8%White alone, not Hispanic / Latino
- 164100.0%Hispanic or Latino

-
- Moved within same county
- 1404.0%White / Caucasian
- 1454.2%White alone, not Hispanic / Latino

-
- Moved within same state
- 1163.3%White / Caucasian
- 92.7%Black or African American
- 51.5%Two or more races
- 1193.4%White alone, not Hispanic / Latino

-
- Moved from different state
- 541.6%White / Caucasian
- 581.7%White alone, not Hispanic / Latino

Children Nativity (place of birth) in Brittany Farms-Highlands
Place of birth for residents in Brittany Farms-Highlands
![Place of birth for the foreign-born population - Regions]()
- 126Americas
- 119Latin America
- 119Caribbean
- 62Europe
- 56Asia
- 48Eastern Asia
- 38Western Europe
- 35Oceania
- 35Australia and New Zealand Subregion
- 20China
- 16Southern Europe
- 7Eastern Europe
- 7South Eastern Asia
- 7Northern America

![Place of birth for the foreign-born population - Countries]()
- 119Trinidad and Tobago
- 38Germany
- 35Australia
- 28Korea
- 20Taiwan
- 16Italy
- 7Poland
- 7Malaysia
- 7Canada

Grandparents responsible for own grandchildren in Brittany Farms-Highlands
Zip codes: 18914.