Races in Brittons Neck, South Carolina (SC) Detailed Stats
Ancestries, Foreign-born residents, place of birth
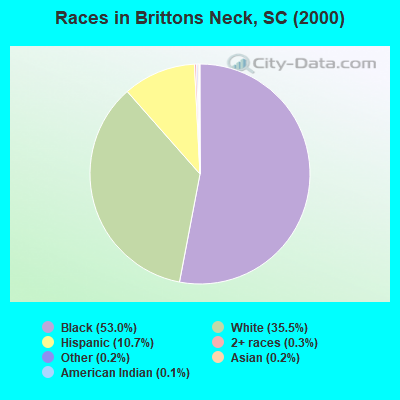
Race distribution in Brittons Neck

- 1,34453.0%Black alone
- 90135.5%White alone
- 27210.7%Hispanic
- 70.3%Two or more races
- 40.2%Asian alone
- 50.2%Other race alone
- 30.1%American Indian alone
- 10.04%Native Hawaiian and Other
Pacific Islander alone
2000
2022
-
- 2,652,29166.1%White alone
- 1,178,48629.4%Black alone
- 95,0762.4%Hispanic
- 35,5680.9%Asian alone
- 33,2900.8%Two or more races
- 12,7650.3%American Indian alone
- 3,2660.08%Other race alone
- 1,2700.03%Native Hawaiian and Other
Pacific Islander alone

-
- 3,301,73962.5%White alone
- 1,313,29024.9%Black alone
- 343,7836.5%Hispanic
- 190,5083.6%Two or more races
- 89,8881.7%Asian alone
- 29,3900.6%Other race alone
- 12,1120.2%American Indian alone
- 1,9240.04%Native Hawaiian and Other
Pacific Islander alone

Income and house value in Brittons Neck
- Median household income in 2022
- $51,239White non-Hispanic householders
- $36,139Black householders
- $106,305Some other race householders
- $101,862Two or more races householders
- $98,998Hispanic or Latino race householders
- Median 2022 house value
- $113,289White Non-Hispanic householders
- $100,298Black or African American householders
- $124,178Some other race householders
- $124,178Two or more races householders
- $130,483Hispanic or Latino householders
Household income for White non-Hispanic householders

Household income for Black householders

Household income for Two or more races householders

Household income for Hispanic or Latino race householders

Zip code: 29546