Races in Broadview Heights, Ohio (OH) Detailed Stats
Ancestries, Foreign-born residents, place of birth
Settings
X


Recent posts about races in Broadview Heights, Ohio on our local forum with over 2,400,000 registered users:
 | Asian moving to Broadview Heights (15 replies) |
| Thinking of Ohio as option to move from NY (16 replies) |
| How to attract more young educated people? (139 replies) |
| Ohio City vs Downtown (9 replies) |
| Asians on the receiving end of racism in Greater Cleveland? (17 replies) |
| Asian Indians in Cleveland, Akron, Canton, Ohio (13 replies) |
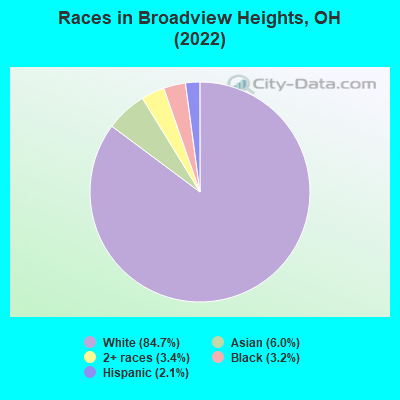
According to 2022 data, the most numerous races in Broadview Heights, OH are White alone (16,503 residents), Black alone (619 residents), and Two or more races (669 residents). 89.4% of Broadview Heights residents speak English at home. 10.1% of Broadview Heights, OH residents are foreign-born (4.8% born in Europe, 3.7% born in Asia), which is 60.4% greater than the foreign-born rate of 4.0% across the entire state of Ohio.
Race distribution in Broadview Heights
2000
2022

- 15,06994.4%White alone
- 4763.0%Asian alone
- 1470.9%Hispanic
- 1260.8%Black alone
- 1210.8%Two or more races
- 150.09%Other race alone
- 120.08%American Indian alone
- 10.01%Native Hawaiian and Other
Pacific Islander alone

-
- 16,50384.7%White alone
- 1,1636.0%Asian alone
- 6693.4%Two or more races
- 6193.2%Black alone
- 4032.1%Hispanic
- 140.07%Other race alone
2000
2022
-
- 9,538,11184.0%White alone
- 1,290,66211.4%Black alone
- 217,1231.9%Hispanic
- 137,7701.2%Two or more races
- 131,6701.2%Asian alone
- 21,9850.2%American Indian alone
- 13,4830.1%Other race alone
- 2,3360.02%Native Hawaiian and Other
Pacific Islander alone

-
- 8,948,79376.1%White alone
- 1,401,40311.9%Black alone
- 529,2914.5%Two or more races
- 517,2324.4%Hispanic
- 293,3872.5%Asian alone
- 52,8050.4%Other race alone
- 9,7850.08%American Indian alone
- 3,3620.03%Native Hawaiian and Other
Pacific Islander alone

Income and house value in Broadview Heights
- Median household income in 2022
- $96,558White non-Hispanic householders
- $76,814Black householders
- $117,796Asian householders
- $190,682Two or more races householders
- $116,038Hispanic or Latino race householders
- Median 2022 house value
- $318,174White Non-Hispanic householders
- $459,465Asian householders
- $808,917Some other race householders
- $196,656Two or more races householders
- $512,314Hispanic or Latino householders
Household income for White non-Hispanic householders

Household income for Black householders

Household income for Asian householders

Household income for Two or more races householders

Household income for Hispanic or Latino race householders

Median age by race in Broadview Heights
- 47.0Median age for White residents
- 44.2Males
- 48.8Females
- 29.3Median age for Black or African American residents
- 27.0Males
- 51.7Females
- -545,601,290.8Median age for American Indian / Alaska Native residents
- -734,374,999.3Males
- -499,999,999.5Females
- 48.7Median age for Asian residents
- 44.7Males
- 49.4Females
- -706,093,189.3Median age for Native Hawaiian / Pacific Islander residents
- -750,242,953.6Males
- -805,394,989.6Females
- 17.7Median age for Other race residents
- -613,026,819.3Males
- 31.8Females
- 21.3Median age for Two or more races residents
- 44.2Males
- 14.8Females
- 46.9Median age for White alone residents
- 44.3Males
- 48.7Females
- 31.2Median age for Hispanic or Latino residents
- 30.4Males
- 36.1Females
Owner/renter occupied households by race in Broadview Heights
- House owners and renters - White residents
- 6,38787.7%Owner occupied
- 89512.3%Renter occupied
- House owners and renters - Black or African American residents
- 5315.3%Owner occupied
- 29284.7%Renter occupied
- House owners and renters - Asian residents
- 37773.4%Owner occupied
- 13726.6%Renter occupied
- House owners and renters - Other race residents
- 12100.0%Owner occupied
- House owners and renters - Two or more races residents
- 22994.0%Owner occupied
- 156.0%Renter occupied
- House owners and renters - White alone residents
- 6,39888.7%Owner occupied
- 81111.3%Renter occupied
- House owners and renters - Hispanic or Latino residents
- 6134.3%Owner occupied
- 11765.7%Renter occupied
Language usage in Broadview Heights
- English speakers - Total
- 89.4% of residents of Broadview Heights speak English at home.
- 0.9% of residents speak Spanish at home
- 12876.2%Speak English very well
- 4023.8%Speak English less than very well
- 9.9% of residents speak other language at home
- 1,37075.2%Speak English very well
- 45124.8%Speak English less than very well
- English speakers - Born in the United States
- 91.3% of residents of Broadview Heights speak English at home.
- 10.8% of residents speak other language at home
- 22389.9%Speak English very well
- 2510.1%Speak English less than very well
- English speakers - Native, born elsewhere
- 55.6% of residents of Broadview Heights speak English at home.
- 33.9% of residents speak other language at home
- 64100.0%Speak English very well
- English speakers - Foreign-born
- 29.6% of residents of Broadview Heights speak English at home.
- 6.4% of residents speak Spanish at home
- 7360.3%Speak English very well
- 4839.7%Speak English less than very well
- 62.6% of residents speak other language at home
- 79366.9%Speak English very well
- 39233.1%Speak English less than very well
White (Caucasian) - Speak only English
| Native: | 98.4% (14,240) |
| Foreign-born: | 40.6% (390) |
White (Caucasian) - Speak another language
| Native: | 2.1% (297) |
| Foreign-born: | 59.9% (576) |
Black or African American - Speak only English
| Native: | 100.0% (587) |
| Foreign-born: | 61.1% (22) |
Asian - Speak only English
| Native: | 48.0% (253) |
| Foreign-born: | 23.9% (155) |
Asian - Speak another language
| Native: | 52.0% (274) |
| Foreign-born: | 76.2% (494) |
Two or more races - Speak another language
| Native: | 6.5% (44) |
| Foreign-born: | 100.0% (92) |
White alone - Speak only English
| Native: | 97.3% (14,143) |
| Foreign-born: | 40.1% (396) |
White alone - Speak another language
| Native: | 2.7% (389) |
| Foreign-born: | 59.8% (591) |
Foreign-born residents in Broadview Heights
1,969 residents are foreign born (4.8% Europe, 3.7% Asia).
| This city: | 10.1% |
| Ohio: | 4.9% |


Marital status for residents in Broadview Heights
Marital status - White (Caucasian) population 15 years and over
- Males
- 29.1%Never married
- 59.2%Now married
- 0.6%Separated
- 4.1%Widowed
- 6.9%Divorced
- Females
- 24.9%Never married
- 56.5%Now married
- 0.5%Separated
- 7.3%Widowed
- 10.8%Divorced
Women who gave birth in the past 12 months
| Now married: | 100.0% (106) |
| Unmarried: | 0.0% (0) |
Women who did not give birth in the past 12 months
| Now married: | 41.8% (1,288) |
| Unmarried: | 58.2% (1,794) |
Marital status - Black or African American population 15 years and over
- Males
- 81.0%Never married
- 0.0%Now married
- 0.0%Separated
- 0.0%Widowed
- 19.0%Divorced
- Females
- 78.4%Never married
- 2.4%Now married
- 2.1%Separated
- 8.7%Widowed
- 8.4%Divorced
Women who did not give birth in the past 12 months
| Now married: | 0.0% (0) |
| Unmarried: | 100.0% (162) |
Marital status - Asian population 15 years and over
- Males
- 6.7%Never married
- 93.0%Now married
- 0.0%Separated
- 0.0%Widowed
- 0.3%Divorced
- Females
- 8.6%Never married
- 59.9%Now married
- 0.0%Separated
- 14.2%Widowed
- 17.4%Divorced
Women who gave birth in the past 12 months
| Now married: | 100.0% (14) |
| Unmarried: | 0.0% (0) |
Women who did not give birth in the past 12 months
| Now married: | 61.1% (186) |
| Unmarried: | 38.9% (119) |
Marital status - Other race population 15 years and over
- Males
- 100.0%Never married
- 0.0%Now married
- 0.0%Separated
- 0.0%Widowed
- 0.0%Divorced
- Females
- 0.0%Never married
- 75.6%Now married
- 0.0%Separated
- 24.4%Widowed
- 0.0%Divorced
Women who did not give birth in the past 12 months
| Now married: | 100.0% (26) |
| Unmarried: | 0.0% (0) |
Marital status - Two or more races population 15 years and over
- Males
- 34.1%Never married
- 63.9%Now married
- 0.0%Separated
- 0.0%Widowed
- 1.9%Divorced
- Females
- 26.1%Never married
- 45.6%Now married
- 11.7%Separated
- 0.0%Widowed
- 16.7%Divorced
Women who did not give birth in the past 12 months
| Now married: | 22.2% (26) |
| Unmarried: | 77.8% (90) |
Marital status - White alone, not Hispanic / Latino population 15 years and over
- Males
- 28.3%Never married
- 59.7%Now married
- 0.6%Separated
- 4.2%Widowed
- 7.1%Divorced
- Females
- 24.7%Never married
- 56.8%Now married
- 0.5%Separated
- 7.3%Widowed
- 10.8%Divorced
Women who gave birth in the past 12 months
| Now married: | 100.0% (109) |
| Unmarried: | 0.0% (0) |
Women who did not give birth in the past 12 months
| Now married: | 42.1% (1,324) |
| Unmarried: | 57.9% (1,821) |
Marital status - Hispanic or Latino population 15 years and over
- Males
- 64.8%Never married
- 35.2%Now married
- 0.0%Separated
- 0.0%Widowed
- 0.0%Divorced
- Females
- 19.3%Never married
- 42.0%Now married
- 0.0%Separated
- 15.1%Widowed
- 23.5%Divorced
Women who did not give birth in the past 12 months
| Now married: | 26.1% (19) |
| Unmarried: | 73.9% (53) |
Ancestries in Broadview Heights

- 94712.1%Italian
- 89811.4%American
- 7119.1%Polish
- 7039.0%German
- 3794.8%Serbian
- 3794.8%Irish
- 3224.1%Ukrainian
- 2012.6%English
- 1942.5%Slovak
- 1652.1%European
- 1511.9%Hungarian
- 1191.5%Scottish
- 941.2%Macedonian
- 911.2%Bulgarian
- 891.1%Slovene
- 791.0%Egyptian
- 751.0%Welsh
- 740.9%Lebanese
- 660.8%Eastern European
- 600.8%Czech
- 370.5%Swedish
- 310.4%Jamaican
- 300.4%French Canadian
- 280.4%Greek
- 220.3%Russian
- 200.3%Lithuanian
- 200.3%Norwegian
- 190.2%French
- 170.2%Czechoslovakian
- 160.2%Scotch-Irish
- 150.2%Belgian
- 140.2%Austrian
- 120.2%Latvian
- 60.08%Arab
- 60.08%Slavic

Geographical mobility in Broadview Heights

- Same house 1 year ago
- 14,65489.4%White (Caucasian)
- 41266.6%Black or African American
- 1,03690.3%Asian
- 10191.6%Other race
- 78293.4%Two or more races
- 14,72389.6%White alone, not Hispanic / Latino
- 26766.1%Hispanic or Latino

-
- Moved within same county
- 8745.3%White / Caucasian
- 15024.2%Black or African American
- 506.0%Two or more races
- 9125.5%White alone, not Hispanic / Latino
- 317.6%Hispanic or Latino

-
- Moved within same state
- 6113.7%White / Caucasian
- 376.0%Black or African American
- 16514.4%Asian
- 6153.7%White alone, not Hispanic / Latino

-
- Moved from different state
- 2991.8%White / Caucasian
- 2041.2%White alone, not Hispanic / Latino
- 16340.4%Hispanic or Latino

Children Nativity (place of birth) in Broadview Heights
Place of birth for residents in Broadview Heights
![Place of birth for the foreign-born population - Regions]()
- 974Europe
- 757Asia
- 657Eastern Europe
- 383South Central Asia
- 192Americas
- 170Latin America
- 158Eastern Asia
- 149Southern Europe
- 137South Eastern Asia
- 90Western Europe
- 84China
- 77Northern Europe
- 77Western Asia
- 72Central America
- 69South America
- 45Africa
- 45Northern Africa
- 28Caribbean
- 21Northern America

![Place of birth for the foreign-born population - Countries]()
- 366India
- 175Bosnia and Herzegovina
- 137Philippines
- 135North Macedonia (Macedonia)
- 135Italy
- 110Serbia
- 95Ukraine
- 77Ireland
- 73Korea
- 63Germany
- 63China
- 46Bulgaria
- 45Egypt
- 41Lebanon
- 37El Salvador
- 35Kuwait
- 33Romania
- 28Jamaica
- 27Hungary
- 25Colombia
- 21Hong Kong
- 21Canada
- 20Poland
- 18Mexico
- 16Panama
- 16Brazil
- 16Venezuela
- 14Netherlands
- 14Greece
- 12Belgium
- 12Bangladesh
- 11Argentina
- 5Pakistan

Grandparents responsible for own grandchildren in Broadview Heights
Zip codes: 44133.