Races in Broadview, Illinois (IL) Detailed Stats
Data:
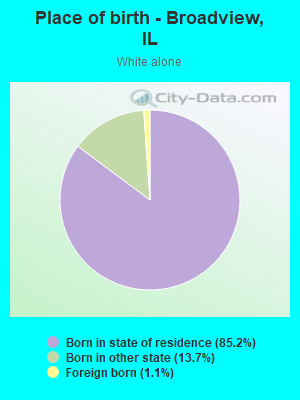
Races - White alone (%)
Races - White alone (% change since 2000)
Races - Black alone (%)
Races - Black alone (% change since 2000)
Races - American Indian alone (%)
Races - American Indian alone (% change since 2000)
Races - Asian alone (%)
Races - Asian alone (% change since 2000)
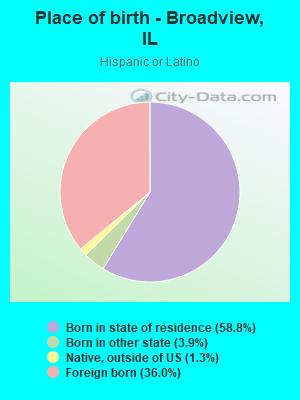
Races - Hispanic (%)
Races - Hispanic (% change since 2000)
Races - Native Hawaiian and Other Pacific Islander alone (%)
Races - Native Hawaiian and Other Pacific Islander alone (% change since 2000)
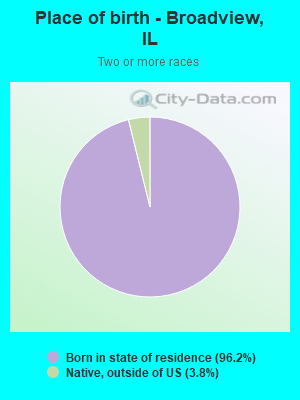
Races - Two or more races(%)
Races - Two or more races(% change since 2000)
Races - Other race alone (%)
Races - Other race alone (% change since 2000)
Racial diversity
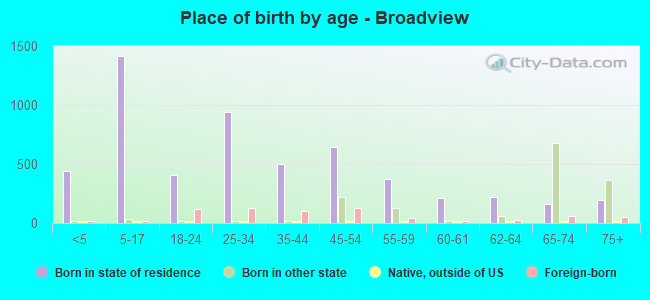
Place of birth - Born in state of residence (%)
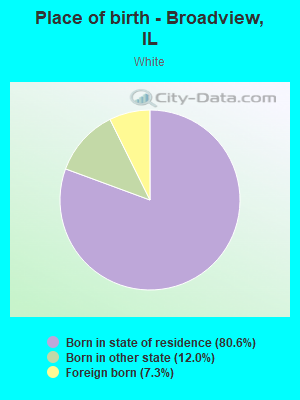
Place of birth - Born in state of residence (%) - White
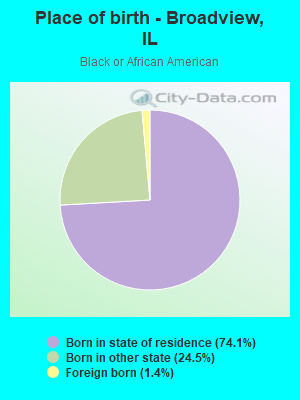
Place of birth - Born in state of residence (%) - Black or African American
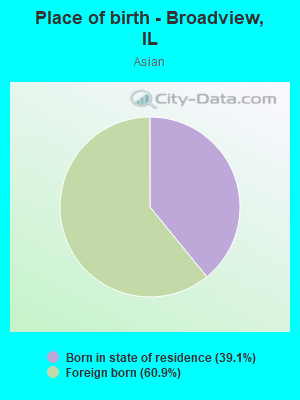
Place of birth - Born in state of residence (%) - Asian
Place of birth - Born in state of residence (%) - Hispanic or Latino
Place of birth - Born in state of residence (%) - American Indian and Alaska Native
Place of birth - Born in state of residence (%) - Multirace
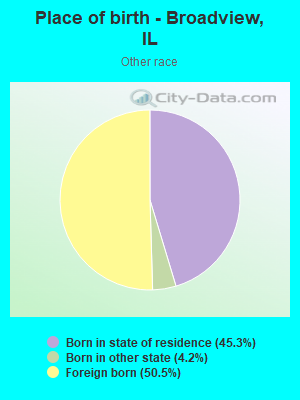
Place of birth - Born in state of residence (%) - Other Race
Place of birth - Born in other state (%)
Place of birth - Born in other state (%) - White
Place of birth - Born in other state (%) - Black or African American
Place of birth - Born in other state (%) - Asian
Place of birth - Born in other state (%) - Hispanic or Latino
Place of birth - Born in other state (%) - American Indian and Alaska Native
Place of birth - Born in other state (%) - Multirace
Place of birth - Born in other state (%) - Other Race
Place of birth - Native, outside of US (%)
Place of birth - Native, outside of US (%) - White
Place of birth - Native, outside of US (%) - Black or African American
Place of birth - Native, outside of US (%) - Asian
Place of birth - Native, outside of US (%) - Hispanic or Latino
Place of birth - Native, outside of US (%) - American Indian and Alaska Native
Place of birth - Native, outside of US (%) - Multirace
Place of birth - Native, outside of US (%) - Other Race
Place of birth - Foreign born (%)
Place of birth - Foreign born (%) - White
Place of birth - Foreign born (%) - Black or African American
Place of birth - Foreign born (%) - Asian
Place of birth - Foreign born (%) - Hispanic or Latino
Place of birth - Foreign born (%) - American Indian and Alaska Native
Place of birth - Foreign born (%) - Multirace
Place of birth - Foreign born (%) - Other Race
Residents speaking English at home (%)
Residents speaking English at home - Born in the United States (%)
Residents speaking English at home - Native, born elsewhere (%)
Residents speaking English at home - Foreign born (%)
Residents speaking Spanish at home (%)
Residents speaking Spanish at home - Born in the United States (%)
Residents speaking Spanish at home - Native, born elsewhere (%)
Residents speaking Spanish at home - Foreign born (%)
Residents speaking other language at home (%)
Residents speaking other language at home - Born in the United States (%)
Residents speaking other language at home - Native, born elsewhere (%)
Residents speaking other language at home - Foreign born (%)
Marital status - Never married (%)
Marital status - Now married (%)
Marital status - Separated (%)
Marital status - Widowed (%)
Marital status - Divorced (%)
Ancestries Reported - Arab (%)
Ancestries Reported - Czech (%)
Ancestries Reported - Danish (%)
Ancestries Reported - Dutch (%)
Ancestries Reported - English (%)
Ancestries Reported - French (%)
Ancestries Reported - French Canadian (%)
Ancestries Reported - German (%)
Ancestries Reported - Greek (%)
Ancestries Reported - Hungarian (%)
Ancestries Reported - Irish (%)
Ancestries Reported - Italian (%)
Ancestries Reported - Lithuanian (%)
Ancestries Reported - Norwegian (%)
Ancestries Reported - Polish (%)
Ancestries Reported - Portuguese (%)
Ancestries Reported - Russian (%)
Ancestries Reported - Scotch-Irish (%)
Ancestries Reported - Scottish (%)
Ancestries Reported - Slovak (%)
Ancestries Reported - Subsaharan African (%)
Ancestries Reported - Swedish (%)
Ancestries Reported - Swiss (%)
Ancestries Reported - Ukrainian (%)
Ancestries Reported - United States (%)
Ancestries Reported - Welsh (%)
Ancestries Reported - West Indian (%)
Ancestries Reported - Other (%)
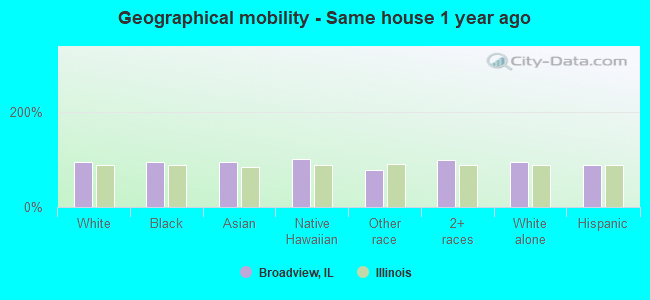
Geographical mobility - Same house 1 year ago (%)
Geographical mobility - Same house 1 year ago (%) - White
Geographical mobility - Same house 1 year ago (%) - Black or African American
Geographical mobility - Same house 1 year ago (%) - Asian
Geographical mobility - Same house 1 year ago (%) - Hispanic or Latino
Geographical mobility - Same house 1 year ago (%) - American Indian and Alaska Native
Geographical mobility - Same house 1 year ago (%) - Multirace
Geographical mobility - Same house 1 year ago (%) - Other Race
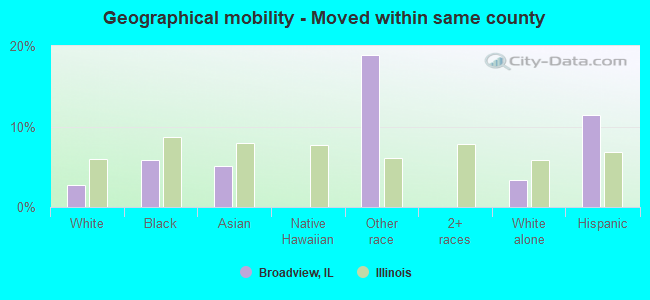
Geographical mobility - Moved within same county (%)
Geographical mobility - Moved within same county (%) - White
Geographical mobility - Moved within same county (%) - Black or African American
Geographical mobility - Moved within same county (%) - Asian
Geographical mobility - Moved within same county (%) - Hispanic or Latino
Geographical mobility - Moved within same county (%) - American Indian and Alaska Native
Geographical mobility - Moved within same county (%) - Multirace
Geographical mobility - Moved within same county (%) - Other Race
Geographical mobility - Moved from different county within same state (%)
Geographical mobility - Moved from different county within same state (%) - White
Geographical mobility - Moved from different county within same state (%) - Black or African American
Geographical mobility - Moved from different county within same state (%) - Asian
Geographical mobility - Moved from different county within same state (%) - Hispanic or Latino
Geographical mobility - Moved from different county within same state (%) - American Indian and Alaska Native
Geographical mobility - Moved from different county within same state (%) - Multirace
Geographical mobility - Moved from different county within same state (%) - Other Race
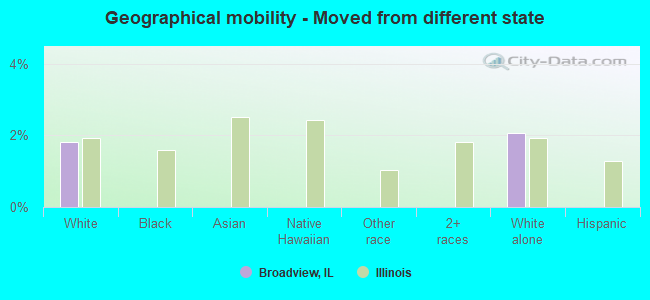
Geographical mobility - Moved from different state (%)
Geographical mobility - Moved from different state (%) - White
Geographical mobility - Moved from different state (%) - Black or African American
Geographical mobility - Moved from different state (%) - Asian
Geographical mobility - Moved from different state (%) - Hispanic or Latino
Geographical mobility - Moved from different state (%) - American Indian and Alaska Native
Geographical mobility - Moved from different state (%) - Multirace
Geographical mobility - Moved from different state (%) - Other Race
Geographical mobility - Moved from abroad (%)
Geographical mobility - Moved from abroad (%) - White
Geographical mobility - Moved from abroad (%) - Black or African American
Geographical mobility - Moved from abroad (%) - Asian
Geographical mobility - Moved from abroad (%) - Hispanic or Latino
Geographical mobility - Moved from abroad (%) - American Indian and Alaska Native
Geographical mobility - Moved from abroad (%) - Multirace
Geographical mobility - Moved from abroad (%) - Other Race
Place of birth for the foreign-born population - Ireland (%)
Place of birth for the foreign-born population - Denmark (%)
Place of birth for the foreign-born population - Norway (%)
Place of birth for the foreign-born population - Sweden (%)
Place of birth for the foreign-born population - United Kingdom (%)
Place of birth for the foreign-born population - England (%)
Place of birth for the foreign-born population - Scotland (%)
Place of birth for the foreign-born population - Other Northern Europe (%)
Place of birth for the foreign-born population - Austria (%)
Place of birth for the foreign-born population - Belgium (%)
Place of birth for the foreign-born population - France (%)
Place of birth for the foreign-born population - Germany (%)
Place of birth for the foreign-born population - Netherlands (%)
Place of birth for the foreign-born population - Switzerland (%)
Place of birth for the foreign-born population - Other Western Europe (%)
Place of birth for the foreign-born population - Greece (%)
Place of birth for the foreign-born population - Italy (%)
Place of birth for the foreign-born population - Portugal (%)
Place of birth for the foreign-born population - Spain (%)
Place of birth for the foreign-born population - Other Southern Europe (%)
Place of birth for the foreign-born population - Albania (%)
Place of birth for the foreign-born population - Belarus (%)
Place of birth for the foreign-born population - Bosnia and Herzegovina (%)
Place of birth for the foreign-born population - Bulgaria (%)
Place of birth for the foreign-born population - Croatia (%)
Place of birth for the foreign-born population - Czechoslovakia (%)
Place of birth for the foreign-born population - Hungary (%)
Place of birth for the foreign-born population - Latvia (%)
Place of birth for the foreign-born population - Lithuania (%)
Place of birth for the foreign-born population - North Macedonia (Macedonia) (%)
Place of birth for the foreign-born population - Moldova (%)
Place of birth for the foreign-born population - Poland (%)
Place of birth for the foreign-born population - Romania (%)
Place of birth for the foreign-born population - Russia (%)
Place of birth for the foreign-born population - Serbia (%)
Place of birth for the foreign-born population - Ukraine (%)
Place of birth for the foreign-born population - Other Eastern Europe (%)
Place of birth for the foreign-born population - China (%)
Place of birth for the foreign-born population - Hong Kong (%)
Place of birth for the foreign-born population - Taiwan (%)
Place of birth for the foreign-born population - Japan (%)
Place of birth for the foreign-born population - Korea (%)
Place of birth for the foreign-born population - Other Eastern Asia (%)
Place of birth for the foreign-born population - Afghanistan (%)
Place of birth for the foreign-born population - Bangladesh (%)
Place of birth for the foreign-born population - India (%)
Place of birth for the foreign-born population - Iran (%)
Place of birth for the foreign-born population - Kazakhstan (%)
Place of birth for the foreign-born population - Nepal (%)
Place of birth for the foreign-born population - Pakistan (%)
Place of birth for the foreign-born population - Sri Lanka (%)
Place of birth for the foreign-born population - Uzbekistan (%)
Place of birth for the foreign-born population - Other South Central Asia (%)
Place of birth for the foreign-born population - Burma (%)
Place of birth for the foreign-born population - Cambodia (%)
Place of birth for the foreign-born population - Indonesia (%)
Place of birth for the foreign-born population - Laos (%)
Place of birth for the foreign-born population - Malaysia (%)
Place of birth for the foreign-born population - Philippines (%)
Place of birth for the foreign-born population - Singapore (%)
Place of birth for the foreign-born population - Thailand (%)
Place of birth for the foreign-born population - Vietnam (%)
Place of birth for the foreign-born population - Other South Eastern Asia (%)
Place of birth for the foreign-born population - Armenia (%)
Place of birth for the foreign-born population - Iraq (%)
Place of birth for the foreign-born population - Israel (%)
Place of birth for the foreign-born population - Jordan (%)
Place of birth for the foreign-born population - Kuwait (%)
Place of birth for the foreign-born population - Lebanon (%)
Place of birth for the foreign-born population - Saudi Arabia (%)
Place of birth for the foreign-born population - Syria (%)
Place of birth for the foreign-born population - Turkey (%)
Place of birth for the foreign-born population - Yemen (%)
Place of birth for the foreign-born population - Other Western Asia (%)
Place of birth for the foreign-born population - Eritrea (%)
Place of birth for the foreign-born population - Ethiopia (%)
Place of birth for the foreign-born population - Kenya (%)
Place of birth for the foreign-born population - Somalia (%)
Place of birth for the foreign-born population - Uganda (%)
Place of birth for the foreign-born population - Zimbabwe (%)
Place of birth for the foreign-born population - Other Eastern Africa (%)
Place of birth for the foreign-born population - Cameroon (%)
Place of birth for the foreign-born population - Congo (%)
Place of birth for the foreign-born population - Democratic Republic of Congo (Zaire) (%)
Place of birth for the foreign-born population - Other Middle Africa (%)
Place of birth for the foreign-born population - Egypt (%)
Place of birth for the foreign-born population - Morocco (%)
Place of birth for the foreign-born population - Sudan (%)
Place of birth for the foreign-born population - Other Northern Africa (%)
Place of birth for the foreign-born population - South Africa (%)
Place of birth for the foreign-born population - Other Southern Africa (%)
Place of birth for the foreign-born population - Cabo Verde (%)
Place of birth for the foreign-born population - Ghana (%)
Place of birth for the foreign-born population - Liberia (%)
Place of birth for the foreign-born population - Nigeria (%)
Place of birth for the foreign-born population - Senegal (%)
Place of birth for the foreign-born population - Sierra Leone (%)
Place of birth for the foreign-born population - Other Western Africa (%)
Place of birth for the foreign-born population - Australia (%)
Place of birth for the foreign-born population - New Zealand (%)
Place of birth for the foreign-born population - Fiji (%)
Place of birth for the foreign-born population - Micronesia (%)
Place of birth for the foreign-born population - Bahamas (%)
Place of birth for the foreign-born population - Barbados (%)
Place of birth for the foreign-born population - Cuba (%)
Place of birth for the foreign-born population - Dominica (%)
Place of birth for the foreign-born population - Dominican Republic (%)
Place of birth for the foreign-born population - Grenada (%)
Place of birth for the foreign-born population - Haiti (%)
Place of birth for the foreign-born population - Jamaica (%)
Place of birth for the foreign-born population - St. Vincent and the Grenadines (%)
Place of birth for the foreign-born population - Trinidad and Tobago (%)
Place of birth for the foreign-born population - West Indies (%)
Place of birth for the foreign-born population - Other Caribbean (%)
Place of birth for the foreign-born population - Belize (%)
Place of birth for the foreign-born population - Costa Rica (%)
Place of birth for the foreign-born population - El Salvador (%)
Place of birth for the foreign-born population - Guatemala (%)
Place of birth for the foreign-born population - Honduras (%)
Place of birth for the foreign-born population - Mexico (%)
Place of birth for the foreign-born population - Nicaragua (%)
Place of birth for the foreign-born population - Panama (%)
Place of birth for the foreign-born population - Other Central America (%)
Place of birth for the foreign-born population - Argentina (%)
Place of birth for the foreign-born population - Bolivia (%)
Place of birth for the foreign-born population - Brazil (%)
Place of birth for the foreign-born population - Chile (%)
Place of birth for the foreign-born population - Colombia (%)
Place of birth for the foreign-born population - Ecuador (%)
Place of birth for the foreign-born population - Guyana (%)
Place of birth for the foreign-born population - Peru (%)
Place of birth for the foreign-born population - Uruguay (%)
Place of birth for the foreign-born population - Venezuela (%)
Place of birth for the foreign-born population - Other South America (%)
Place of birth for the foreign-born population - Canada (%)
Place of birth for the foreign-born population - Other Northern America (%)
Place of birth for the foreign-born population - Other (%)
Latest news about races in Broadview, IL collected exclusively by city-data.com from local newspapers, TV, and radio stations
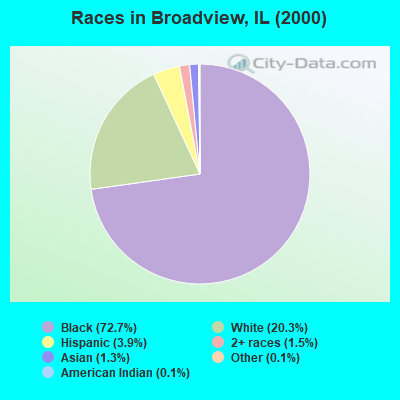
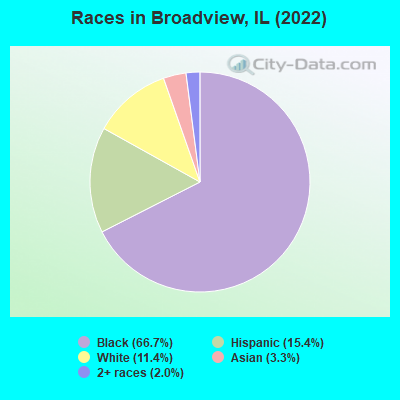
According to 2022 data, the most numerous races in Broadview, IL are White alone (888 residents), Hispanic (1,196 residents), and Black alone (5,191 residents). 79.9% of Broadview residents speak English at home. 8.5% of Broadview, IL residents are foreign-born (5.5% born in Latin America, 1.9% born in Asia, 1.0% born in Africa), which is 64.3% less than the foreign-born rate of 14.0% across the entire state of Illinois.
Race distribution in Broadview
2000 2022
8,424,140 67.8% White alone 1,856,152 14.9% Black alone 1,530,262 12.3% Hispanic 419,916 3.4% Asian alone 153,996 1.2% Two or more races 13,479 0.1% Other race alone 18,232 0.1% American Indian alone 3,116 0.03% Native Hawaiian and Other
7,356,301 58.5% White alone 2,299,726 18.3% Hispanic 1,660,423 13.2% Black alone 747,296 5.9% Asian alone 458,599 3.6% Two or more races 45,386 0.4% Other race alone 10,405 0.08% American Indian alone 3,896 0.03% Native Hawaiian and Other
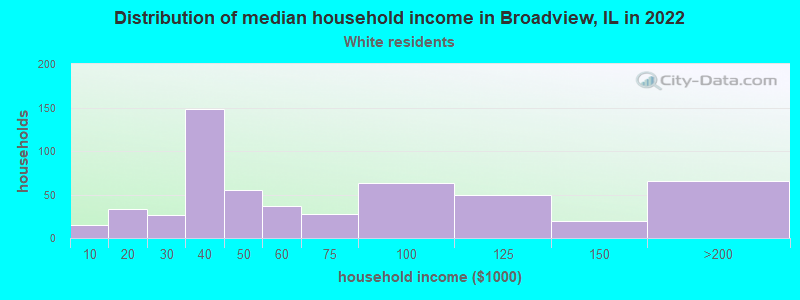
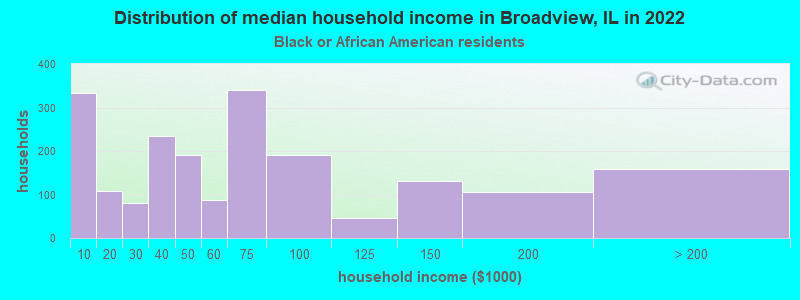
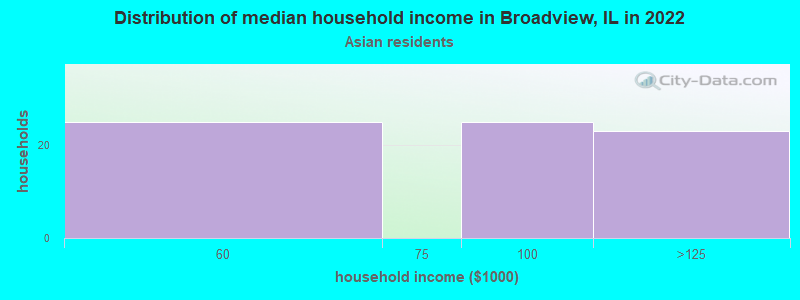
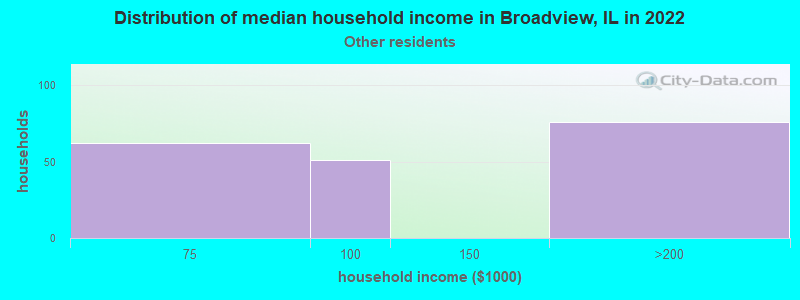
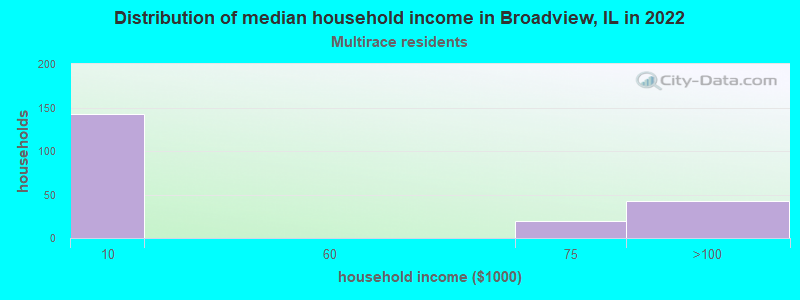
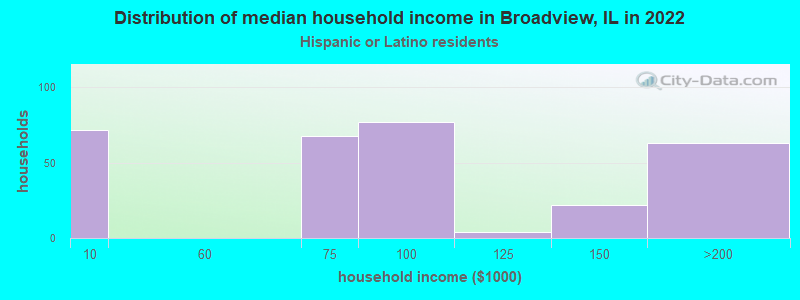
Income and house value in Broadview Median household income in 2022 $43,602 White non-Hispanic householders$53,375 Black householders$72,249 Asian householders$79,847 Hispanic or Latino race householdersMedian 2022 house value $218,387 White Non-Hispanic householders$227,668 Black or African American householders $409,475 Asian householders$176,347 Some other race householders$216,203 Two or more races householders$194,364 Hispanic or Latino householders
Median age by race in Broadview
55.6 Median age for White residents49.8 62.2 41.1 Median age for Black or African American residents40.2 42.7 -680,473,372.1 Median age for American Indian / Alaska Native residents-736,736,736.0 -641,399,416.3 34.9 Median age for Asian residents10.9 53.9 -687,999,999.3 Median age for Native Hawaiian / Pacific Islander residents-918,721,460.3 -610,229,276.3 25.2 Median age for Other race residents22.7 25.3 15.5 Median age for Two or more races residents11.1 36.0 60.5 Median age for White alone residents49.4 66.2 24.8 Median age for Hispanic or Latino residents15.3 27.0
Owner/renter occupied households by race in Broadview
House owners and renters - White residents 350 64.9% Owner occupied189 35.1% Renter occupiedHouse owners and renters - Black or African American residents 1,335 64.1% Owner occupied747 35.9% Renter occupiedHouse owners and renters - Asian residents 79 100.0% Owner occupiedHouse owners and renters - Other race residents 135 74.7% Owner occupied46 25.3% Renter occupiedHouse owners and renters - Two or more races residents 194 100.0% Owner occupiedHouse owners and renters - White alone residents 326 61.0% Owner occupied208 39.0% Renter occupiedHouse owners and renters - Hispanic or Latino residents 256 86.3% Owner occupied41 13.7% Renter occupied
Language usage in Broadview
English speakers - Total 79.9% of residents of Broadview speak English at home.
16.1% of residents speak Spanish at home 903 76.5% Speak English very well278 23.5% Speak English less than very well3.4% of residents speak other language at home 226 91.1% Speak English very well22 8.9% Speak English less than very well
English speakers - Born in the United States 96.5% of residents of Broadview speak English at home.
2.4% of residents speak Spanish at home 36 100.0% Speak English less than very well1.0% of residents speak other language at home 16 100.0% Speak English very well
All residents speak only English at home
English speakers - Foreign-born 0.0% of residents of Broadview speak English at home.
66.3% of residents speak Spanish at home 257 58.5% Speak English very well182 41.5% Speak English less than very well34.4% of residents speak other language at home 206 90.4% Speak English very well22 9.6% Speak English less than very well
White (Caucasian) - Speak another language Native:
5.0% (44)Foreign-born:
98.9% (71)
Black or African American - Speak another language Native:
8.8% (437)Foreign-born:
91.2% (67)
Other race - Speak another language Native:
91.9% (242)Foreign-born:
100.0% (399)
Hispanic or Latino - Speak another language Native:
53.7% (309)Foreign-born:
100.0% (429)
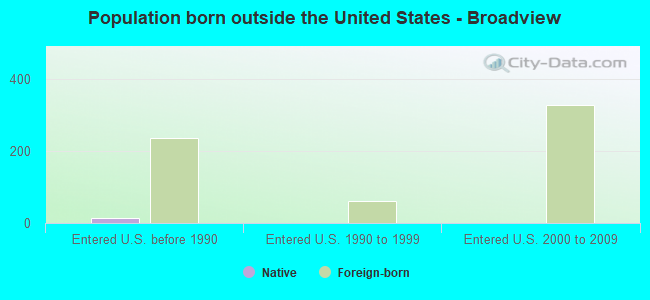
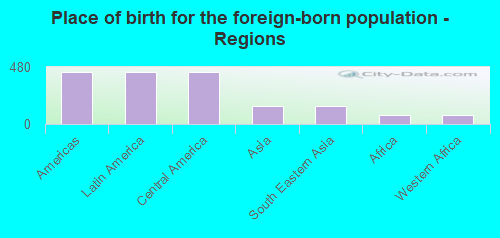
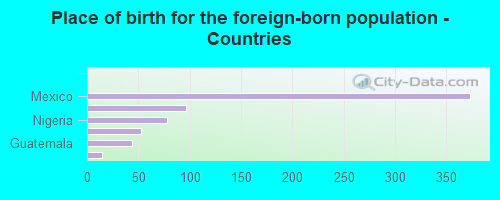
Foreign-born residents in Broadview 663 residents are foreign born (5.5% Latin America , 1.9% Asia , 1.0% Africa ).
This city:
8.5%Illinois:
14.1%
Marital status for residents in Broadview Marital status - White (Caucasian) population 15 years and over
Males 26.6% Never married60.7% Now married0.0% Separated4.0% Widowed8.8% DivorcedFemales 15.0% Never married32.9% Now married0.0% Separated39.6% Widowed12.5% DivorcedWomen who gave birth in the past 12 months Now married:
100.0% (19)Unmarried:
0.0% (0)
Women who did not give birth in the past 12 months Now married:
41.1% (73)Unmarried:
58.9% (104)
Marital status - Black or African American population 15 years and over
Males 57.7% Never married30.3% Now married5.3% Separated1.3% Widowed5.3% DivorcedFemales 49.6% Never married30.8% Now married1.8% Separated10.6% Widowed7.2% DivorcedWomen who did not give birth in the past 12 months Now married:
26.9% (247)Unmarried:
73.1% (672)
Marital status - Asian population 15 years and over
Males 0.0% Never married100.0% Now married0.0% Separated0.0% Widowed0.0% DivorcedFemales 35.5% Never married42.7% Now married0.0% Separated21.8% Widowed0.0% DivorcedWomen who did not give birth in the past 12 months Now married:
58.0% (29)Unmarried:
42.0% (21)
Marital status - Other race population 15 years and over
Males 47.5% Never married52.5% Now married0.0% Separated0.0% Widowed0.0% DivorcedFemales 52.3% Never married47.7% Now married0.0% Separated0.0% Widowed0.0% DivorcedWomen who gave birth in the past 12 months Now married:
42.5% (35)Unmarried:
57.5% (47)
Women who did not give birth in the past 12 months Now married:
38.3% (64)Unmarried:
61.7% (104)
Marital status - Two or more races population 15 years and over
Males 38.3% Never married61.7% Now married0.0% Separated0.0% Widowed0.0% DivorcedFemales 37.8% Never married26.7% Now married0.0% Separated0.0% Widowed35.6% DivorcedWomen who did not give birth in the past 12 months Now married:
0.0% (0)Unmarried:
100.0% (137)
Marital status - White alone, not Hispanic / Latino population 15 years and over
Males 25.1% Never married59.0% Now married0.0% Separated4.9% Widowed11.0% DivorcedFemales 12.4% Never married29.3% Now married0.0% Separated44.2% Widowed14.1% DivorcedWomen who gave birth in the past 12 months Now married:
100.0% (21)Unmarried:
0.0% (0)
Women who did not give birth in the past 12 months Now married:
38.1% (58)Unmarried:
61.9% (94)
Marital status - Hispanic or Latino population 15 years and over
Males 47.9% Never married52.1% Now married0.0% Separated0.0% Widowed0.0% DivorcedFemales 44.7% Never married39.8% Now married3.2% Separated0.7% Widowed11.7% DivorcedWomen who gave birth in the past 12 months Now married:
42.5% (31)Unmarried:
57.5% (42)
Women who did not give birth in the past 12 months Now married:
31.7% (82)Unmarried:
68.3% (177)
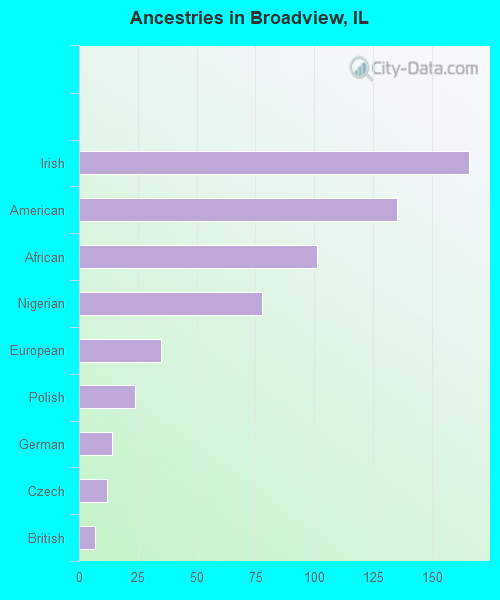
Ancestries in Broadview
166 2.7% Irish135 2.2% American101 1.7% African78 1.3% Nigerian35 0.6% European24 0.4% Polish14 0.2% German12 0.2% Czech7 0.1% British
Children Nativity (place of birth) in Broadview
Children under 6 years - Living with two parents Both parents native 66 100.0% NativeBoth parents foreign-born 26 100.0% NativeOne native, one foreign-born parent 59 100.0% NativeChildren under 6 years - Living with one parent Native parent 430 100.0% NativeChildren 6 to 17 years - Living with two parents Both parents native 374 100.0% NativeBoth parents foreign-born 70 100.0% NativeOne native, one foreign-born parent 42 100.0% NativeChildren 6 to 17 years - Living with one parent Native parent 713 100.0% NativeForeign-born parent 84 50.1% Native84 49.9% Foreign-born
Grandparents responsible for own grandchildren in Broadview
Grandparents (30 to 59 years) White / Caucasian 11 100.0% Not responsible for grandchildrenBlack or African American 48 100.0% Not responsible for grandchildrenOther race 30 100.0% Responsible for grandchildrenHispanic or Latino 20 52.7% Responsible for grandchildren18 47.3% Not responsible for grandchildrenGrandparents (60 years and over) White / Caucasian 15 100.0% Not responsible for grandchildrenBlack or African American 54 53.0% Responsible for grandchildren48 47.0% Not responsible for grandchildrenOther race 45 100.0% Not responsible for grandchildrenHispanic or Latino 69 100.0% Not responsible for grandchildren