Races in Brook Park, Ohio (OH) Detailed Stats
Data:
Races - White alone (%)
Races - White alone (% change since 2000)
Races - Black alone (%)
Races - Black alone (% change since 2000)
Races - American Indian alone (%)
Races - American Indian alone (% change since 2000)
Races - Asian alone (%)
Races - Asian alone (% change since 2000)
Races - Hispanic (%)
Races - Hispanic (% change since 2000)
Races - Native Hawaiian and Other Pacific Islander alone (%)
Races - Native Hawaiian and Other Pacific Islander alone (% change since 2000)
Races - Two or more races(%)
Races - Two or more races(% change since 2000)
Races - Other race alone (%)
Races - Other race alone (% change since 2000)
Racial diversity
Place of birth - Born in state of residence (%)
Place of birth - Born in state of residence (%) - White
Place of birth - Born in state of residence (%) - Black or African American
Place of birth - Born in state of residence (%) - Asian
Place of birth - Born in state of residence (%) - Hispanic or Latino
Place of birth - Born in state of residence (%) - American Indian and Alaska Native
Place of birth - Born in state of residence (%) - Multirace
Place of birth - Born in state of residence (%) - Other Race
Place of birth - Born in other state (%)
Place of birth - Born in other state (%) - White
Place of birth - Born in other state (%) - Black or African American
Place of birth - Born in other state (%) - Asian
Place of birth - Born in other state (%) - Hispanic or Latino
Place of birth - Born in other state (%) - American Indian and Alaska Native
Place of birth - Born in other state (%) - Multirace
Place of birth - Born in other state (%) - Other Race
Place of birth - Native, outside of US (%)
Place of birth - Native, outside of US (%) - White
Place of birth - Native, outside of US (%) - Black or African American
Place of birth - Native, outside of US (%) - Asian
Place of birth - Native, outside of US (%) - Hispanic or Latino
Place of birth - Native, outside of US (%) - American Indian and Alaska Native
Place of birth - Native, outside of US (%) - Multirace
Place of birth - Native, outside of US (%) - Other Race
Place of birth - Foreign born (%)
Place of birth - Foreign born (%) - White
Place of birth - Foreign born (%) - Black or African American
Place of birth - Foreign born (%) - Asian
Place of birth - Foreign born (%) - Hispanic or Latino
Place of birth - Foreign born (%) - American Indian and Alaska Native
Place of birth - Foreign born (%) - Multirace
Place of birth - Foreign born (%) - Other Race
Residents speaking English at home (%)
Residents speaking English at home - Born in the United States (%)
Residents speaking English at home - Native, born elsewhere (%)
Residents speaking English at home - Foreign born (%)
Residents speaking Spanish at home (%)
Residents speaking Spanish at home - Born in the United States (%)
Residents speaking Spanish at home - Native, born elsewhere (%)
Residents speaking Spanish at home - Foreign born (%)
Residents speaking other language at home (%)
Residents speaking other language at home - Born in the United States (%)
Residents speaking other language at home - Native, born elsewhere (%)
Residents speaking other language at home - Foreign born (%)
Marital status - Never married (%)
Marital status - Now married (%)
Marital status - Separated (%)
Marital status - Widowed (%)
Marital status - Divorced (%)
Ancestries Reported - Arab (%)
Ancestries Reported - Czech (%)
Ancestries Reported - Danish (%)
Ancestries Reported - Dutch (%)
Ancestries Reported - English (%)
Ancestries Reported - French (%)
Ancestries Reported - French Canadian (%)
Ancestries Reported - German (%)
Ancestries Reported - Greek (%)
Ancestries Reported - Hungarian (%)
Ancestries Reported - Irish (%)
Ancestries Reported - Italian (%)
Ancestries Reported - Lithuanian (%)
Ancestries Reported - Norwegian (%)
Ancestries Reported - Polish (%)
Ancestries Reported - Portuguese (%)
Ancestries Reported - Russian (%)
Ancestries Reported - Scotch-Irish (%)
Ancestries Reported - Scottish (%)
Ancestries Reported - Slovak (%)
Ancestries Reported - Subsaharan African (%)
Ancestries Reported - Swedish (%)
Ancestries Reported - Swiss (%)
Ancestries Reported - Ukrainian (%)
Ancestries Reported - United States (%)
Ancestries Reported - Welsh (%)
Ancestries Reported - West Indian (%)
Ancestries Reported - Other (%)
Geographical mobility - Same house 1 year ago (%)
Geographical mobility - Same house 1 year ago (%) - White
Geographical mobility - Same house 1 year ago (%) - Black or African American
Geographical mobility - Same house 1 year ago (%) - Asian
Geographical mobility - Same house 1 year ago (%) - Hispanic or Latino
Geographical mobility - Same house 1 year ago (%) - American Indian and Alaska Native
Geographical mobility - Same house 1 year ago (%) - Multirace
Geographical mobility - Same house 1 year ago (%) - Other Race
Geographical mobility - Moved within same county (%)
Geographical mobility - Moved within same county (%) - White
Geographical mobility - Moved within same county (%) - Black or African American
Geographical mobility - Moved within same county (%) - Asian
Geographical mobility - Moved within same county (%) - Hispanic or Latino
Geographical mobility - Moved within same county (%) - American Indian and Alaska Native
Geographical mobility - Moved within same county (%) - Multirace
Geographical mobility - Moved within same county (%) - Other Race
Geographical mobility - Moved from different county within same state (%)
Geographical mobility - Moved from different county within same state (%) - White
Geographical mobility - Moved from different county within same state (%) - Black or African American
Geographical mobility - Moved from different county within same state (%) - Asian
Geographical mobility - Moved from different county within same state (%) - Hispanic or Latino
Geographical mobility - Moved from different county within same state (%) - American Indian and Alaska Native
Geographical mobility - Moved from different county within same state (%) - Multirace
Geographical mobility - Moved from different county within same state (%) - Other Race
Geographical mobility - Moved from different state (%)
Geographical mobility - Moved from different state (%) - White
Geographical mobility - Moved from different state (%) - Black or African American
Geographical mobility - Moved from different state (%) - Asian
Geographical mobility - Moved from different state (%) - Hispanic or Latino
Geographical mobility - Moved from different state (%) - American Indian and Alaska Native
Geographical mobility - Moved from different state (%) - Multirace
Geographical mobility - Moved from different state (%) - Other Race
Geographical mobility - Moved from abroad (%)
Geographical mobility - Moved from abroad (%) - White
Geographical mobility - Moved from abroad (%) - Black or African American
Geographical mobility - Moved from abroad (%) - Asian
Geographical mobility - Moved from abroad (%) - Hispanic or Latino
Geographical mobility - Moved from abroad (%) - American Indian and Alaska Native
Geographical mobility - Moved from abroad (%) - Multirace
Geographical mobility - Moved from abroad (%) - Other Race
Place of birth for the foreign-born population - Ireland (%)
Place of birth for the foreign-born population - Denmark (%)
Place of birth for the foreign-born population - Norway (%)
Place of birth for the foreign-born population - Sweden (%)
Place of birth for the foreign-born population - United Kingdom (%)
Place of birth for the foreign-born population - England (%)
Place of birth for the foreign-born population - Scotland (%)
Place of birth for the foreign-born population - Other Northern Europe (%)
Place of birth for the foreign-born population - Austria (%)
Place of birth for the foreign-born population - Belgium (%)
Place of birth for the foreign-born population - France (%)
Place of birth for the foreign-born population - Germany (%)
Place of birth for the foreign-born population - Netherlands (%)
Place of birth for the foreign-born population - Switzerland (%)
Place of birth for the foreign-born population - Other Western Europe (%)
Place of birth for the foreign-born population - Greece (%)
Place of birth for the foreign-born population - Italy (%)
Place of birth for the foreign-born population - Portugal (%)
Place of birth for the foreign-born population - Spain (%)
Place of birth for the foreign-born population - Other Southern Europe (%)
Place of birth for the foreign-born population - Albania (%)
Place of birth for the foreign-born population - Belarus (%)
Place of birth for the foreign-born population - Bosnia and Herzegovina (%)
Place of birth for the foreign-born population - Bulgaria (%)
Place of birth for the foreign-born population - Croatia (%)
Place of birth for the foreign-born population - Czechoslovakia (%)
Place of birth for the foreign-born population - Hungary (%)
Place of birth for the foreign-born population - Latvia (%)
Place of birth for the foreign-born population - Lithuania (%)
Place of birth for the foreign-born population - North Macedonia (Macedonia) (%)
Place of birth for the foreign-born population - Moldova (%)
Place of birth for the foreign-born population - Poland (%)
Place of birth for the foreign-born population - Romania (%)
Place of birth for the foreign-born population - Russia (%)
Place of birth for the foreign-born population - Serbia (%)
Place of birth for the foreign-born population - Ukraine (%)
Place of birth for the foreign-born population - Other Eastern Europe (%)
Place of birth for the foreign-born population - China (%)
Place of birth for the foreign-born population - Hong Kong (%)
Place of birth for the foreign-born population - Taiwan (%)
Place of birth for the foreign-born population - Japan (%)
Place of birth for the foreign-born population - Korea (%)
Place of birth for the foreign-born population - Other Eastern Asia (%)
Place of birth for the foreign-born population - Afghanistan (%)
Place of birth for the foreign-born population - Bangladesh (%)
Place of birth for the foreign-born population - India (%)
Place of birth for the foreign-born population - Iran (%)
Place of birth for the foreign-born population - Kazakhstan (%)
Place of birth for the foreign-born population - Nepal (%)
Place of birth for the foreign-born population - Pakistan (%)
Place of birth for the foreign-born population - Sri Lanka (%)
Place of birth for the foreign-born population - Uzbekistan (%)
Place of birth for the foreign-born population - Other South Central Asia (%)
Place of birth for the foreign-born population - Burma (%)
Place of birth for the foreign-born population - Cambodia (%)
Place of birth for the foreign-born population - Indonesia (%)
Place of birth for the foreign-born population - Laos (%)
Place of birth for the foreign-born population - Malaysia (%)
Place of birth for the foreign-born population - Philippines (%)
Place of birth for the foreign-born population - Singapore (%)
Place of birth for the foreign-born population - Thailand (%)
Place of birth for the foreign-born population - Vietnam (%)
Place of birth for the foreign-born population - Other South Eastern Asia (%)
Place of birth for the foreign-born population - Armenia (%)
Place of birth for the foreign-born population - Iraq (%)
Place of birth for the foreign-born population - Israel (%)
Place of birth for the foreign-born population - Jordan (%)
Place of birth for the foreign-born population - Kuwait (%)
Place of birth for the foreign-born population - Lebanon (%)
Place of birth for the foreign-born population - Saudi Arabia (%)
Place of birth for the foreign-born population - Syria (%)
Place of birth for the foreign-born population - Turkey (%)
Place of birth for the foreign-born population - Yemen (%)
Place of birth for the foreign-born population - Other Western Asia (%)
Place of birth for the foreign-born population - Eritrea (%)
Place of birth for the foreign-born population - Ethiopia (%)
Place of birth for the foreign-born population - Kenya (%)
Place of birth for the foreign-born population - Somalia (%)
Place of birth for the foreign-born population - Uganda (%)
Place of birth for the foreign-born population - Zimbabwe (%)
Place of birth for the foreign-born population - Other Eastern Africa (%)
Place of birth for the foreign-born population - Cameroon (%)
Place of birth for the foreign-born population - Congo (%)
Place of birth for the foreign-born population - Democratic Republic of Congo (Zaire) (%)
Place of birth for the foreign-born population - Other Middle Africa (%)
Place of birth for the foreign-born population - Egypt (%)
Place of birth for the foreign-born population - Morocco (%)
Place of birth for the foreign-born population - Sudan (%)
Place of birth for the foreign-born population - Other Northern Africa (%)
Place of birth for the foreign-born population - South Africa (%)
Place of birth for the foreign-born population - Other Southern Africa (%)
Place of birth for the foreign-born population - Cabo Verde (%)
Place of birth for the foreign-born population - Ghana (%)
Place of birth for the foreign-born population - Liberia (%)
Place of birth for the foreign-born population - Nigeria (%)
Place of birth for the foreign-born population - Senegal (%)
Place of birth for the foreign-born population - Sierra Leone (%)
Place of birth for the foreign-born population - Other Western Africa (%)
Place of birth for the foreign-born population - Australia (%)
Place of birth for the foreign-born population - New Zealand (%)
Place of birth for the foreign-born population - Fiji (%)
Place of birth for the foreign-born population - Micronesia (%)
Place of birth for the foreign-born population - Bahamas (%)
Place of birth for the foreign-born population - Barbados (%)
Place of birth for the foreign-born population - Cuba (%)
Place of birth for the foreign-born population - Dominica (%)
Place of birth for the foreign-born population - Dominican Republic (%)
Place of birth for the foreign-born population - Grenada (%)
Place of birth for the foreign-born population - Haiti (%)
Place of birth for the foreign-born population - Jamaica (%)
Place of birth for the foreign-born population - St. Vincent and the Grenadines (%)
Place of birth for the foreign-born population - Trinidad and Tobago (%)
Place of birth for the foreign-born population - West Indies (%)
Place of birth for the foreign-born population - Other Caribbean (%)
Place of birth for the foreign-born population - Belize (%)
Place of birth for the foreign-born population - Costa Rica (%)
Place of birth for the foreign-born population - El Salvador (%)
Place of birth for the foreign-born population - Guatemala (%)
Place of birth for the foreign-born population - Honduras (%)
Place of birth for the foreign-born population - Mexico (%)
Place of birth for the foreign-born population - Nicaragua (%)
Place of birth for the foreign-born population - Panama (%)
Place of birth for the foreign-born population - Other Central America (%)
Place of birth for the foreign-born population - Argentina (%)
Place of birth for the foreign-born population - Bolivia (%)
Place of birth for the foreign-born population - Brazil (%)
Place of birth for the foreign-born population - Chile (%)
Place of birth for the foreign-born population - Colombia (%)
Place of birth for the foreign-born population - Ecuador (%)
Place of birth for the foreign-born population - Guyana (%)
Place of birth for the foreign-born population - Peru (%)
Place of birth for the foreign-born population - Uruguay (%)
Place of birth for the foreign-born population - Venezuela (%)
Place of birth for the foreign-born population - Other South America (%)
Place of birth for the foreign-born population - Canada (%)
Place of birth for the foreign-born population - Other Northern America (%)
Place of birth for the foreign-born population - Other (%)
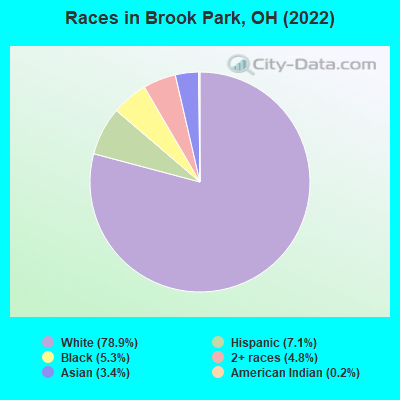
According to 2022 data, the most numerous races in Brook Park, OH are White alone (14,368 residents), Black alone (966 residents), and Two or more races (873 residents). 91.2% of Brook Park residents speak English at home. 5.9% of Brook Park, OH residents are foreign-born (2.9% born in Asia, 1.6% born in Europe, 0.8% born in Africa), which is 32.4% greater than the foreign-born rate of 4.0% across the entire state of Ohio.
Race distribution in Brook Park
2000 2022
9,538,111 84.0% White alone 1,290,662 11.4% Black alone 217,123 1.9% Hispanic 137,770 1.2% Two or more races 131,670 1.2% Asian alone 21,985 0.2% American Indian alone 13,483 0.1% Other race alone 2,336 0.02% Native Hawaiian and Other
8,948,793 76.1% White alone 1,401,403 11.9% Black alone 529,291 4.5% Two or more races 517,232 4.4% Hispanic 293,387 2.5% Asian alone 52,805 0.4% Other race alone 9,785 0.08% American Indian alone 3,362 0.03% Native Hawaiian and Other
Income and house value in Brook Park Median household income in 2022 $63,782 White non-Hispanic householders$75,758 Black householders$93,275 Asian householders$50,458 Some other race householders$58,632 Two or more races householders$54,584 Hispanic or Latino race householdersMedian 2022 house value $162,823 White Non-Hispanic householders$156,728 Black or African American householders$199,539 American Indian or Alaska Native householders $171,966 Asian householders$213,615 Some other race householders$181,399 Two or more races householders$178,496 Hispanic or Latino householders
Median age by race in Brook Park
49.1 Median age for White residents47.8 50.6 25.3 Median age for Black or African American residents26.7 25.0 20.4 Median age for American Indian / Alaska Native residents27.2 -499,999,999.5 36.9 Median age for Asian residents46.0 36.0 -706,093,189.3 Median age for Native Hawaiian / Pacific Islander residents-750,242,953.6 -805,394,989.6 42.8 Median age for Other race residents44.8 43.2 16.1 Median age for Two or more races residents14.2 17.9 49.9 Median age for White alone residents49.2 51.6 30.0 Median age for Hispanic or Latino residents16.6 37.3
Owner/renter occupied households by race in Brook Park
House owners and renters - White residents 5,668 83.1% Owner occupied1,155 16.9% Renter occupiedHouse owners and renters - Black or African American residents 121 34.4% Owner occupied230 65.6% Renter occupiedHouse owners and renters - Asian residents 173 100.0% Owner occupiedHouse owners and renters - Native Hawaiian / Pacific Islander residents 1 100.0% Owner occupiedHouse owners and renters - Other race residents 145 73.4% Owner occupied52 26.6% Renter occupiedHouse owners and renters - Two or more races residents 223 74.9% Owner occupied75 25.1% Renter occupiedHouse owners and renters - White alone residents 5,605 83.4% Owner occupied1,118 16.6% Renter occupiedHouse owners and renters - Hispanic or Latino residents 338 71.2% Owner occupied137 28.8% Renter occupied
Language usage in Brook Park
English speakers - Total 91.2% of residents of Brook Park speak English at home.
2.2% of residents speak Spanish at home 246 65.8% Speak English very well128 34.2% Speak English less than very well6.4% of residents speak other language at home 555 51.1% Speak English very well532 48.9% Speak English less than very well
English speakers - Born in the United States 95.4% of residents of Brook Park speak English at home.
2.7% of residents speak Spanish at home 61 100.0% Speak English very well0.9% of residents speak other language at home 12 60.0% Speak English very well8 40.0% Speak English less than very well
English speakers - Native, born elsewhere 28.7% of residents of Brook Park speak English at home.
69.0% of residents speak Spanish at home 71 60.2% Speak English very well47 39.8% Speak English less than very well
English speakers - Foreign-born 13.0% of residents of Brook Park speak English at home.
3.0% of residents speak Spanish at home 20 64.5% Speak English very well11 35.5% Speak English less than very well80.4% of residents speak other language at home 343 41.2% Speak English very well490 58.8% Speak English less than very well
White (Caucasian) - Speak only English Native:
98.4% (13,427)Foreign-born:
30.8% (111)
White (Caucasian) - Speak another language Native:
2.0% (277)Foreign-born:
69.4% (250)
American Indian / Alaska Native - Speak only English Native:
89.9% (46)Foreign-born:
100.0% (10)
Asian - Speak only English Native:
64.6% (50)Foreign-born:
2.1% (10)
Asian - Speak another language Native:
33.3% (26)Foreign-born:
97.8% (461)
Two or more races - Speak only English Native:
85.7% (908)Foreign-born:
47.4% (13)
Two or more races - Speak another language Native:
12.5% (132)Foreign-born:
50.6% (14)
White alone - Speak only English Native:
98.0% (13,151)Foreign-born:
31.9% (113)
White alone - Speak another language Native:
1.8% (246)Foreign-born:
68.1% (241)
Hispanic or Latino - Speak only English Native:
68.9% (686)Foreign-born:
22.7% (12)
Hispanic or Latino - Speak another language Native:
32.0% (319)Foreign-born:
69.2% (37)
Foreign-born residents in Brook Park 1,078 residents are foreign born (2.9% Asia , 1.6% Europe , 0.8% Africa ).
Marital status for residents in Brook Park Marital status - White (Caucasian) population 15 years and over
Males 34.8% Never married45.9% Now married1.8% Separated5.1% Widowed12.5% DivorcedFemales 27.9% Never married45.3% Now married1.1% Separated12.8% Widowed12.9% DivorcedWomen who gave birth in the past 12 months Now married:
62.9% (156)Unmarried:
37.1% (92)
Women who did not give birth in the past 12 months Now married:
35.5% (912)Unmarried:
64.5% (1,654)
Marital status - Black or African American population 15 years and over
Males 30.2% Never married65.1% Now married0.3% Separated2.0% Widowed2.3% DivorcedFemales 22.9% Never married49.7% Now married0.0% Separated3.2% Widowed24.1% DivorcedWomen who gave birth in the past 12 months Now married:
100.0% (35)Unmarried:
0.0% (0)
Women who did not give birth in the past 12 months Now married:
48.6% (86)Unmarried:
51.4% (91)
Marital status - American Indian / Alaska Native population 15 years and over
Males 13.2% Never married68.4% Now married0.0% Separated0.0% Widowed18.4% DivorcedFemales 0.0% Never married100.0% Now married0.0% Separated0.0% Widowed0.0% DivorcedMarital status - Asian population 15 years and over
Males 25.9% Never married74.1% Now married0.0% Separated0.0% Widowed0.0% DivorcedFemales 32.7% Never married66.9% Now married0.0% Separated0.4% Widowed0.0% DivorcedWomen who gave birth in the past 12 months Now married:
100.0% (47)Unmarried:
0.0% (0)
Women who did not give birth in the past 12 months Now married:
64.5% (82)Unmarried:
35.5% (45)
Marital status - Other race population 15 years and over
Males 30.2% Never married16.3% Now married0.0% Separated41.9% Widowed11.6% DivorcedFemales 4.0% Never married0.0% Now married7.4% Separated0.0% Widowed88.6% DivorcedWomen who did not give birth in the past 12 months Now married:
0.0% (0)Unmarried:
100.0% (159)
Marital status - Two or more races population 15 years and over
Males 63.6% Never married21.0% Now married0.0% Separated6.2% Widowed9.3% DivorcedFemales 61.8% Never married22.5% Now married3.2% Separated0.4% Widowed12.1% DivorcedWomen who gave birth in the past 12 months Now married:
78.4% (34)Unmarried:
21.6% (9)
Women who did not give birth in the past 12 months Now married:
11.5% (29)Unmarried:
88.5% (226)
Marital status - White alone, not Hispanic / Latino population 15 years and over
Males 34.9% Never married46.2% Now married1.8% Separated5.2% Widowed11.9% DivorcedFemales 27.8% Never married44.8% Now married1.1% Separated13.0% Widowed13.2% DivorcedWomen who gave birth in the past 12 months Now married:
72.1% (142)Unmarried:
27.9% (55)
Women who did not give birth in the past 12 months Now married:
34.0% (870)Unmarried:
66.0% (1,688)
Marital status - Hispanic or Latino population 15 years and over
Males 37.7% Never married33.0% Now married0.0% Separated9.4% Widowed20.0% DivorcedFemales 23.0% Never married36.1% Now married4.5% Separated1.6% Widowed34.8% DivorcedWomen who gave birth in the past 12 months Now married:
31.7% (20)Unmarried:
68.3% (43)
Women who did not give birth in the past 12 months Now married:
36.2% (111)Unmarried:
63.8% (195)
Ancestries in Brook Park
769 11.3% American729 10.7% German649 9.5% Italian514 7.5% Polish455 6.7% Irish247 3.6% English223 3.3% Hungarian210 3.1% Slovak196 2.9% Ukrainian62 0.9% Czech60 0.9% African59 0.9% Slovene56 0.8% French54 0.8% Greek41 0.6% Croatian41 0.6% Scottish33 0.5% Arab28 0.4% Romanian26 0.4% Lebanese25 0.4% British20 0.3% Dutch18 0.3% European17 0.2% Belgian17 0.2% Scotch-Irish16 0.2% Czechoslovakian14 0.2% Swedish10 0.1% Portuguese8 0.1% Welsh6 0.09% French Canadian5 0.07% Latvian5 0.07% Northern European5 0.07% Russian5 0.07% U.S. Virgin Islander4 0.06% Egyptian4 0.06% Macedonian4 0.06% Slavic3 0.04% Canadian
Geographical mobility in Brook Park Same house 1 year ago 13,038 89.7% White (Caucasian)622 67.7% Black or African American50 82.5% American Indian / Alaska Native554 98.7% Asian30 100.0% Native Hawaiian / Pacific Islander242 86.0% Other race1,044 82.9% Two or more races12,825 90.1% White alone, not Hispanic / Latino1,000 81.3% Hispanic or LatinoMoved within same county 1,250 8.6% White / Caucasian211 23.0% Black or African American8 12.9% American Indian / Alaska Native5 1.9% Other race121 9.6% Two or more races1,181 8.3% White alone, not Hispanic / Latino167 13.6% Hispanic or LatinoMoved within same state 144 1.0% White / Caucasian27 3.0% Black or African American18 6.4% Other race121 0.9% White alone, not Hispanic / Latino39 3.2% Hispanic or LatinoMoved from different state 1 0.0% White / Caucasian55 6.0% Black or African American117 9.3% Two or more races1 0.0% White alone, not Hispanic / LatinoMoved from abroad 8 0.1% White10 0.1% White alone, not Hispanic / Latino
Children Nativity (place of birth) in Brook Park
Children under 6 years - Living with two parents Both parents native 825 100.0% NativeBoth parents foreign-born 121 100.0% NativeOne native, one foreign-born parent 21 100.0% NativeChildren under 6 years - Living with one parent Native parent 525 100.0% NativeChildren 6 to 17 years - Living with two parents Both parents native 873 100.0% NativeBoth parents foreign-born 57 50.3% Native56 49.7% Foreign-bornOne native, one foreign-born parent 15 100.0% NativeChildren 6 to 17 years - Living with one parent Native parent 876 100.0% Native
Grandparents responsible for own grandchildren in Brook Park
Grandparents (30 to 59 years) White / Caucasian 35 27.0% Responsible for grandchildren96 73.0% Not responsible for grandchildrenAsian 75 100.0% Not responsible for grandchildrenWhite alone, not Hispanic / Latino 37 28.2% Responsible for grandchildren95 71.8% Not responsible for grandchildrenGrandparents (60 years and over) White / Caucasian 27 17.3% Responsible for grandchildren131 82.7% Not responsible for grandchildrenWhite alone, not Hispanic / Latino 28 17.0% Responsible for grandchildren136 83.0% Not responsible for grandchildren