Races in Brookdale, New Jersey (NJ) Detailed Stats
Data:
Races - White alone (%)
Races - White alone (% change since 2000)
Races - Black alone (%)
Races - Black alone (% change since 2000)
Races - American Indian alone (%)
Races - American Indian alone (% change since 2000)
Races - Asian alone (%)
Races - Asian alone (% change since 2000)
Races - Hispanic (%)
Races - Hispanic (% change since 2000)
Races - Native Hawaiian and Other Pacific Islander alone (%)
Races - Native Hawaiian and Other Pacific Islander alone (% change since 2000)
Races - Two or more races(%)
Races - Two or more races(% change since 2000)
Races - Other race alone (%)
Races - Other race alone (% change since 2000)
Racial diversity
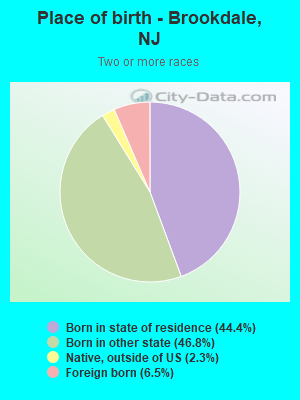
Place of birth - Born in state of residence (%)
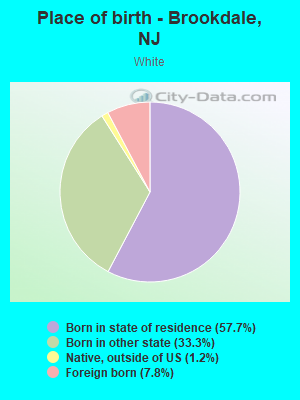
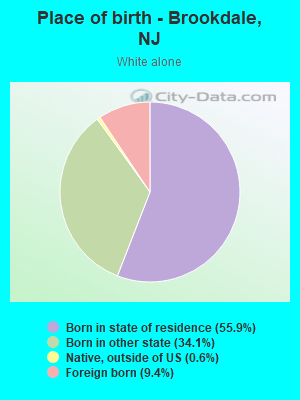
Place of birth - Born in state of residence (%) - White
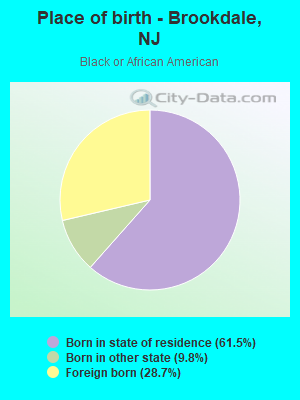
Place of birth - Born in state of residence (%) - Black or African American
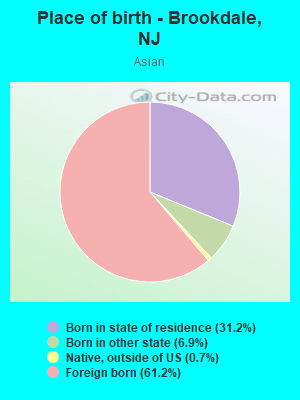
Place of birth - Born in state of residence (%) - Asian
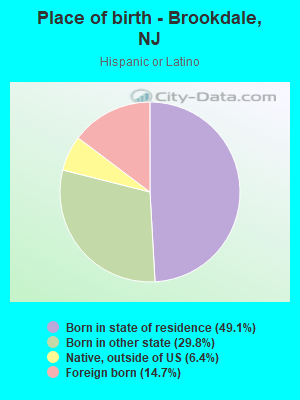
Place of birth - Born in state of residence (%) - Hispanic or Latino
Place of birth - Born in state of residence (%) - American Indian and Alaska Native
Place of birth - Born in state of residence (%) - Multirace
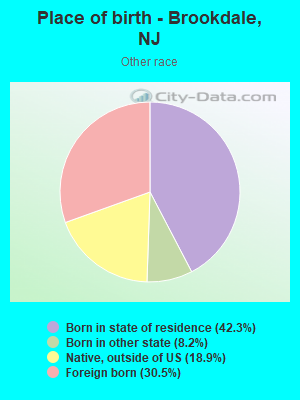
Place of birth - Born in state of residence (%) - Other Race
Place of birth - Born in other state (%)
Place of birth - Born in other state (%) - White
Place of birth - Born in other state (%) - Black or African American
Place of birth - Born in other state (%) - Asian
Place of birth - Born in other state (%) - Hispanic or Latino
Place of birth - Born in other state (%) - American Indian and Alaska Native
Place of birth - Born in other state (%) - Multirace
Place of birth - Born in other state (%) - Other Race
Place of birth - Native, outside of US (%)
Place of birth - Native, outside of US (%) - White
Place of birth - Native, outside of US (%) - Black or African American
Place of birth - Native, outside of US (%) - Asian
Place of birth - Native, outside of US (%) - Hispanic or Latino
Place of birth - Native, outside of US (%) - American Indian and Alaska Native
Place of birth - Native, outside of US (%) - Multirace
Place of birth - Native, outside of US (%) - Other Race
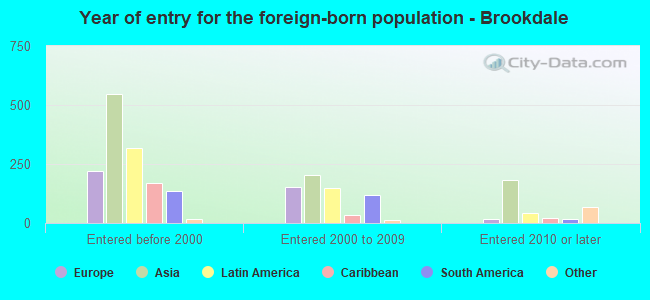
Place of birth - Foreign born (%)
Place of birth - Foreign born (%) - White
Place of birth - Foreign born (%) - Black or African American
Place of birth - Foreign born (%) - Asian
Place of birth - Foreign born (%) - Hispanic or Latino
Place of birth - Foreign born (%) - American Indian and Alaska Native
Place of birth - Foreign born (%) - Multirace
Place of birth - Foreign born (%) - Other Race
Residents speaking English at home (%)
Residents speaking English at home - Born in the United States (%)
Residents speaking English at home - Native, born elsewhere (%)
Residents speaking English at home - Foreign born (%)
Residents speaking Spanish at home (%)
Residents speaking Spanish at home - Born in the United States (%)
Residents speaking Spanish at home - Native, born elsewhere (%)
Residents speaking Spanish at home - Foreign born (%)
Residents speaking other language at home (%)
Residents speaking other language at home - Born in the United States (%)
Residents speaking other language at home - Native, born elsewhere (%)
Residents speaking other language at home - Foreign born (%)
Marital status - Never married (%)
Marital status - Now married (%)
Marital status - Separated (%)
Marital status - Widowed (%)
Marital status - Divorced (%)
Ancestries Reported - Arab (%)
Ancestries Reported - Czech (%)
Ancestries Reported - Danish (%)
Ancestries Reported - Dutch (%)
Ancestries Reported - English (%)
Ancestries Reported - French (%)
Ancestries Reported - French Canadian (%)
Ancestries Reported - German (%)
Ancestries Reported - Greek (%)
Ancestries Reported - Hungarian (%)
Ancestries Reported - Irish (%)
Ancestries Reported - Italian (%)
Ancestries Reported - Lithuanian (%)
Ancestries Reported - Norwegian (%)
Ancestries Reported - Polish (%)
Ancestries Reported - Portuguese (%)
Ancestries Reported - Russian (%)
Ancestries Reported - Scotch-Irish (%)
Ancestries Reported - Scottish (%)
Ancestries Reported - Slovak (%)
Ancestries Reported - Subsaharan African (%)
Ancestries Reported - Swedish (%)
Ancestries Reported - Swiss (%)
Ancestries Reported - Ukrainian (%)
Ancestries Reported - United States (%)
Ancestries Reported - Welsh (%)
Ancestries Reported - West Indian (%)
Ancestries Reported - Other (%)
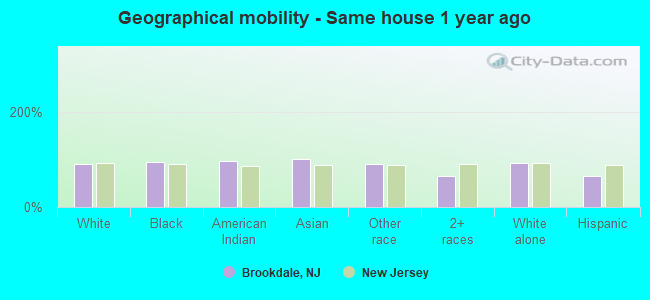
Geographical mobility - Same house 1 year ago (%)
Geographical mobility - Same house 1 year ago (%) - White
Geographical mobility - Same house 1 year ago (%) - Black or African American
Geographical mobility - Same house 1 year ago (%) - Asian
Geographical mobility - Same house 1 year ago (%) - Hispanic or Latino
Geographical mobility - Same house 1 year ago (%) - American Indian and Alaska Native
Geographical mobility - Same house 1 year ago (%) - Multirace
Geographical mobility - Same house 1 year ago (%) - Other Race
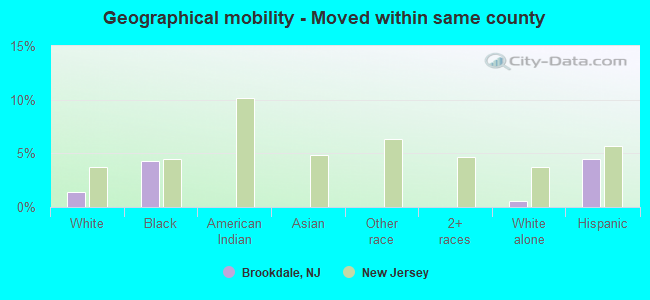
Geographical mobility - Moved within same county (%)
Geographical mobility - Moved within same county (%) - White
Geographical mobility - Moved within same county (%) - Black or African American
Geographical mobility - Moved within same county (%) - Asian
Geographical mobility - Moved within same county (%) - Hispanic or Latino
Geographical mobility - Moved within same county (%) - American Indian and Alaska Native
Geographical mobility - Moved within same county (%) - Multirace
Geographical mobility - Moved within same county (%) - Other Race
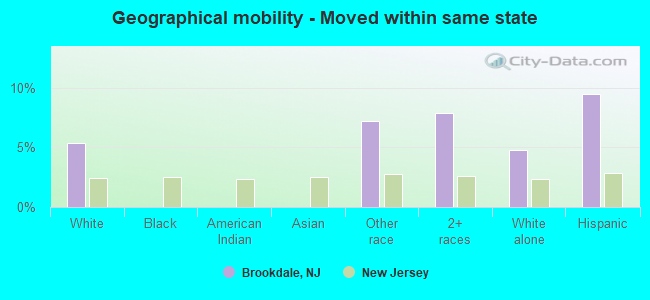
Geographical mobility - Moved from different county within same state (%)
Geographical mobility - Moved from different county within same state (%) - White
Geographical mobility - Moved from different county within same state (%) - Black or African American
Geographical mobility - Moved from different county within same state (%) - Asian
Geographical mobility - Moved from different county within same state (%) - Hispanic or Latino
Geographical mobility - Moved from different county within same state (%) - American Indian and Alaska Native
Geographical mobility - Moved from different county within same state (%) - Multirace
Geographical mobility - Moved from different county within same state (%) - Other Race
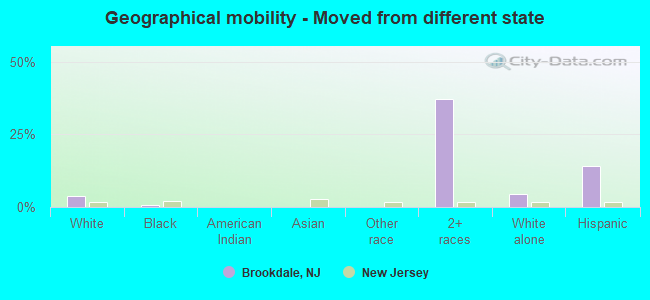
Geographical mobility - Moved from different state (%)
Geographical mobility - Moved from different state (%) - White
Geographical mobility - Moved from different state (%) - Black or African American
Geographical mobility - Moved from different state (%) - Asian
Geographical mobility - Moved from different state (%) - Hispanic or Latino
Geographical mobility - Moved from different state (%) - American Indian and Alaska Native
Geographical mobility - Moved from different state (%) - Multirace
Geographical mobility - Moved from different state (%) - Other Race
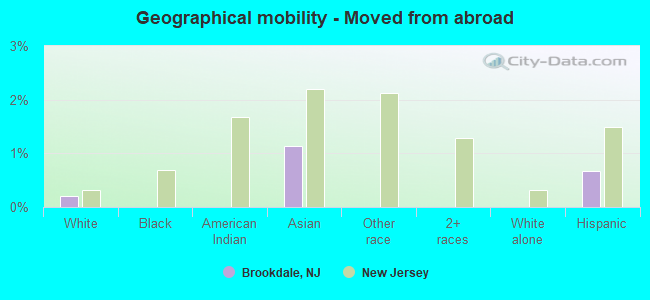
Geographical mobility - Moved from abroad (%)
Geographical mobility - Moved from abroad (%) - White
Geographical mobility - Moved from abroad (%) - Black or African American
Geographical mobility - Moved from abroad (%) - Asian
Geographical mobility - Moved from abroad (%) - Hispanic or Latino
Geographical mobility - Moved from abroad (%) - American Indian and Alaska Native
Geographical mobility - Moved from abroad (%) - Multirace
Geographical mobility - Moved from abroad (%) - Other Race
Place of birth for the foreign-born population - Ireland (%)
Place of birth for the foreign-born population - Denmark (%)
Place of birth for the foreign-born population - Norway (%)
Place of birth for the foreign-born population - Sweden (%)
Place of birth for the foreign-born population - United Kingdom (%)
Place of birth for the foreign-born population - England (%)
Place of birth for the foreign-born population - Scotland (%)
Place of birth for the foreign-born population - Other Northern Europe (%)
Place of birth for the foreign-born population - Austria (%)
Place of birth for the foreign-born population - Belgium (%)
Place of birth for the foreign-born population - France (%)
Place of birth for the foreign-born population - Germany (%)
Place of birth for the foreign-born population - Netherlands (%)
Place of birth for the foreign-born population - Switzerland (%)
Place of birth for the foreign-born population - Other Western Europe (%)
Place of birth for the foreign-born population - Greece (%)
Place of birth for the foreign-born population - Italy (%)
Place of birth for the foreign-born population - Portugal (%)
Place of birth for the foreign-born population - Spain (%)
Place of birth for the foreign-born population - Other Southern Europe (%)
Place of birth for the foreign-born population - Albania (%)
Place of birth for the foreign-born population - Belarus (%)
Place of birth for the foreign-born population - Bosnia and Herzegovina (%)
Place of birth for the foreign-born population - Bulgaria (%)
Place of birth for the foreign-born population - Croatia (%)
Place of birth for the foreign-born population - Czechoslovakia (%)
Place of birth for the foreign-born population - Hungary (%)
Place of birth for the foreign-born population - Latvia (%)
Place of birth for the foreign-born population - Lithuania (%)
Place of birth for the foreign-born population - North Macedonia (Macedonia) (%)
Place of birth for the foreign-born population - Moldova (%)
Place of birth for the foreign-born population - Poland (%)
Place of birth for the foreign-born population - Romania (%)
Place of birth for the foreign-born population - Russia (%)
Place of birth for the foreign-born population - Serbia (%)
Place of birth for the foreign-born population - Ukraine (%)
Place of birth for the foreign-born population - Other Eastern Europe (%)
Place of birth for the foreign-born population - China (%)
Place of birth for the foreign-born population - Hong Kong (%)
Place of birth for the foreign-born population - Taiwan (%)
Place of birth for the foreign-born population - Japan (%)
Place of birth for the foreign-born population - Korea (%)
Place of birth for the foreign-born population - Other Eastern Asia (%)
Place of birth for the foreign-born population - Afghanistan (%)
Place of birth for the foreign-born population - Bangladesh (%)
Place of birth for the foreign-born population - India (%)
Place of birth for the foreign-born population - Iran (%)
Place of birth for the foreign-born population - Kazakhstan (%)
Place of birth for the foreign-born population - Nepal (%)
Place of birth for the foreign-born population - Pakistan (%)
Place of birth for the foreign-born population - Sri Lanka (%)
Place of birth for the foreign-born population - Uzbekistan (%)
Place of birth for the foreign-born population - Other South Central Asia (%)
Place of birth for the foreign-born population - Burma (%)
Place of birth for the foreign-born population - Cambodia (%)
Place of birth for the foreign-born population - Indonesia (%)
Place of birth for the foreign-born population - Laos (%)
Place of birth for the foreign-born population - Malaysia (%)
Place of birth for the foreign-born population - Philippines (%)
Place of birth for the foreign-born population - Singapore (%)
Place of birth for the foreign-born population - Thailand (%)
Place of birth for the foreign-born population - Vietnam (%)
Place of birth for the foreign-born population - Other South Eastern Asia (%)
Place of birth for the foreign-born population - Armenia (%)
Place of birth for the foreign-born population - Iraq (%)
Place of birth for the foreign-born population - Israel (%)
Place of birth for the foreign-born population - Jordan (%)
Place of birth for the foreign-born population - Kuwait (%)
Place of birth for the foreign-born population - Lebanon (%)
Place of birth for the foreign-born population - Saudi Arabia (%)
Place of birth for the foreign-born population - Syria (%)
Place of birth for the foreign-born population - Turkey (%)
Place of birth for the foreign-born population - Yemen (%)
Place of birth for the foreign-born population - Other Western Asia (%)
Place of birth for the foreign-born population - Eritrea (%)
Place of birth for the foreign-born population - Ethiopia (%)
Place of birth for the foreign-born population - Kenya (%)
Place of birth for the foreign-born population - Somalia (%)
Place of birth for the foreign-born population - Uganda (%)
Place of birth for the foreign-born population - Zimbabwe (%)
Place of birth for the foreign-born population - Other Eastern Africa (%)
Place of birth for the foreign-born population - Cameroon (%)
Place of birth for the foreign-born population - Congo (%)
Place of birth for the foreign-born population - Democratic Republic of Congo (Zaire) (%)
Place of birth for the foreign-born population - Other Middle Africa (%)
Place of birth for the foreign-born population - Egypt (%)
Place of birth for the foreign-born population - Morocco (%)
Place of birth for the foreign-born population - Sudan (%)
Place of birth for the foreign-born population - Other Northern Africa (%)
Place of birth for the foreign-born population - South Africa (%)
Place of birth for the foreign-born population - Other Southern Africa (%)
Place of birth for the foreign-born population - Cabo Verde (%)
Place of birth for the foreign-born population - Ghana (%)
Place of birth for the foreign-born population - Liberia (%)
Place of birth for the foreign-born population - Nigeria (%)
Place of birth for the foreign-born population - Senegal (%)
Place of birth for the foreign-born population - Sierra Leone (%)
Place of birth for the foreign-born population - Other Western Africa (%)
Place of birth for the foreign-born population - Australia (%)
Place of birth for the foreign-born population - New Zealand (%)
Place of birth for the foreign-born population - Fiji (%)
Place of birth for the foreign-born population - Micronesia (%)
Place of birth for the foreign-born population - Bahamas (%)
Place of birth for the foreign-born population - Barbados (%)
Place of birth for the foreign-born population - Cuba (%)
Place of birth for the foreign-born population - Dominica (%)
Place of birth for the foreign-born population - Dominican Republic (%)
Place of birth for the foreign-born population - Grenada (%)
Place of birth for the foreign-born population - Haiti (%)
Place of birth for the foreign-born population - Jamaica (%)
Place of birth for the foreign-born population - St. Vincent and the Grenadines (%)
Place of birth for the foreign-born population - Trinidad and Tobago (%)
Place of birth for the foreign-born population - West Indies (%)
Place of birth for the foreign-born population - Other Caribbean (%)
Place of birth for the foreign-born population - Belize (%)
Place of birth for the foreign-born population - Costa Rica (%)
Place of birth for the foreign-born population - El Salvador (%)
Place of birth for the foreign-born population - Guatemala (%)
Place of birth for the foreign-born population - Honduras (%)
Place of birth for the foreign-born population - Mexico (%)
Place of birth for the foreign-born population - Nicaragua (%)
Place of birth for the foreign-born population - Panama (%)
Place of birth for the foreign-born population - Other Central America (%)
Place of birth for the foreign-born population - Argentina (%)
Place of birth for the foreign-born population - Bolivia (%)
Place of birth for the foreign-born population - Brazil (%)
Place of birth for the foreign-born population - Chile (%)
Place of birth for the foreign-born population - Colombia (%)
Place of birth for the foreign-born population - Ecuador (%)
Place of birth for the foreign-born population - Guyana (%)
Place of birth for the foreign-born population - Peru (%)
Place of birth for the foreign-born population - Uruguay (%)
Place of birth for the foreign-born population - Venezuela (%)
Place of birth for the foreign-born population - Other South America (%)
Place of birth for the foreign-born population - Canada (%)
Place of birth for the foreign-born population - Other Northern America (%)
Place of birth for the foreign-born population - Other (%)
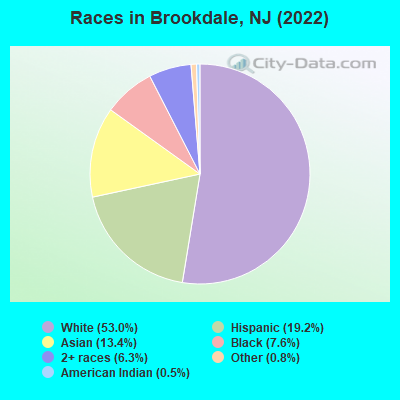
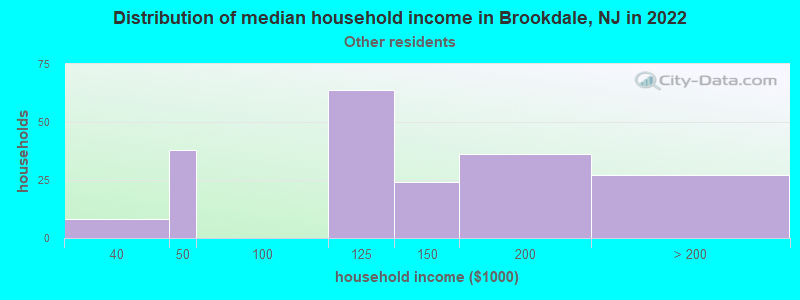
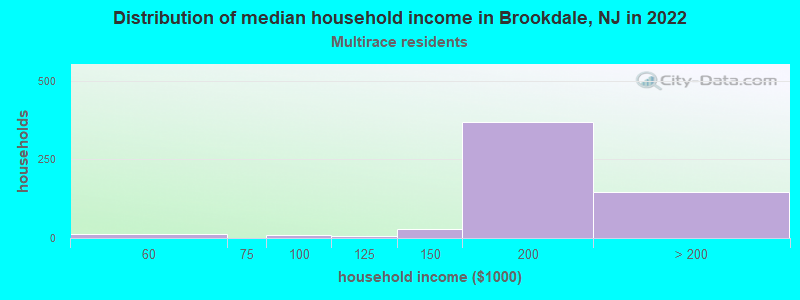
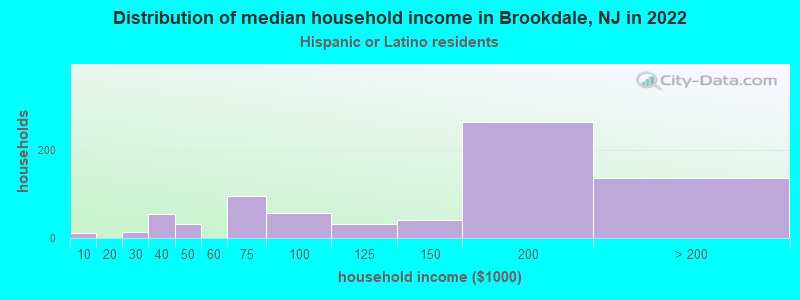
According to 2022 data, the most numerous races in Brookdale, NJ are White alone (5,443 residents), Hispanic (1,969 residents), and Black alone (781 residents). 72.0% of Brookdale residents speak English at home.
Race distribution in Brookdale 5,443 53.0% White alone 1,969 19.2% Hispanic 1,380 13.4% Asian alone 781 7.6% Black alone 651 6.3% Two or more races 81 0.8% Other race alone 52 0.5% American Indian alone
2000 2022
5,557,209 66.0% White alone 1,117,191 13.3% Hispanic 1,096,171 13.0% Black alone 477,012 5.7% Asian alone 133,689 1.6% Two or more races 19,565 0.2% Other race alone 11,338 0.1% American Indian alone 2,175 0.03% Native Hawaiian and Other
4,766,476 51.5% White alone 2,028,470 21.9% Hispanic 1,111,632 12.0% Black alone 923,546 10.0% Asian alone 332,237 3.6% Two or more races 89,847 1.0% Other race alone 8,557 0.09% American Indian alone 934 0.01% Native Hawaiian and Other
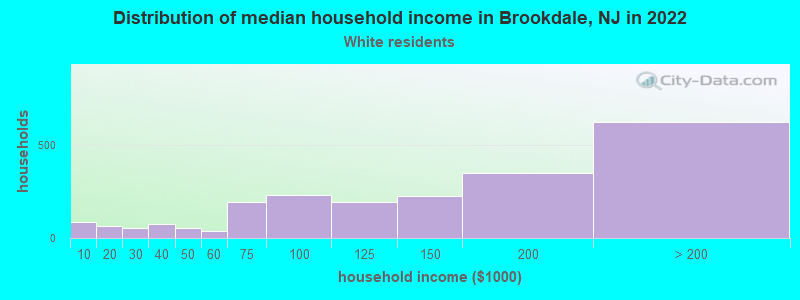
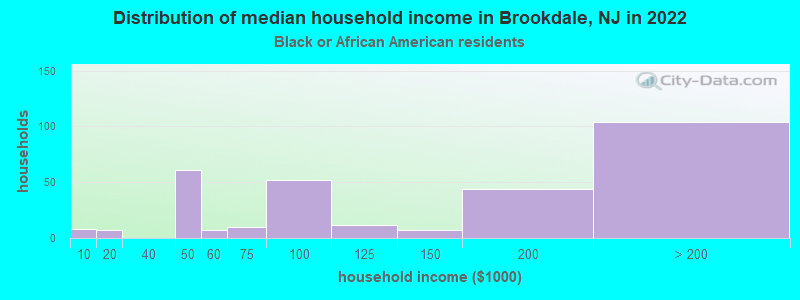
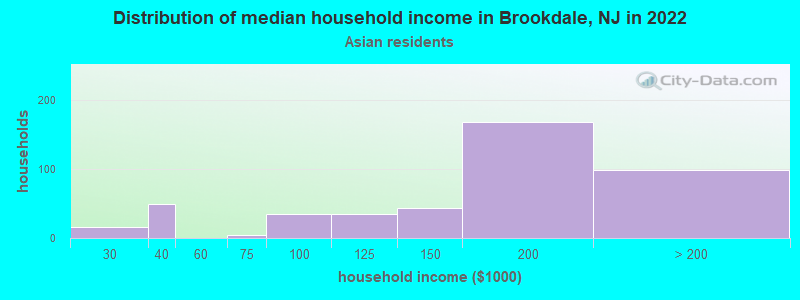
Income and house value in Brookdale Median household income in 2022 $141,224 White non-Hispanic householders$134,630 Black householders$162,198 Asian householders$126,594 Some other race householdersover $200,000 Two or more races householders$164,169 Hispanic or Latino race householders
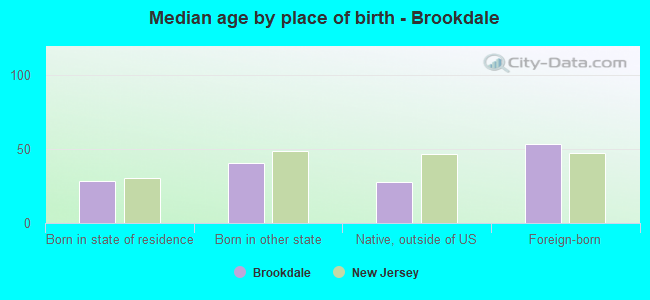
Median age by race in Brookdale
44.3 Median age for White residents45.0 43.7 27.6 Median age for Black or African American residents18.9 32.1 68.9 Median age for American Indian / Alaska Native residents-723,484,847.8 -684,973,302.1 42.4 Median age for Asian residents40.7 48.7 -804,177,544.9 Median age for Native Hawaiian / Pacific Islander residents-860,335,194.7 -713,070,378.3 45.0 Median age for Other race residents53.6 39.8 16.2 Median age for Two or more races residents28.0 5.0 44.9 Median age for White alone residents45.1 44.5 29.0 Median age for Hispanic or Latino residents34.4 14.1
Owner/renter occupied households by race in Brookdale
House owners and renters - White residents 2,025 90.2% Owner occupied219 9.8% Renter occupiedHouse owners and renters - Black or African American residents 199 68.9% Owner occupied90 31.1% Renter occupiedHouse owners and renters - American Indian / Alaska Native residents 34 100.0% Owner occupiedHouse owners and renters - Asian residents 371 83.5% Owner occupied73 16.5% Renter occupiedHouse owners and renters - Other race residents 209 92.6% Owner occupied17 7.4% Renter occupiedHouse owners and renters - Two or more races residents 472 94.9% Owner occupied25 5.1% Renter occupiedHouse owners and renters - White alone residents 1,964 91.3% Owner occupied187 8.7% Renter occupiedHouse owners and renters - Hispanic or Latino residents 601 80.6% Owner occupied144 19.4% Renter occupied
Language usage in Brookdale
English speakers - Total 72.0% of residents of Brookdale speak English at home.
10.2% of residents speak Spanish at home 772 81.5% Speak English very well175 18.5% Speak English less than very well18.2% of residents speak other language at home 1,305 77.4% Speak English very well382 22.6% Speak English less than very well
English speakers - Born in the United States 84.8% of residents of Brookdale speak English at home.
8.8% of residents speak Spanish at home 179 81.4% Speak English very well41 18.6% Speak English less than very well5.9% of residents speak other language at home 148 100.0% Speak English very well
English speakers - Native, born elsewhere 42.3% of residents of Brookdale speak English at home.
53.1% of residents speak Spanish at home 93 82.3% Speak English very well20 17.7% Speak English less than very well3.8% of residents speak other language at home 8 100.0% Speak English very well
English speakers - Foreign-born 22.8% of residents of Brookdale speak English at home.
12.8% of residents speak Spanish at home 180 71.1% Speak English very well73 28.9% Speak English less than very well63.4% of residents speak other language at home 876 69.7% Speak English very well381 30.3% Speak English less than very well
White (Caucasian) - Speak only English Native:
97.1% (4,643)Foreign-born:
13.0% (56)
White (Caucasian) - Speak another language Native:
5.8% (277)Foreign-born:
83.6% (363)
Black or African American - Speak only English Native:
97.5% (413)Foreign-born:
64.0% (146)
Black or African American - Speak another language Native:
2.6% (11)Foreign-born:
38.0% (87)
Asian - Speak only English Native:
66.1% (323)Foreign-born:
18.7% (165)
Asian - Speak another language Native:
33.7% (165)Foreign-born:
81.2% (715)
Other race - Speak only English Native:
54.1% (162)Foreign-born:
18.6% (24)
Other race - Speak another language Native:
46.7% (139)Foreign-born:
84.0% (107)
Two or more races - Speak only English Native:
55.6% (652)Foreign-born:
31.8% (37)
Two or more races - Speak another language Native:
44.3% (520)Foreign-born:
67.2% (78)
White alone - Speak only English Native:
95.5% (4,499)Foreign-born:
11.7% (60)
White alone - Speak another language Native:
4.7% (221)Foreign-born:
87.1% (447)
Hispanic or Latino - Speak only English Native:
46.0% (564)Foreign-born:
6.2% (17)
Hispanic or Latino - Speak another language Native:
55.4% (679)Foreign-born:
93.1% (259)
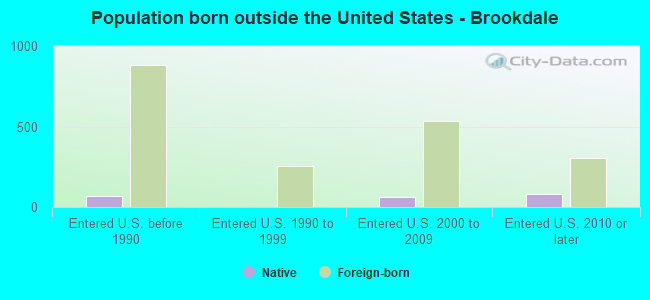
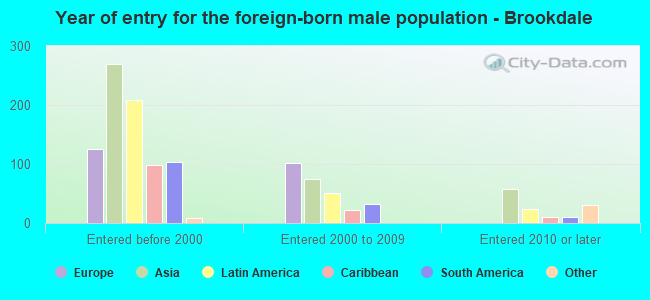
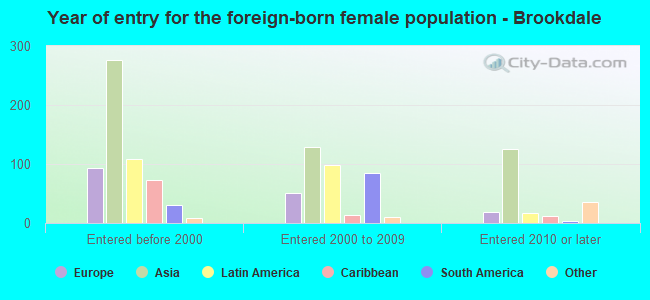
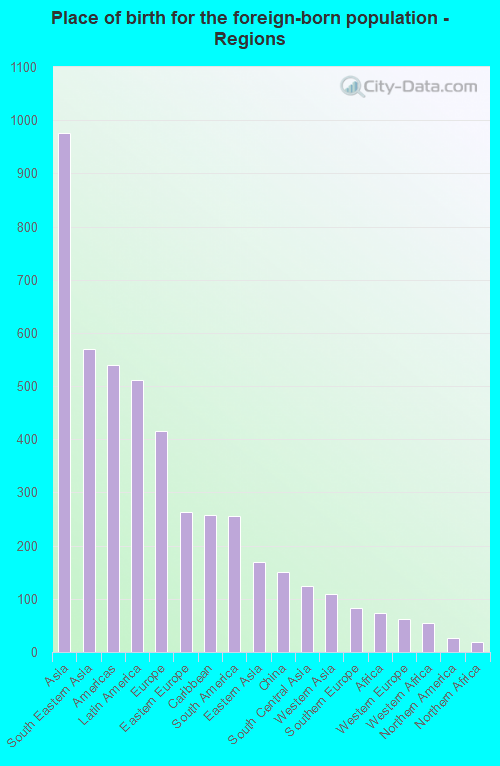
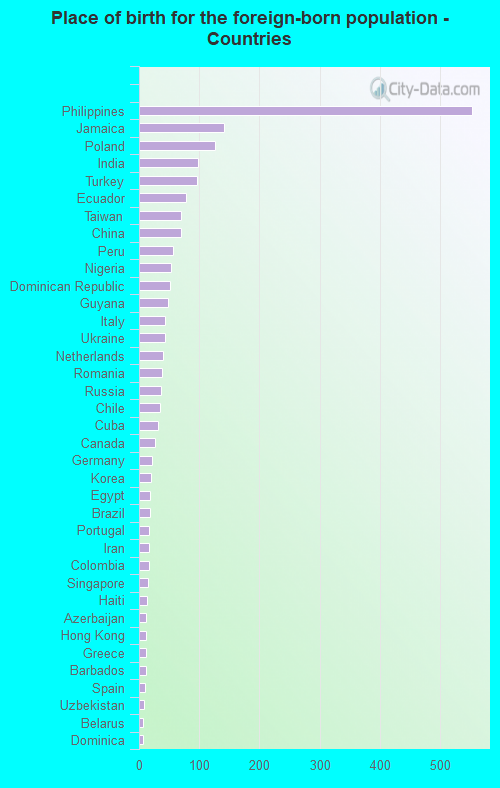
Foreign-born residents in Brookdale
Marital status for residents in Brookdale Marital status - White (Caucasian) population 15 years and over
Males 29.6% Never married60.9% Now married1.3% Separated3.6% Widowed4.6% DivorcedFemales 27.5% Never married51.5% Now married2.1% Separated10.5% Widowed8.4% DivorcedWomen who gave birth in the past 12 months Now married:
90.3% (78)Unmarried:
9.7% (8)
Women who did not give birth in the past 12 months Now married:
48.8% (549)Unmarried:
51.2% (577)
Marital status - Black or African American population 15 years and over
Males 7.4% Never married87.0% Now married5.7% Separated0.0% Widowed0.0% DivorcedFemales 52.4% Never married40.5% Now married0.0% Separated0.0% Widowed7.1% DivorcedWomen who gave birth in the past 12 months Now married:
100.0% (42)Unmarried:
0.0% (0)
Women who did not give birth in the past 12 months Now married:
30.3% (83)Unmarried:
69.7% (191)
Marital status - American Indian / Alaska Native population 15 years and over
Males 0.0% Never married100.0% Now married0.0% Separated0.0% Widowed0.0% DivorcedFemales 0.0% Never married61.0% Now married0.0% Separated0.0% Widowed39.0% DivorcedMarital status - Asian population 15 years and over
Males 37.4% Never married60.7% Now married0.0% Separated0.0% Widowed1.9% DivorcedFemales 19.9% Never married64.6% Now married0.0% Separated13.4% Widowed2.2% DivorcedWomen who did not give birth in the past 12 months Now married:
66.1% (190)Unmarried:
33.9% (98)
Marital status - Other race population 15 years and over
Males 23.7% Never married75.5% Now married0.0% Separated0.0% Widowed0.7% DivorcedFemales 22.1% Never married67.3% Now married0.0% Separated0.0% Widowed10.6% DivorcedWomen who did not give birth in the past 12 months Now married:
76.4% (55)Unmarried:
23.6% (17)
Marital status - Two or more races population 15 years and over
Males 31.5% Never married65.5% Now married0.0% Separated0.0% Widowed3.0% DivorcedFemales 39.3% Never married43.1% Now married0.0% Separated1.1% Widowed16.5% DivorcedWomen who gave birth in the past 12 months Now married:
100.0% (23)Unmarried:
0.0% (0)
Women who did not give birth in the past 12 months Now married:
36.1% (108)Unmarried:
63.9% (192)
Marital status - White alone, not Hispanic / Latino population 15 years and over
Males 29.9% Never married60.2% Now married1.4% Separated3.9% Widowed4.6% DivorcedFemales 29.1% Never married51.3% Now married1.7% Separated11.1% Widowed6.9% DivorcedWomen who gave birth in the past 12 months Now married:
86.5% (62)Unmarried:
13.5% (10)
Women who did not give birth in the past 12 months Now married:
47.3% (566)Unmarried:
52.7% (630)
Marital status - Hispanic or Latino population 15 years and over
Males 26.5% Never married72.0% Now married0.0% Separated0.0% Widowed1.5% DivorcedFemales 12.9% Never married51.5% Now married2.7% Separated2.5% Widowed30.3% DivorcedWomen who gave birth in the past 12 months Now married:
100.0% (47)Unmarried:
0.0% (0)
Women who did not give birth in the past 12 months Now married:
56.8% (162)Unmarried:
43.2% (123)
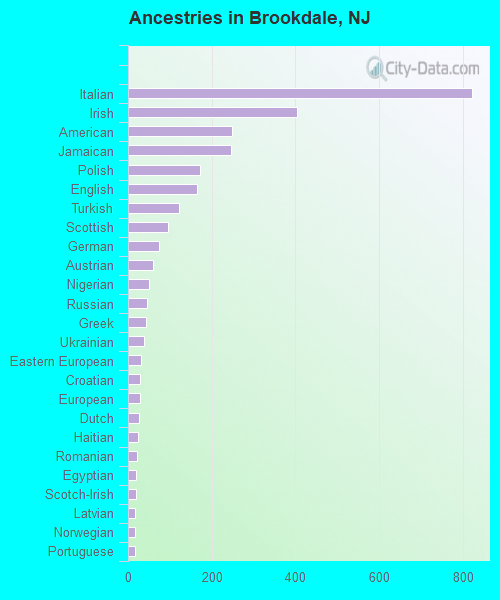
Ancestries in Brookdale
822 15.9% Italian405 7.8% Irish249 4.8% American247 4.8% Jamaican172 3.3% Polish166 3.2% English121 2.3% Turkish95 1.8% Scottish73 1.4% German59 1.1% Austrian51 1.0% Nigerian46 0.9% Russian44 0.9% Greek39 0.8% Ukrainian31 0.6% Eastern European29 0.6% Croatian29 0.6% European26 0.5% Dutch24 0.5% Haitian21 0.4% Romanian18 0.3% Egyptian18 0.3% Scotch-Irish16 0.3% Latvian16 0.3% Norwegian16 0.3% Portuguese15 0.3% Barbadian13 0.3% Guyanese13 0.3% Yugoslavian11 0.2% Hungarian11 0.2% Iranian8 0.2% Slovak8 0.2% Scandinavian6 0.1% Welsh5 0.10% Danish
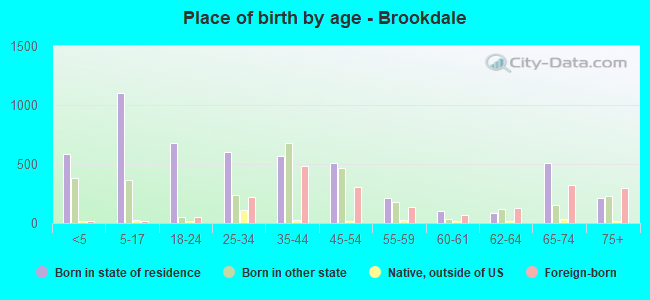
Children Nativity (place of birth) in Brookdale
Children under 6 years - Living with two parents Both parents native 668 100.0% NativeBoth parents foreign-born 121 100.0% NativeOne native, one foreign-born parent 221 100.0% NativeChildren under 6 years - Living with one parent Native parent 54 100.0% NativeForeign-born parent 29 100.0% NativeChildren 6 to 17 years - Living with two parents Both parents native 784 100.0% NativeBoth parents foreign-born 250 97.5% Native6 2.5% Foreign-bornOne native, one foreign-born parent 184 100.0% NativeChildren 6 to 17 years - Living with one parent Native parent 204 100.0% NativeForeign-born parent 58 53.4% Native51 46.6% Foreign-born
Grandparents responsible for own grandchildren in Brookdale
Grandparents (30 to 59 years) American Indian / Alaska Native 104 100.0% Not responsible for grandchildren
Grandparents (60 years and over)