Races in Brookings, South Dakota (SD) Detailed Stats
Ancestries, Foreign-born residents, place of birth
Settings
X


Recent posts about races in Brookings, South Dakota on our local forum with over 2,400,000 registered users:

Latest news about races in Brookings, SD collected exclusively by city-data.com from local newspapers, TV, and radio stations
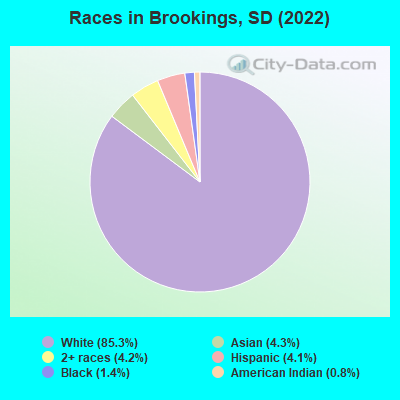
According to 2022 data, the most numerous races in Brookings, SD are White alone (20,512 residents), American Indian alone (199 residents), and Hispanic (982 residents). 90.0% of Brookings residents speak English at home. 6.7% of Brookings, SD residents are foreign-born (4.2% born in Asia, 1.4% born in Africa), which is 55.1% greater than the foreign-born rate of 3.0% across the entire state of South Dakota.
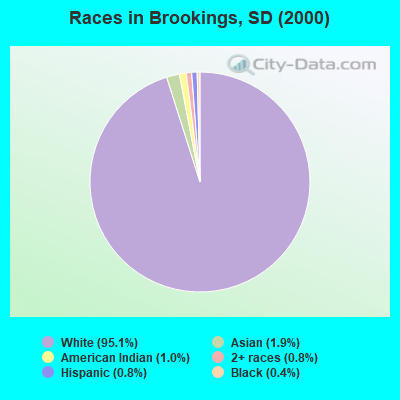
Race distribution in Brookings
2000
2022

- 17,59895.1%White alone
- 3471.9%Asian alone
- 1771.0%American Indian alone
- 1390.8%Hispanic
- 1410.8%Two or more races
- 790.4%Black alone
- 140.08%Other race alone
- 90.05%Native Hawaiian and Other
Pacific Islander alone
-
- 20,51285.3%White alone
- 1,0354.3%Asian alone
- 9984.2%Two or more races
- 9824.1%Hispanic
- 3441.4%Black alone
- 1990.8%American Indian alone
2000
2022
-
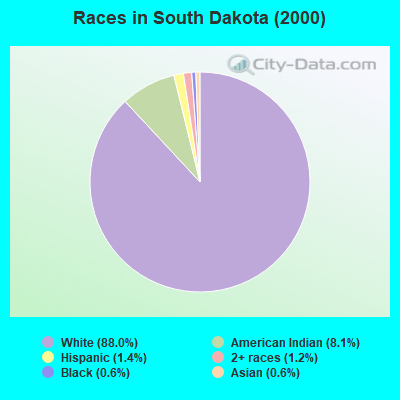
- 664,58588.0%White alone
- 60,9888.1%American Indian alone
- 10,9031.4%Hispanic
- 8,9601.2%Two or more races
- 4,5630.6%Black alone
- 4,3160.6%Asian alone
- 3100.04%Other race alone
- 2190.03%Native Hawaiian and Other
Pacific Islander alone
-
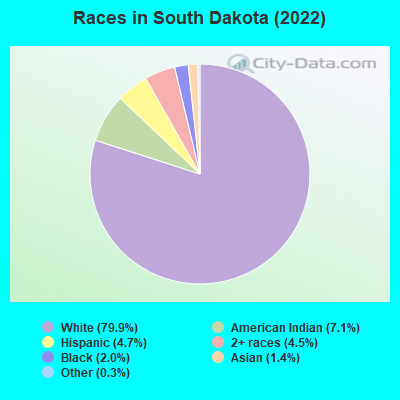
- 726,88579.9%White alone
- 64,6667.1%American Indian alone
- 42,4304.7%Hispanic
- 40,9844.5%Two or more races
- 18,0532.0%Black alone
- 12,8741.4%Asian alone
- 3,1360.3%Other race alone
- 7960.09%Native Hawaiian and Other
Pacific Islander alone
Income and house value in Brookings
- Median household income in 2022
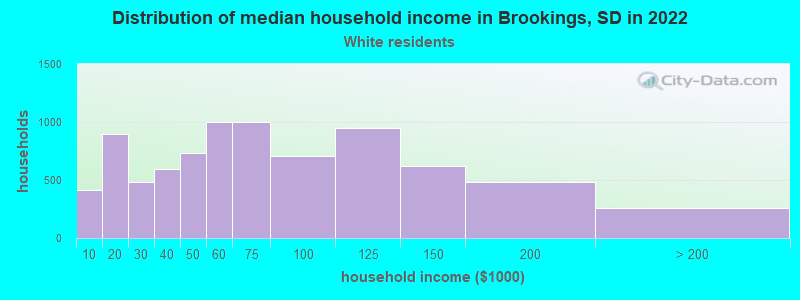
- $59,403White non-Hispanic householders
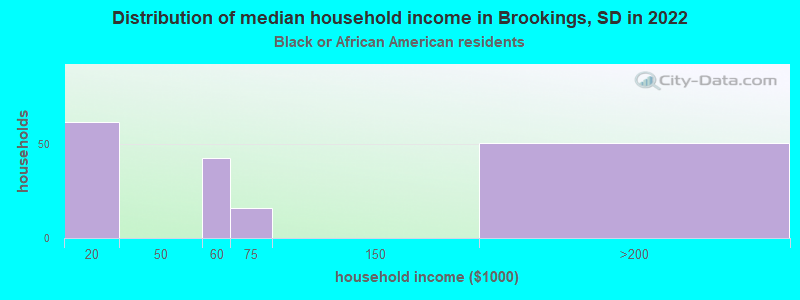
- $59,477Black householders
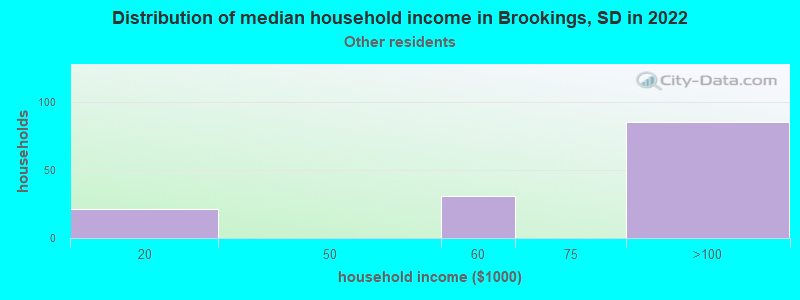
- $90,240Some other race householders
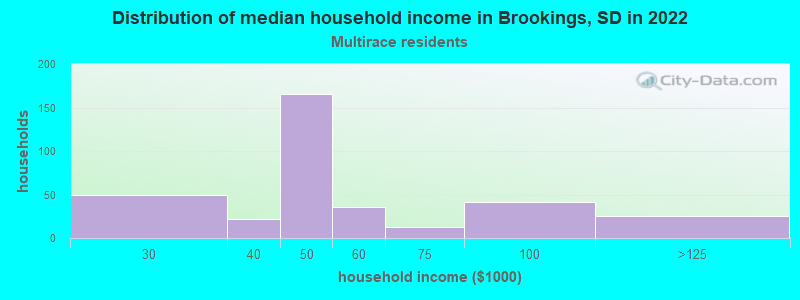
- $36,942Two or more races householders
- Median 2022 house value
- $259,496White Non-Hispanic householders
- $262,257Black or African American householders
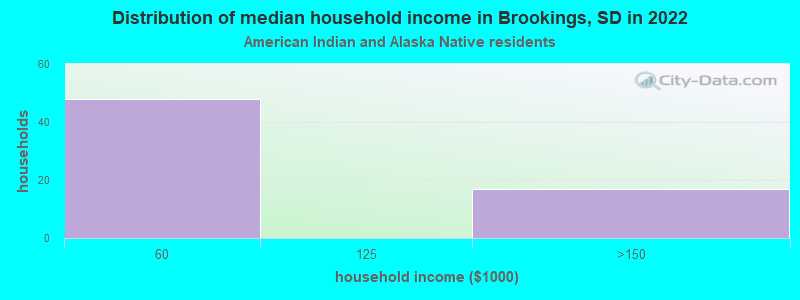
- $234,651American Indian or Alaska Native householders
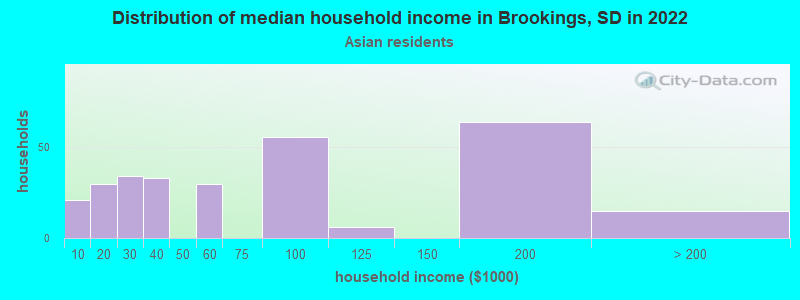
- $293,451Asian householders
- $234,651Two or more races householders
Household income for White non-Hispanic householders
Household income for Black householders
Household income for American Indian and Alaska Native householders
Household income for Asian householders
Household income for Some other race householders
Household income for Two or more races householders
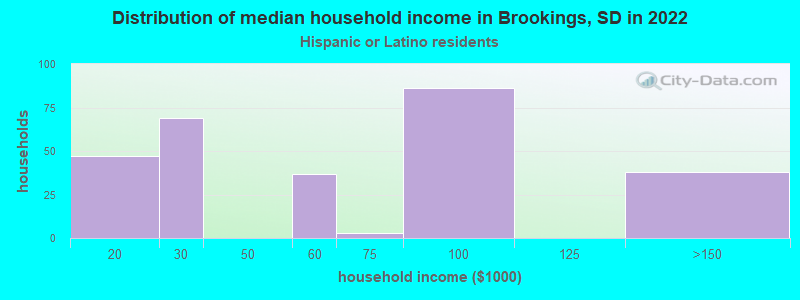
Household income for Hispanic or Latino race householders
Median age by race in Brookings
- 24.9Median age for White residents
- 24.8Males
- 24.9Females
- 35.2Median age for Black or African American residents
- 44.4Males
- 19.0Females
- 37.5Median age for American Indian / Alaska Native residents
- 26.2Males
- 37.0Females
- 23.8Median age for Asian residents
- 24.6Males
- 25.9Females
- -1,333,333,332.0Median age for Native Hawaiian / Pacific Islander residents
- -1,038,202,246.2Males
- -670,599,802.7Females
- 26.8Median age for Other race residents
- 22.1Males
- 29.9Females
- 23.0Median age for Two or more races residents
- 20.8Males
- 24.1Females
- 24.8Median age for White alone residents
- 24.8Males
- 24.7Females
- 24.7Median age for Hispanic or Latino residents
- 20.2Males
- 25.2Females
Owner/renter occupied households by race in Brookings
- House owners and renters - White residents
- 4,09951.1%Owner occupied
- 3,91648.9%Renter occupied
- House owners and renters - Black or African American residents
- 9953.2%Owner occupied
- 8746.8%Renter occupied
- House owners and renters - American Indian / Alaska Native residents
- 3343.8%Owner occupied
- 4256.2%Renter occupied
- House owners and renters - Asian residents
- 9029.9%Owner occupied
- 21070.1%Renter occupied
- House owners and renters - Other race residents
- 202100.0%Renter occupied
- House owners and renters - Two or more races residents
- 15146.7%Owner occupied
- 17253.3%Renter occupied
- House owners and renters - White alone residents
- 4,10451.3%Owner occupied
- 3,89648.7%Renter occupied
- House owners and renters - Hispanic or Latino residents
- 4517.6%Owner occupied
- 21382.4%Renter occupied
Language usage in Brookings
- English speakers - Total
- 90.0% of residents of Brookings speak English at home.
- 3.1% of residents speak Spanish at home
- 42460.4%Speak English very well
- 27839.6%Speak English less than very well
- 7.4% of residents speak other language at home
- 1,42883.8%Speak English very well
- 27616.2%Speak English less than very well
- English speakers - Born in the United States
- 93.9% of residents of Brookings speak English at home.
- 3.6% of residents speak Spanish at home
- 34796.1%Speak English very well
- 143.9%Speak English less than very well
- 3.0% of residents speak other language at home
- 27792.3%Speak English very well
- 237.7%Speak English less than very well
- English speakers - Native, born elsewhere
- 19.5% of residents of Brookings speak English at home.
- 83.4% of residents speak Spanish at home
- 5519.2%Speak English very well
- 23180.8%Speak English less than very well
- English speakers - Foreign-born
- 19.6% of residents of Brookings speak English at home.
- 6.3% of residents speak Spanish at home
- 5458.1%Speak English very well
- 3941.9%Speak English less than very well
- 62.2% of residents speak other language at home
- 67373.5%Speak English very well
- 24326.5%Speak English less than very well
White (Caucasian) - Speak only English
| Native: | 98.3% (19,103) |
| Foreign-born: | 41.8% (98) |
White (Caucasian) - Speak another language
| Native: | 1.5% (292) |
| Foreign-born: | 58.3% (136) |
Black or African American - Speak only English
| Native: | 100.0% (122) |
| Foreign-born: | 49.1% (74) |
American Indian / Alaska Native - Speak only English
| Native: | 48.0% (183) |
| Foreign-born: | 81.2% (27) |
Asian - Speak only English
| Native: | 6.2% (11) |
| Foreign-born: | 8.7% (69) |
Asian - Speak another language
| Native: | 100.0% (172) |
| Foreign-born: | 96.3% (763) |
Other race - Speak another language
| Native: | 100.0% (374) |
| Foreign-born: | 100.0% (73) |
Two or more races - Speak another language
| Native: | 5.3% (51) |
| Foreign-born: | 100.0% (96) |
White alone - Speak only English
| Native: | 98.5% (19,011) |
| Foreign-born: | 36.1% (101) |
White alone - Speak another language
| Native: | 1.3% (242) |
| Foreign-born: | 64.2% (180) |
Hispanic or Latino - Speak only English
| Native: | 29.1% (214) |
| Foreign-born: | 13.7% (17) |
Hispanic or Latino - Speak another language
| Native: | 76.8% (563) |
| Foreign-born: | 83.9% (104) |
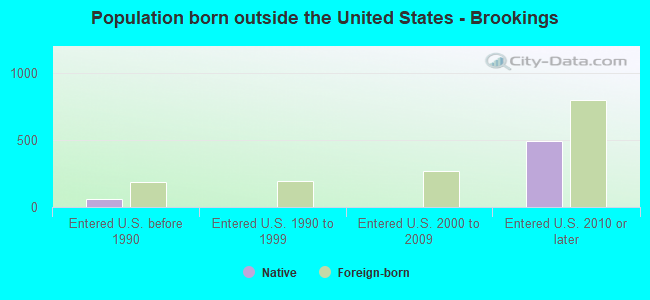
Foreign-born residents in Brookings
1,605 residents are foreign born (4.2% Asia, 1.4% Africa).
| This city: | 6.7% |
| South Dakota: | 3.8% |

Marital status for residents in Brookings
Marital status - White (Caucasian) population 15 years and over
- Males
- 59.8%Never married
- 32.0%Now married
- 0.6%Separated
- 2.3%Widowed
- 5.3%Divorced
- Females
- 53.5%Never married
- 33.1%Now married
- 1.3%Separated
- 4.6%Widowed
- 7.5%Divorced
Women who gave birth in the past 12 months
| Now married: | 100.0% (125) |
| Unmarried: | 0.0% (0) |
Women who did not give birth in the past 12 months
| Now married: | 23.0% (1,394) |
| Unmarried: | 77.0% (4,667) |
Marital status - Black or African American population 15 years and over
- Males
- 47.8%Never married
- 52.2%Now married
- 0.0%Separated
- 0.0%Widowed
- 0.0%Divorced
- Females
- 76.0%Never married
- 24.0%Now married
- 0.0%Separated
- 0.0%Widowed
- 0.0%Divorced
Women who did not give birth in the past 12 months
| Now married: | 24.0% (28) |
| Unmarried: | 76.0% (88) |
Marital status - American Indian / Alaska Native population 15 years and over
- Males
- 51.8%Never married
- 38.2%Now married
- 0.0%Separated
- 10.0%Widowed
- 0.0%Divorced
- Females
- 60.5%Never married
- 38.1%Now married
- 0.0%Separated
- 0.0%Widowed
- 1.4%Divorced
Women who gave birth in the past 12 months
| Now married: | 0.0% (0) |
| Unmarried: | 100.0% (8) |
Women who did not give birth in the past 12 months
| Now married: | 35.1% (60) |
| Unmarried: | 64.9% (112) |
Marital status - Asian population 15 years and over
- Males
- 73.6%Never married
- 26.2%Now married
- 0.0%Separated
- 0.0%Widowed
- 0.2%Divorced
- Females
- 46.0%Never married
- 54.0%Now married
- 0.0%Separated
- 0.0%Widowed
- 0.0%Divorced
Women who did not give birth in the past 12 months
| Now married: | 48.7% (176) |
| Unmarried: | 51.3% (186) |
Marital status - Other race population 15 years and over
- Males
- 65.8%Never married
- 34.2%Now married
- 0.0%Separated
- 0.0%Widowed
- 0.0%Divorced
- Females
- 68.8%Never married
- 31.2%Now married
- 0.0%Separated
- 0.0%Widowed
- 0.0%Divorced
Women who did not give birth in the past 12 months
| Now married: | 15.7% (23) |
| Unmarried: | 84.3% (126) |
Marital status - Two or more races population 15 years and over
- Males
- 78.1%Never married
- 8.3%Now married
- 0.0%Separated
- 0.0%Widowed
- 13.7%Divorced
- Females
- 65.3%Never married
- 23.4%Now married
- 0.0%Separated
- 0.0%Widowed
- 11.3%Divorced
Women who did not give birth in the past 12 months
| Now married: | 21.1% (67) |
| Unmarried: | 78.9% (250) |
Marital status - White alone, not Hispanic / Latino population 15 years and over
- Males
- 59.7%Never married
- 32.3%Now married
- 0.6%Separated
- 2.3%Widowed
- 5.1%Divorced
- Females
- 53.2%Never married
- 33.3%Now married
- 1.3%Separated
- 4.7%Widowed
- 7.5%Divorced
Women who gave birth in the past 12 months
| Now married: | 100.0% (126) |
| Unmarried: | 0.0% (0) |
Women who did not give birth in the past 12 months
| Now married: | 23.1% (1,399) |
| Unmarried: | 76.9% (4,648) |
Marital status - Hispanic or Latino population 15 years and over
- Males
- 60.9%Never married
- 28.8%Now married
- 0.0%Separated
- 0.0%Widowed
- 10.3%Divorced
- Females
- 62.3%Never married
- 37.7%Now married
- 0.0%Separated
- 0.0%Widowed
- 0.0%Divorced
Women who did not give birth in the past 12 months
| Now married: | 32.8% (115) |
| Unmarried: | 67.2% (235) |
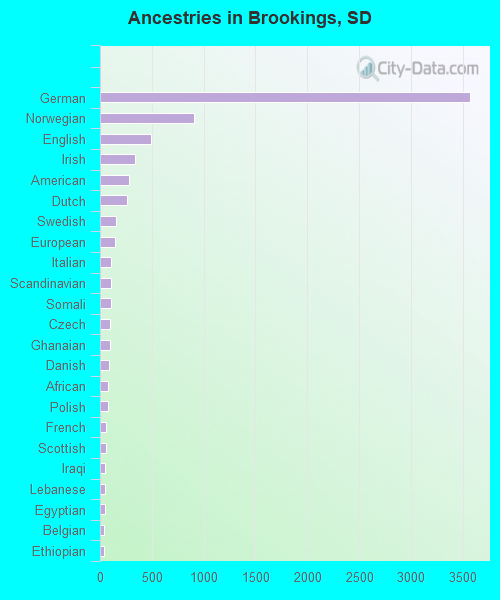
Ancestries in Brookings

- 3,57438.6%German
- 9059.8%Norwegian
- 4945.3%English
- 3403.7%Irish
- 2753.0%American
- 2572.8%Dutch
- 1511.6%Swedish
- 1451.6%European
- 1061.1%Italian
- 1021.1%Scandinavian
- 1021.1%Somali
- 981.1%Czech
- 941.0%Ghanaian
- 840.9%Danish
- 760.8%African
- 730.8%Polish
- 590.6%French
- 580.6%Scottish
- 530.6%Iraqi
- 520.6%Lebanese
- 510.6%Egyptian
- 430.5%Belgian
- 380.4%Ethiopian
- 300.3%Scotch-Irish
- 250.3%Brazilian
- 230.2%Ukrainian
- 190.2%Finnish
- 140.2%Armenian
- 110.1%Jamaican
- 100.1%Austrian
- 80.09%Welsh
- 70.08%British
- 70.08%Haitian
- 40.04%Yugoslavian
- 40.04%Palestinian
- 30.03%Croatian
- 20.02%Hungarian
- 10.01%Greek
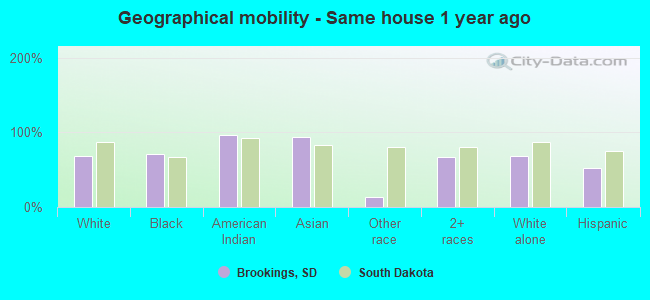
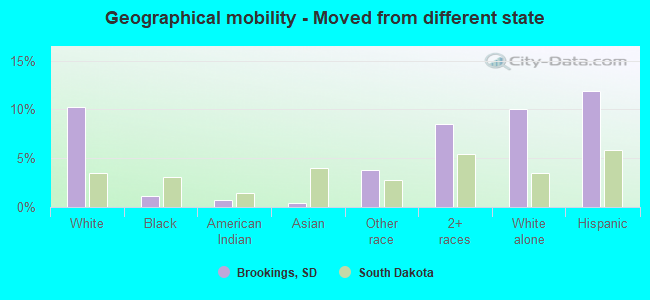
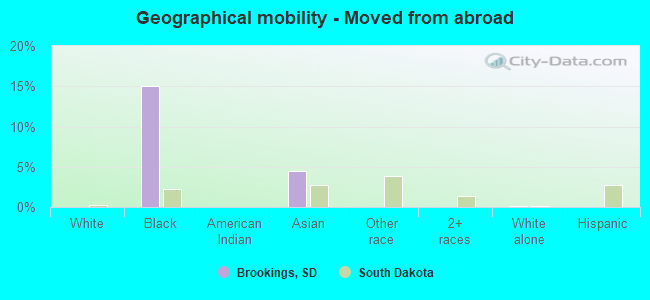
Geographical mobility in Brookings

- Same house 1 year ago
- 14,05768.5%White (Caucasian)
- 24771.5%Black or African American
- 34696.5%American Indian / Alaska Native
- 96594.0%Asian
- 7412.8%Other race
- 74866.9%Two or more races
- 13,97968.5%White alone, not Hispanic / Latino
- 51352.5%Hispanic or Latino
-
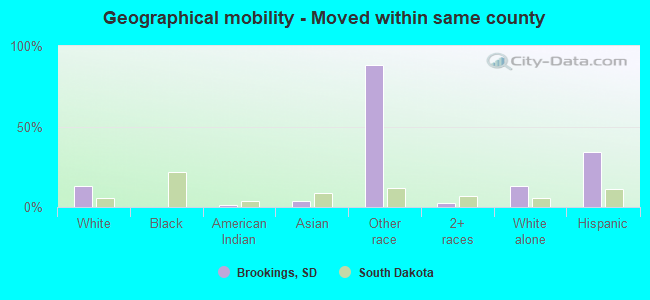
- Moved within same county
- 2,63212.8%White / Caucasian
- 51.5%American Indian / Alaska Native
- 414.0%Asian
- 51188.4%Other race
- 272.4%Two or more races
- 2,62712.9%White alone, not Hispanic / Latino
- 33634.3%Hispanic or Latino
-
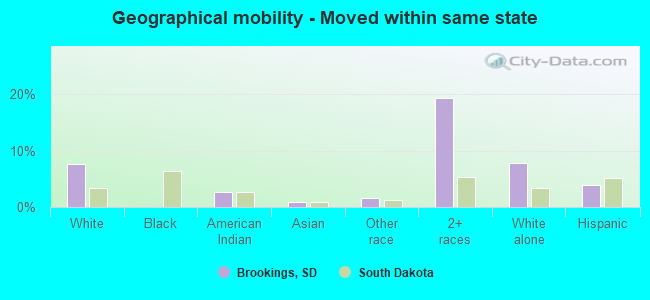
- Moved within same state
- 1,5777.7%White / Caucasian
- 102.7%American Indian / Alaska Native
- 101.0%Asian
- 91.6%Other race
- 21519.2%Two or more races
- 1,5717.7%White alone, not Hispanic / Latino
- 383.9%Hispanic or Latino
-
- Moved from different state
- 2,11110.3%White / Caucasian
- 41.1%Black or African American
- 20.7%American Indian / Alaska Native
- 40.4%Asian
- 223.7%Other race
- 968.5%Two or more races
- 2,05710.1%White alone, not Hispanic / Latino
- 11711.9%Hispanic or Latino
-
- Moved from abroad
- 120.1%White
- 5215.1%Black or African American
- 464.5%Asian
- 130.1%White alone, not Hispanic / Latino
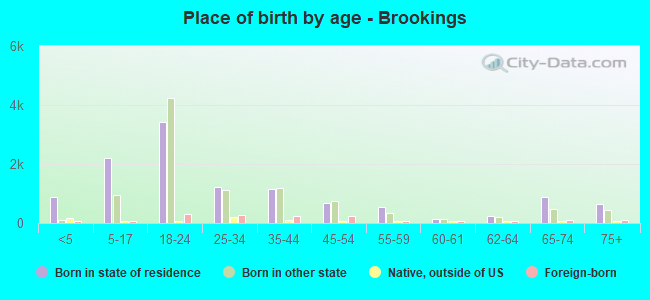
Children Nativity (place of birth) in Brookings
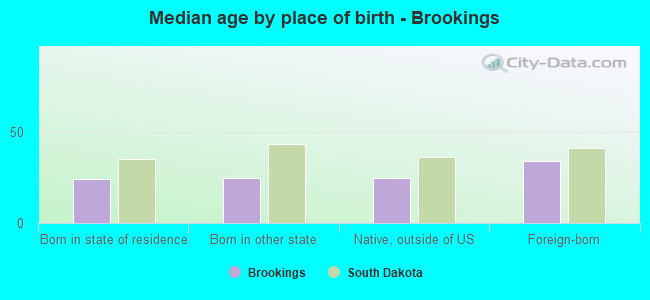
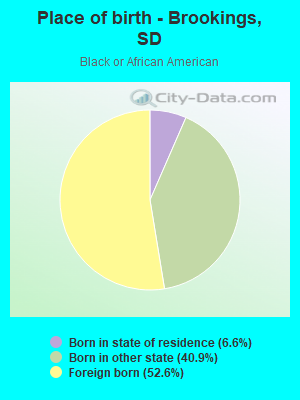
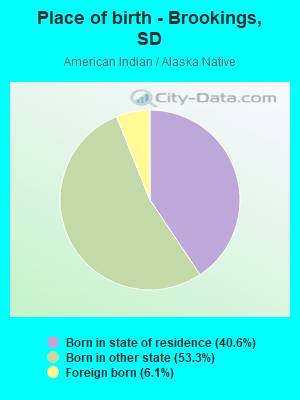
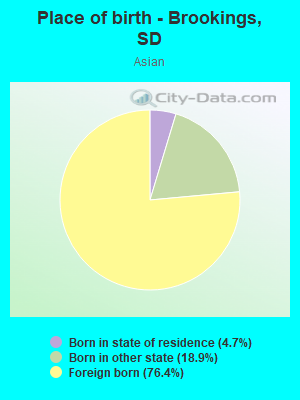
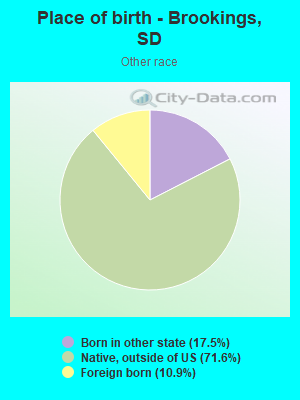
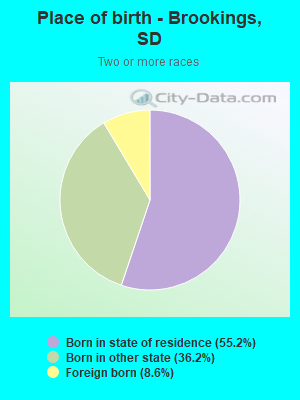
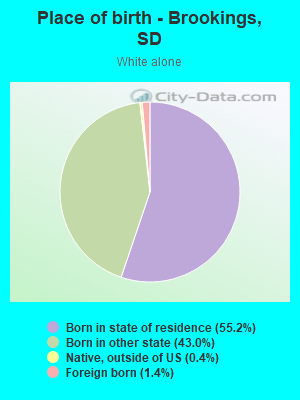
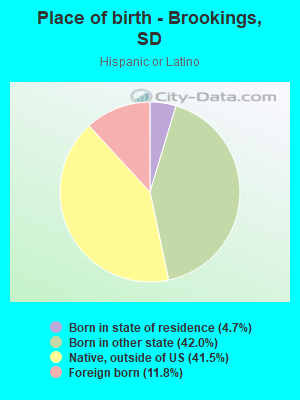
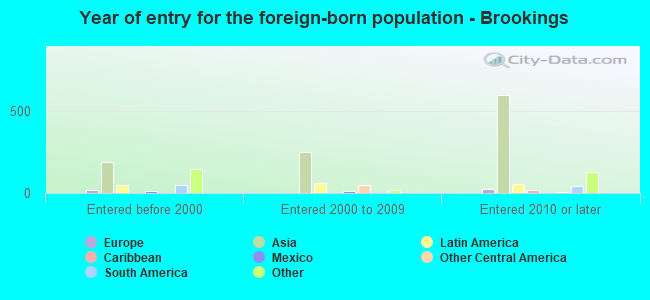
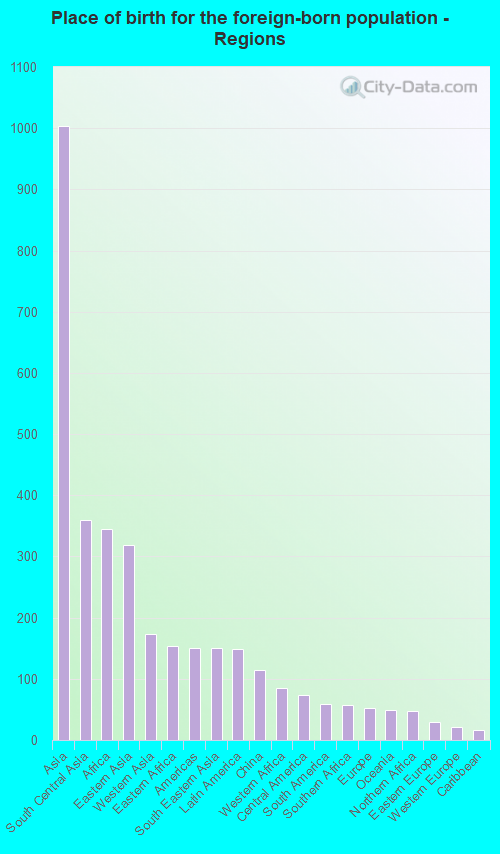
Place of birth for residents in Brookings
![Place of birth for the foreign-born population - Regions]()
- 1,004Asia
- 360South Central Asia
- 345Africa
- 319Eastern Asia
- 174Western Asia
- 154Eastern Africa
- 151Americas
- 150South Eastern Asia
- 148Latin America
- 114China
- 85Western Africa
- 73Central America
- 59South America
- 58Southern Africa
- 53Europe
- 49Oceania
- 47Northern Africa
- 30Eastern Europe
- 22Western Europe
- 16Caribbean
- 3Northern America
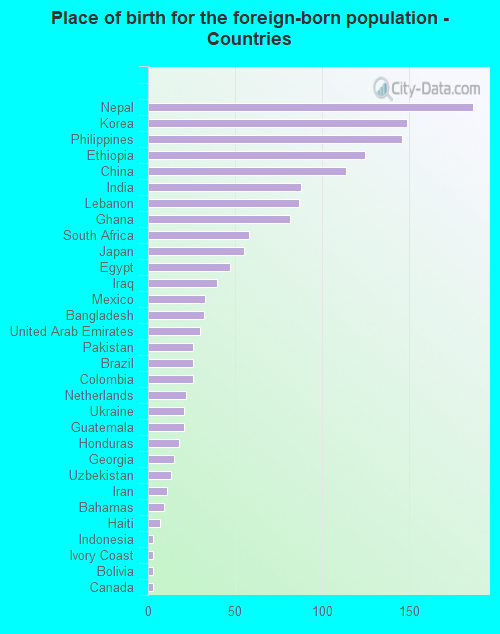
![Place of birth for the foreign-born population - Countries]()
- 187Nepal
- 149Korea
- 146Philippines
- 125Ethiopia
- 114China
- 88India
- 87Lebanon
- 82Ghana
- 58South Africa
- 55Japan
- 47Egypt
- 40Iraq
- 33Mexico
- 32Bangladesh
- 30United Arab Emirates
- 26Pakistan
- 26Brazil
- 26Colombia
- 22Netherlands
- 21Ukraine
- 21Guatemala
- 18Honduras
- 15Georgia
- 13Uzbekistan
- 11Iran
- 9Bahamas
- 7Haiti
- 3Indonesia
- 3Ivory Coast
- 3Bolivia
- 3Canada
- 1Thailand
Grandparents responsible for own grandchildren in Brookings
Zip codes: 57006.