Races in Brookline, Massachusetts (MA) Detailed Stats
Data:
Races - White alone (%)
Races - White alone (% change since 2000)
Races - Black alone (%)
Races - Black alone (% change since 2000)
Races - American Indian alone (%)
Races - American Indian alone (% change since 2000)
Races - Asian alone (%)
Races - Asian alone (% change since 2000)
Races - Hispanic (%)
Races - Hispanic (% change since 2000)
Races - Native Hawaiian and Other Pacific Islander alone (%)
Races - Native Hawaiian and Other Pacific Islander alone (% change since 2000)
Races - Two or more races(%)
Races - Two or more races(% change since 2000)
Races - Other race alone (%)
Races - Other race alone (% change since 2000)
Racial diversity
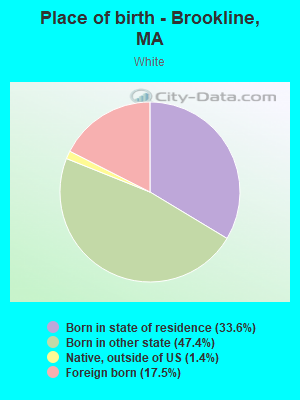
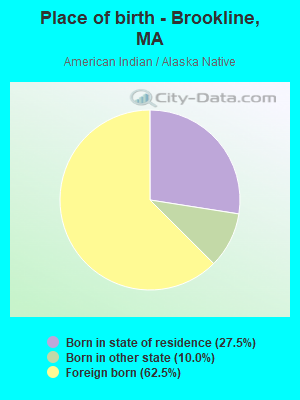
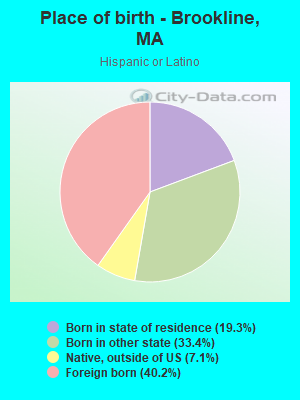
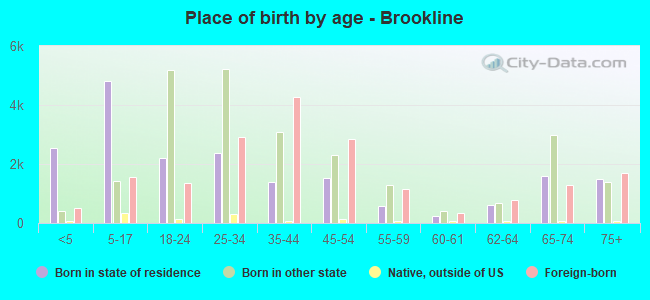
Place of birth - Born in state of residence (%)
Place of birth - Born in state of residence (%) - White
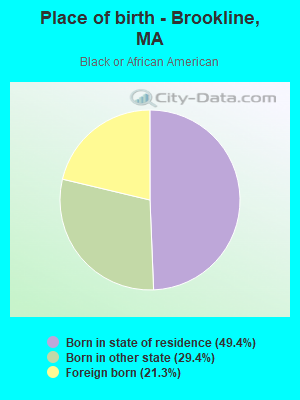
Place of birth - Born in state of residence (%) - Black or African American
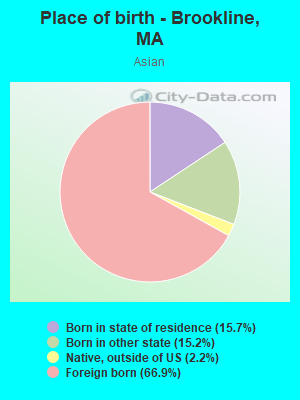
Place of birth - Born in state of residence (%) - Asian
Place of birth - Born in state of residence (%) - Hispanic or Latino
Place of birth - Born in state of residence (%) - American Indian and Alaska Native
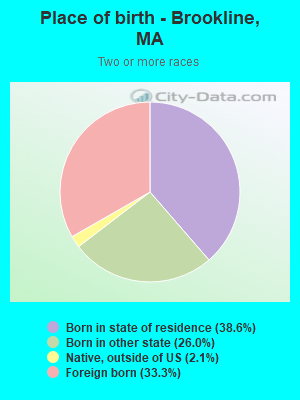
Place of birth - Born in state of residence (%) - Multirace
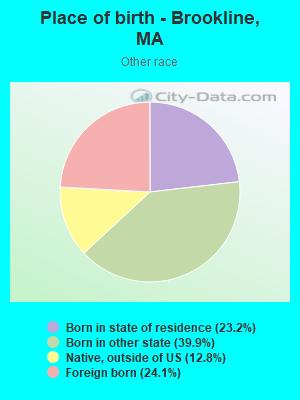
Place of birth - Born in state of residence (%) - Other Race
Place of birth - Born in other state (%)
Place of birth - Born in other state (%) - White
Place of birth - Born in other state (%) - Black or African American
Place of birth - Born in other state (%) - Asian
Place of birth - Born in other state (%) - Hispanic or Latino
Place of birth - Born in other state (%) - American Indian and Alaska Native
Place of birth - Born in other state (%) - Multirace
Place of birth - Born in other state (%) - Other Race
Place of birth - Native, outside of US (%)
Place of birth - Native, outside of US (%) - White
Place of birth - Native, outside of US (%) - Black or African American
Place of birth - Native, outside of US (%) - Asian
Place of birth - Native, outside of US (%) - Hispanic or Latino
Place of birth - Native, outside of US (%) - American Indian and Alaska Native
Place of birth - Native, outside of US (%) - Multirace
Place of birth - Native, outside of US (%) - Other Race
Place of birth - Foreign born (%)
Place of birth - Foreign born (%) - White
Place of birth - Foreign born (%) - Black or African American
Place of birth - Foreign born (%) - Asian
Place of birth - Foreign born (%) - Hispanic or Latino
Place of birth - Foreign born (%) - American Indian and Alaska Native
Place of birth - Foreign born (%) - Multirace
Place of birth - Foreign born (%) - Other Race
Residents speaking English at home (%)
Residents speaking English at home - Born in the United States (%)
Residents speaking English at home - Native, born elsewhere (%)
Residents speaking English at home - Foreign born (%)
Residents speaking Spanish at home (%)
Residents speaking Spanish at home - Born in the United States (%)
Residents speaking Spanish at home - Native, born elsewhere (%)
Residents speaking Spanish at home - Foreign born (%)
Residents speaking other language at home (%)
Residents speaking other language at home - Born in the United States (%)
Residents speaking other language at home - Native, born elsewhere (%)
Residents speaking other language at home - Foreign born (%)
Marital status - Never married (%)
Marital status - Now married (%)
Marital status - Separated (%)
Marital status - Widowed (%)
Marital status - Divorced (%)
Ancestries Reported - Arab (%)
Ancestries Reported - Czech (%)
Ancestries Reported - Danish (%)
Ancestries Reported - Dutch (%)
Ancestries Reported - English (%)
Ancestries Reported - French (%)
Ancestries Reported - French Canadian (%)
Ancestries Reported - German (%)
Ancestries Reported - Greek (%)
Ancestries Reported - Hungarian (%)
Ancestries Reported - Irish (%)
Ancestries Reported - Italian (%)
Ancestries Reported - Lithuanian (%)
Ancestries Reported - Norwegian (%)
Ancestries Reported - Polish (%)
Ancestries Reported - Portuguese (%)
Ancestries Reported - Russian (%)
Ancestries Reported - Scotch-Irish (%)
Ancestries Reported - Scottish (%)
Ancestries Reported - Slovak (%)
Ancestries Reported - Subsaharan African (%)
Ancestries Reported - Swedish (%)
Ancestries Reported - Swiss (%)
Ancestries Reported - Ukrainian (%)
Ancestries Reported - United States (%)
Ancestries Reported - Welsh (%)
Ancestries Reported - West Indian (%)
Ancestries Reported - Other (%)
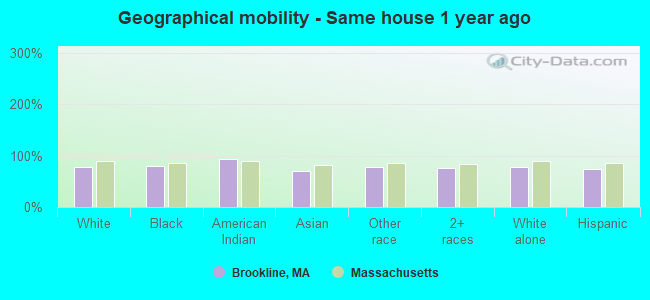
Geographical mobility - Same house 1 year ago (%)
Geographical mobility - Same house 1 year ago (%) - White
Geographical mobility - Same house 1 year ago (%) - Black or African American
Geographical mobility - Same house 1 year ago (%) - Asian
Geographical mobility - Same house 1 year ago (%) - Hispanic or Latino
Geographical mobility - Same house 1 year ago (%) - American Indian and Alaska Native
Geographical mobility - Same house 1 year ago (%) - Multirace
Geographical mobility - Same house 1 year ago (%) - Other Race
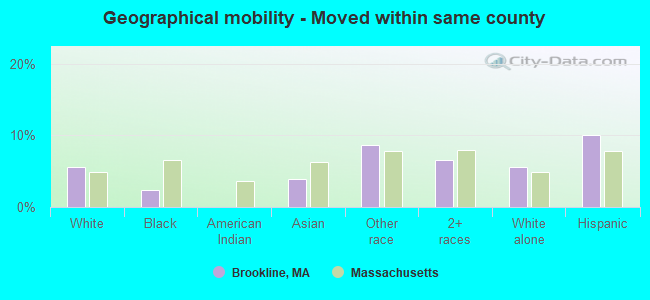
Geographical mobility - Moved within same county (%)
Geographical mobility - Moved within same county (%) - White
Geographical mobility - Moved within same county (%) - Black or African American
Geographical mobility - Moved within same county (%) - Asian
Geographical mobility - Moved within same county (%) - Hispanic or Latino
Geographical mobility - Moved within same county (%) - American Indian and Alaska Native
Geographical mobility - Moved within same county (%) - Multirace
Geographical mobility - Moved within same county (%) - Other Race
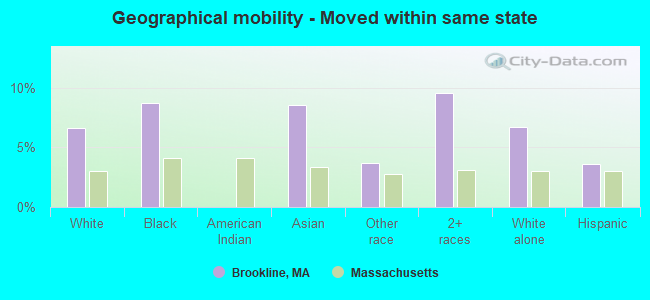
Geographical mobility - Moved from different county within same state (%)
Geographical mobility - Moved from different county within same state (%) - White
Geographical mobility - Moved from different county within same state (%) - Black or African American
Geographical mobility - Moved from different county within same state (%) - Asian
Geographical mobility - Moved from different county within same state (%) - Hispanic or Latino
Geographical mobility - Moved from different county within same state (%) - American Indian and Alaska Native
Geographical mobility - Moved from different county within same state (%) - Multirace
Geographical mobility - Moved from different county within same state (%) - Other Race
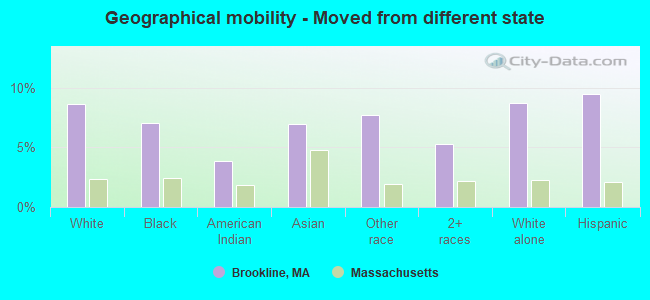
Geographical mobility - Moved from different state (%)
Geographical mobility - Moved from different state (%) - White
Geographical mobility - Moved from different state (%) - Black or African American
Geographical mobility - Moved from different state (%) - Asian
Geographical mobility - Moved from different state (%) - Hispanic or Latino
Geographical mobility - Moved from different state (%) - American Indian and Alaska Native
Geographical mobility - Moved from different state (%) - Multirace
Geographical mobility - Moved from different state (%) - Other Race
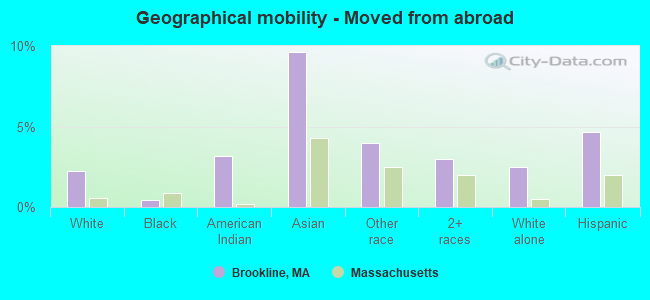
Geographical mobility - Moved from abroad (%)
Geographical mobility - Moved from abroad (%) - White
Geographical mobility - Moved from abroad (%) - Black or African American
Geographical mobility - Moved from abroad (%) - Asian
Geographical mobility - Moved from abroad (%) - Hispanic or Latino
Geographical mobility - Moved from abroad (%) - American Indian and Alaska Native
Geographical mobility - Moved from abroad (%) - Multirace
Geographical mobility - Moved from abroad (%) - Other Race
Place of birth for the foreign-born population - Ireland (%)
Place of birth for the foreign-born population - Denmark (%)
Place of birth for the foreign-born population - Norway (%)
Place of birth for the foreign-born population - Sweden (%)
Place of birth for the foreign-born population - United Kingdom (%)
Place of birth for the foreign-born population - England (%)
Place of birth for the foreign-born population - Scotland (%)
Place of birth for the foreign-born population - Other Northern Europe (%)
Place of birth for the foreign-born population - Austria (%)
Place of birth for the foreign-born population - Belgium (%)
Place of birth for the foreign-born population - France (%)
Place of birth for the foreign-born population - Germany (%)
Place of birth for the foreign-born population - Netherlands (%)
Place of birth for the foreign-born population - Switzerland (%)
Place of birth for the foreign-born population - Other Western Europe (%)
Place of birth for the foreign-born population - Greece (%)
Place of birth for the foreign-born population - Italy (%)
Place of birth for the foreign-born population - Portugal (%)
Place of birth for the foreign-born population - Spain (%)
Place of birth for the foreign-born population - Other Southern Europe (%)
Place of birth for the foreign-born population - Albania (%)
Place of birth for the foreign-born population - Belarus (%)
Place of birth for the foreign-born population - Bosnia and Herzegovina (%)
Place of birth for the foreign-born population - Bulgaria (%)
Place of birth for the foreign-born population - Croatia (%)
Place of birth for the foreign-born population - Czechoslovakia (%)
Place of birth for the foreign-born population - Hungary (%)
Place of birth for the foreign-born population - Latvia (%)
Place of birth for the foreign-born population - Lithuania (%)
Place of birth for the foreign-born population - North Macedonia (Macedonia) (%)
Place of birth for the foreign-born population - Moldova (%)
Place of birth for the foreign-born population - Poland (%)
Place of birth for the foreign-born population - Romania (%)
Place of birth for the foreign-born population - Russia (%)
Place of birth for the foreign-born population - Serbia (%)
Place of birth for the foreign-born population - Ukraine (%)
Place of birth for the foreign-born population - Other Eastern Europe (%)
Place of birth for the foreign-born population - China (%)
Place of birth for the foreign-born population - Hong Kong (%)
Place of birth for the foreign-born population - Taiwan (%)
Place of birth for the foreign-born population - Japan (%)
Place of birth for the foreign-born population - Korea (%)
Place of birth for the foreign-born population - Other Eastern Asia (%)
Place of birth for the foreign-born population - Afghanistan (%)
Place of birth for the foreign-born population - Bangladesh (%)
Place of birth for the foreign-born population - India (%)
Place of birth for the foreign-born population - Iran (%)
Place of birth for the foreign-born population - Kazakhstan (%)
Place of birth for the foreign-born population - Nepal (%)
Place of birth for the foreign-born population - Pakistan (%)
Place of birth for the foreign-born population - Sri Lanka (%)
Place of birth for the foreign-born population - Uzbekistan (%)
Place of birth for the foreign-born population - Other South Central Asia (%)
Place of birth for the foreign-born population - Burma (%)
Place of birth for the foreign-born population - Cambodia (%)
Place of birth for the foreign-born population - Indonesia (%)
Place of birth for the foreign-born population - Laos (%)
Place of birth for the foreign-born population - Malaysia (%)
Place of birth for the foreign-born population - Philippines (%)
Place of birth for the foreign-born population - Singapore (%)
Place of birth for the foreign-born population - Thailand (%)
Place of birth for the foreign-born population - Vietnam (%)
Place of birth for the foreign-born population - Other South Eastern Asia (%)
Place of birth for the foreign-born population - Armenia (%)
Place of birth for the foreign-born population - Iraq (%)
Place of birth for the foreign-born population - Israel (%)
Place of birth for the foreign-born population - Jordan (%)
Place of birth for the foreign-born population - Kuwait (%)
Place of birth for the foreign-born population - Lebanon (%)
Place of birth for the foreign-born population - Saudi Arabia (%)
Place of birth for the foreign-born population - Syria (%)
Place of birth for the foreign-born population - Turkey (%)
Place of birth for the foreign-born population - Yemen (%)
Place of birth for the foreign-born population - Other Western Asia (%)
Place of birth for the foreign-born population - Eritrea (%)
Place of birth for the foreign-born population - Ethiopia (%)
Place of birth for the foreign-born population - Kenya (%)
Place of birth for the foreign-born population - Somalia (%)
Place of birth for the foreign-born population - Uganda (%)
Place of birth for the foreign-born population - Zimbabwe (%)
Place of birth for the foreign-born population - Other Eastern Africa (%)
Place of birth for the foreign-born population - Cameroon (%)
Place of birth for the foreign-born population - Congo (%)
Place of birth for the foreign-born population - Democratic Republic of Congo (Zaire) (%)
Place of birth for the foreign-born population - Other Middle Africa (%)
Place of birth for the foreign-born population - Egypt (%)
Place of birth for the foreign-born population - Morocco (%)
Place of birth for the foreign-born population - Sudan (%)
Place of birth for the foreign-born population - Other Northern Africa (%)
Place of birth for the foreign-born population - South Africa (%)
Place of birth for the foreign-born population - Other Southern Africa (%)
Place of birth for the foreign-born population - Cabo Verde (%)
Place of birth for the foreign-born population - Ghana (%)
Place of birth for the foreign-born population - Liberia (%)
Place of birth for the foreign-born population - Nigeria (%)
Place of birth for the foreign-born population - Senegal (%)
Place of birth for the foreign-born population - Sierra Leone (%)
Place of birth for the foreign-born population - Other Western Africa (%)
Place of birth for the foreign-born population - Australia (%)
Place of birth for the foreign-born population - New Zealand (%)
Place of birth for the foreign-born population - Fiji (%)
Place of birth for the foreign-born population - Micronesia (%)
Place of birth for the foreign-born population - Bahamas (%)
Place of birth for the foreign-born population - Barbados (%)
Place of birth for the foreign-born population - Cuba (%)
Place of birth for the foreign-born population - Dominica (%)
Place of birth for the foreign-born population - Dominican Republic (%)
Place of birth for the foreign-born population - Grenada (%)
Place of birth for the foreign-born population - Haiti (%)
Place of birth for the foreign-born population - Jamaica (%)
Place of birth for the foreign-born population - St. Vincent and the Grenadines (%)
Place of birth for the foreign-born population - Trinidad and Tobago (%)
Place of birth for the foreign-born population - West Indies (%)
Place of birth for the foreign-born population - Other Caribbean (%)
Place of birth for the foreign-born population - Belize (%)
Place of birth for the foreign-born population - Costa Rica (%)
Place of birth for the foreign-born population - El Salvador (%)
Place of birth for the foreign-born population - Guatemala (%)
Place of birth for the foreign-born population - Honduras (%)
Place of birth for the foreign-born population - Mexico (%)
Place of birth for the foreign-born population - Nicaragua (%)
Place of birth for the foreign-born population - Panama (%)
Place of birth for the foreign-born population - Other Central America (%)
Place of birth for the foreign-born population - Argentina (%)
Place of birth for the foreign-born population - Bolivia (%)
Place of birth for the foreign-born population - Brazil (%)
Place of birth for the foreign-born population - Chile (%)
Place of birth for the foreign-born population - Colombia (%)
Place of birth for the foreign-born population - Ecuador (%)
Place of birth for the foreign-born population - Guyana (%)
Place of birth for the foreign-born population - Peru (%)
Place of birth for the foreign-born population - Uruguay (%)
Place of birth for the foreign-born population - Venezuela (%)
Place of birth for the foreign-born population - Other South America (%)
Place of birth for the foreign-born population - Canada (%)
Place of birth for the foreign-born population - Other Northern America (%)
Place of birth for the foreign-born population - Other (%)
Latest news about races in Brookline, MA collected exclusively by city-data.com from local newspapers, TV, and radio stations
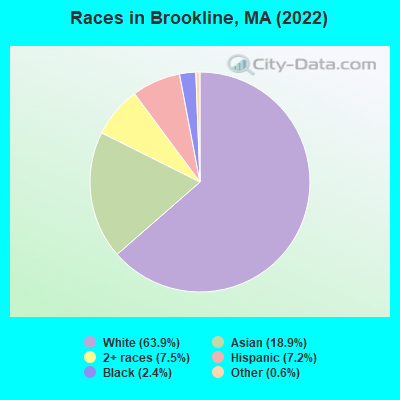
According to 2022 data, the most numerous races in Brookline, MA are White alone (40,248 residents), Hispanic (4,549 residents), and Asian alone (11,904 residents). 66.4% of Brookline residents speak English at home. 29.9% of Brookline, MA residents are foreign-born (16.5% born in Asia, 8.0% born in Europe), which is 39.8% greater than the foreign-born rate of 18.0% across the entire state of Massachusetts.
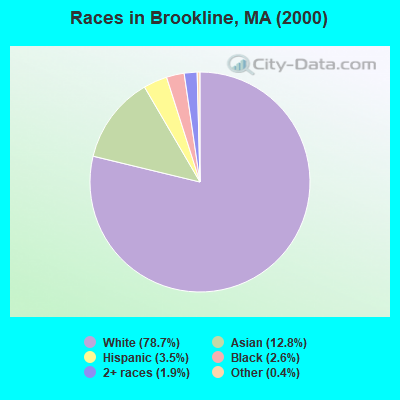
Race distribution in Brookline
2000 2022
44,922 78.7% White alone 7,303 12.8% Asian alone 2,018 3.5% Hispanic 1,501 2.6% Black alone 1,093 1.9% Two or more races 212 0.4% Other race alone 44 0.08% American Indian alone 14 0.02% Native Hawaiian and Other
40,248 63.9% White alone 11,904 18.9% Asian alone 4,737 7.5% Two or more races 4,549 7.2% Hispanic 1,543 2.4% Black alone 396 0.6% Other race alone 19 0.03% American Indian alone
2000 2022
5,198,359 81.9% White alone 428,729 6.8% Hispanic 318,329 5.0% Black alone 236,786 3.7% Asian alone 110,338 1.7% Two or more races 43,586 0.7% Other race alone 11,264 0.2% American Indian alone 1,706 0.03% Native Hawaiian and Other
4,676,627 67.0% White alone 911,038 13.0% Hispanic 501,463 7.2% Asian alone 459,740 6.6% Black alone 341,889 4.9% Two or more races 84,403 1.2% Other race alone 5,838 0.08% American Indian alone 976 0.01% Native Hawaiian and Other
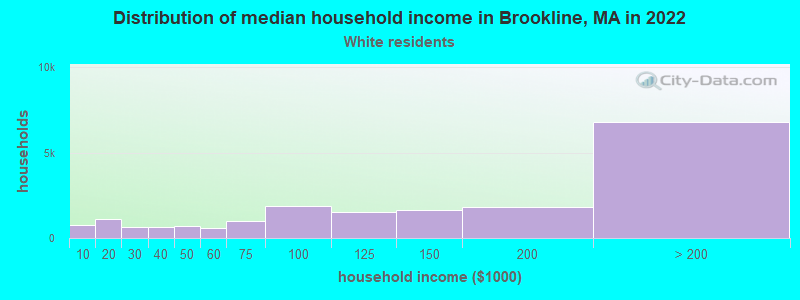
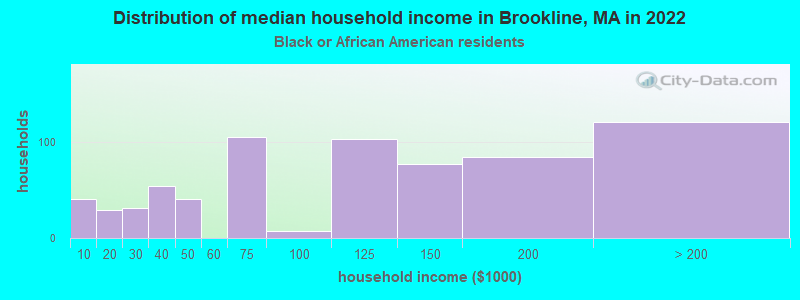
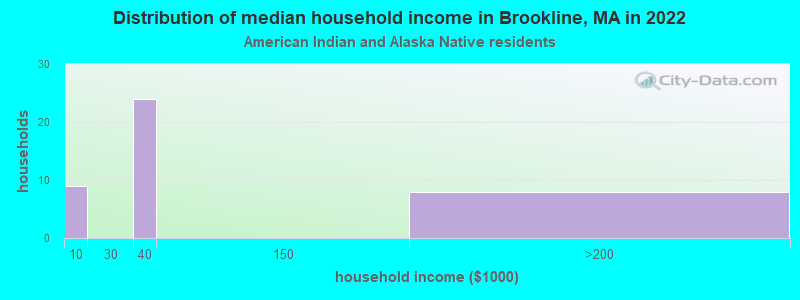
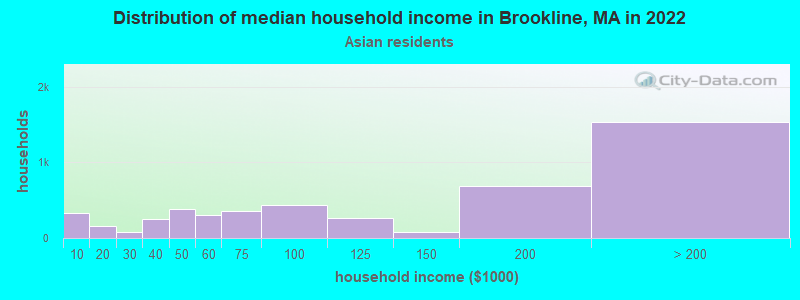
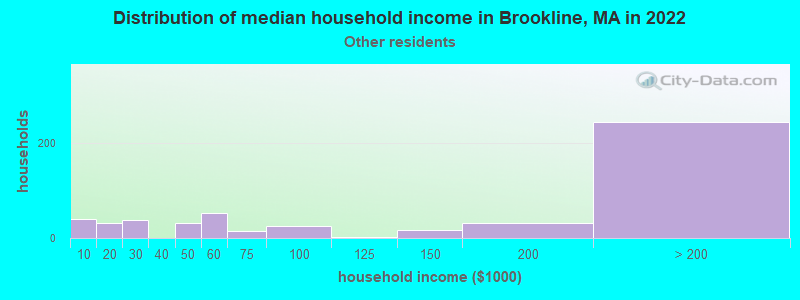
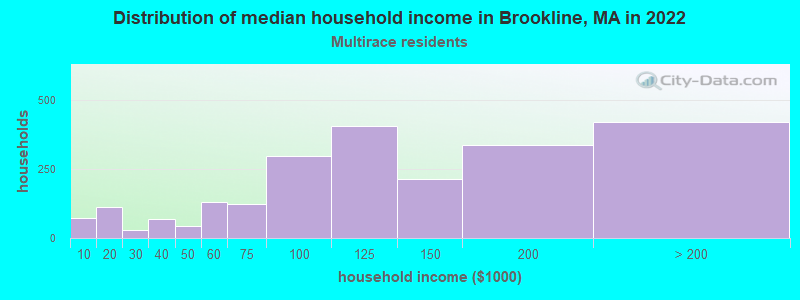
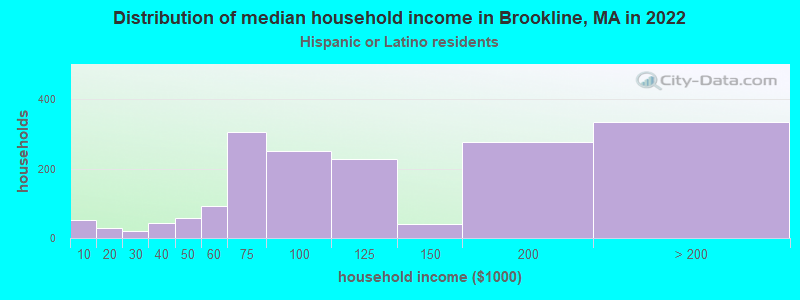
Income and house value in Brookline Median household income in 2022 $131,738 White non-Hispanic householders$136,507 Black householders$56,445 American Indian and Alaska Native householders$111,805 Asian householders$116,540 Two or more races householders$91,585 Hispanic or Latino race householdersMedian 2022 house value over $1,000,000 White Non-Hispanic householdersover $1,000,000 Black or African American householders$436,976 American Indian or Alaska Native householders over $1,000,000 Asian householdersover $1,000,000 Some other race householdersover $1,000,000 Two or more races householdersover $1,000,000 Hispanic or Latino householders
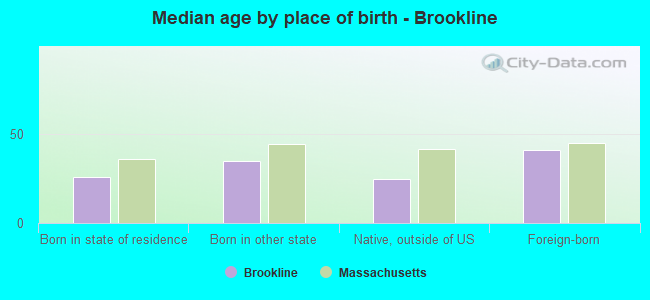
Median age by race in Brookline
37.4 Median age for White residents37.2 37.5 35.7 Median age for Black or African American residents34.9 37.7 50.7 Median age for American Indian / Alaska Native residents-649,474,688.9 50.4 35.5 Median age for Asian residents32.1 37.1 -514,227,641.8 Median age for Native Hawaiian / Pacific Islander residents-513,131,312.6 -508,717,948.2 32.4 Median age for Other race residents29.9 32.6 27.5 Median age for Two or more races residents24.9 28.7 37.3 Median age for White alone residents37.3 37.6 31.1 Median age for Hispanic or Latino residents28.2 32.1
Owner/renter occupied households by race in Brookline
House owners and renters - White residents 9,339 49.6% Owner occupied9,494 50.4% Renter occupiedHouse owners and renters - Black or African American residents 126 20.5% Owner occupied489 79.5% Renter occupiedHouse owners and renters - American Indian / Alaska Native residents 41 71.1% Owner occupied17 28.9% Renter occupiedHouse owners and renters - Asian residents 2,315 48.5% Owner occupied2,461 51.5% Renter occupiedHouse owners and renters - Other race residents 245 36.6% Owner occupied425 63.4% Renter occupiedHouse owners and renters - Two or more races residents 865 40.3% Owner occupied1,281 59.7% Renter occupiedHouse owners and renters - White alone residents 9,211 49.3% Owner occupied9,457 50.7% Renter occupiedHouse owners and renters - Hispanic or Latino residents 646 41.3% Owner occupied920 58.7% Renter occupied
Language usage in Brookline
English speakers - Total 66.4% of residents of Brookline speak English at home.
5.4% of residents speak Spanish at home 2,607 81.6% Speak English very well589 18.4% Speak English less than very well28.8% of residents speak other language at home 12,513 73.0% Speak English very well4,621 27.0% Speak English less than very well
English speakers - Born in the United States 89.4% of residents of Brookline speak English at home.
3.1% of residents speak Spanish at home 734 98.3% Speak English very well13 1.7% Speak English less than very well7.7% of residents speak other language at home 1,781 97.3% Speak English very well50 2.7% Speak English less than very well
English speakers - Native, born elsewhere 55.2% of residents of Brookline speak English at home.
24.5% of residents speak Spanish at home 189 66.3% Speak English very well96 33.7% Speak English less than very well19.3% of residents speak other language at home 217 96.9% Speak English very well7 3.1% Speak English less than very well
English speakers - Foreign-born 16.9% of residents of Brookline speak English at home.
8.2% of residents speak Spanish at home 1,058 70.4% Speak English very well445 29.6% Speak English less than very well75.7% of residents speak other language at home 9,617 69.3% Speak English very well4,256 30.7% Speak English less than very well
White (Caucasian) - Speak only English Native:
93.2% (29,791)Foreign-born:
18.8% (1,300)
White (Caucasian) - Speak another language Native:
6.9% (2,192)Foreign-born:
81.4% (5,622)
Black or African American - Speak only English Native:
91.2% (1,060)Foreign-born:
12.2% (42)
Black or African American - Speak another language Native:
8.0% (92)Foreign-born:
92.3% (317)
American Indian / Alaska Native - Speak another language Native:
93.5% (73)Foreign-born:
100.0% (127)
Asian - Speak only English Native:
57.2% (1,987)Foreign-born:
19.3% (1,497)
Asian - Speak another language Native:
43.4% (1,508)Foreign-born:
81.9% (6,351)
Other race - Speak only English Native:
39.6% (434)Foreign-born:
5.5% (21)
Other race - Speak another language Native:
56.2% (616)Foreign-born:
93.7% (352)
Two or more races - Speak only English Native:
85.7% (3,460)Foreign-born:
23.0% (540)
Two or more races - Speak another language Native:
13.8% (555)Foreign-born:
75.8% (1,783)
White alone - Speak only English Native:
94.2% (29,666)Foreign-born:
18.7% (1,257)
White alone - Speak another language Native:
5.9% (1,872)Foreign-born:
82.4% (5,553)
Hispanic or Latino - Speak only English Native:
45.0% (1,054)Foreign-born:
9.1% (170)
Hispanic or Latino - Speak another language Native:
55.8% (1,307)Foreign-born:
91.3% (1,706)
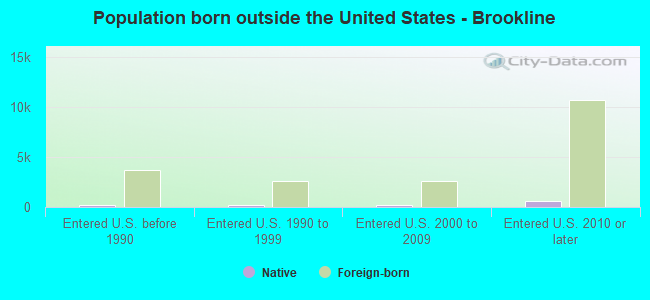
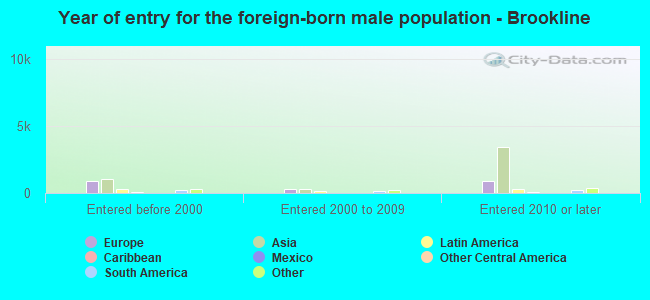
Foreign-born residents in Brookline 18,824 residents are foreign born (16.5% Asia , 8.0% Europe ).
This city:
29.9%Massachusetts:
17.6%
Marital status for residents in Brookline Marital status - White (Caucasian) population 15 years and over
Males 41.1% Never married52.8% Now married0.4% Separated1.1% Widowed4.6% DivorcedFemales 45.4% Never married39.5% Now married0.7% Separated7.0% Widowed7.4% DivorcedWomen who gave birth in the past 12 months Now married:
99.4% (315)Unmarried:
0.6% (2)
Women who did not give birth in the past 12 months Now married:
31.0% (3,463)Unmarried:
69.0% (7,699)
Marital status - Black or African American population 15 years and over
Males 46.2% Never married26.8% Now married0.0% Separated25.0% Widowed2.0% DivorcedFemales 55.1% Never married29.5% Now married0.8% Separated3.4% Widowed11.2% DivorcedWomen who gave birth in the past 12 months Now married:
100.0% (6)Unmarried:
0.0% (0)
Women who did not give birth in the past 12 months Now married:
38.9% (188)Unmarried:
61.1% (295)
Marital status - American Indian / Alaska Native population 15 years and over
Males 0.0% Never married100.0% Now married0.0% Separated0.0% Widowed0.0% DivorcedFemales 77.4% Never married22.6% Now married0.0% Separated0.0% Widowed0.0% DivorcedWomen who did not give birth in the past 12 months Now married:
0.0% (0)Unmarried:
100.0% (58)
Marital status - Asian population 15 years and over
Males 43.3% Never married55.5% Now married0.3% Separated0.6% Widowed0.2% DivorcedFemales 38.6% Never married49.4% Now married0.9% Separated6.9% Widowed4.2% DivorcedWomen who gave birth in the past 12 months Now married:
100.0% (210)Unmarried:
0.0% (0)
Women who did not give birth in the past 12 months Now married:
41.8% (1,654)Unmarried:
58.2% (2,306)
Marital status - Other race population 15 years and over
Males 59.1% Never married25.3% Now married0.0% Separated0.0% Widowed15.6% DivorcedFemales 51.1% Never married24.7% Now married0.0% Separated8.9% Widowed15.3% DivorcedWomen who gave birth in the past 12 months Now married:
0.0% (0)Unmarried:
100.0% (65)
Women who did not give birth in the past 12 months Now married:
33.5% (179)Unmarried:
66.5% (354)
Marital status - Two or more races population 15 years and over
Males 55.7% Never married42.0% Now married0.0% Separated0.0% Widowed2.4% DivorcedFemales 51.2% Never married28.2% Now married0.0% Separated0.0% Widowed20.6% DivorcedWomen who gave birth in the past 12 months Now married:
100.0% (152)Unmarried:
0.0% (0)
Women who did not give birth in the past 12 months Now married:
25.0% (445)Unmarried:
75.0% (1,332)
Marital status - White alone, not Hispanic / Latino population 15 years and over
Males 41.0% Never married52.7% Now married0.4% Separated1.1% Widowed4.8% DivorcedFemales 45.4% Never married39.5% Now married0.7% Separated7.3% Widowed7.2% DivorcedWomen who gave birth in the past 12 months Now married:
99.3% (271)Unmarried:
0.7% (2)
Women who did not give birth in the past 12 months Now married:
31.5% (3,428)Unmarried:
68.5% (7,455)
Marital status - Hispanic or Latino population 15 years and over
Males 48.5% Never married46.5% Now married0.0% Separated0.0% Widowed5.0% DivorcedFemales 47.1% Never married31.1% Now married0.0% Separated0.0% Widowed21.7% DivorcedWomen who gave birth in the past 12 months Now married:
64.7% (83)Unmarried:
35.3% (45)
Women who did not give birth in the past 12 months Now married:
23.1% (304)Unmarried:
76.9% (1,014)
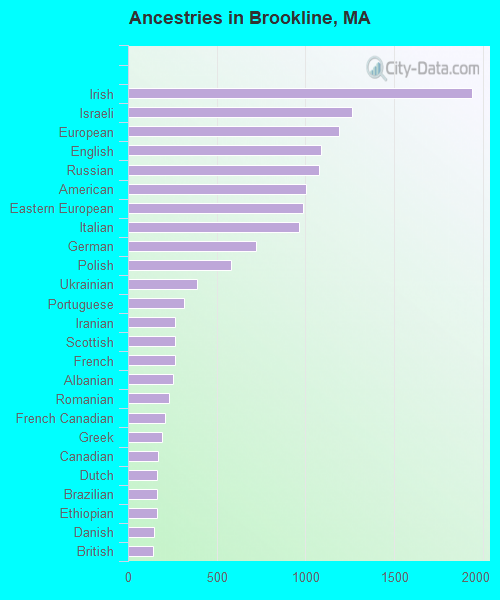
Ancestries in Brookline
1,937 6.0% Irish1,264 3.9% Israeli1,188 3.7% European1,089 3.4% English1,078 3.3% Russian1,001 3.1% American984 3.0% Eastern European962 3.0% Italian722 2.2% German582 1.8% Polish390 1.2% Ukrainian318 1.0% Portuguese266 0.8% Iranian264 0.8% Scottish262 0.8% French252 0.8% Albanian229 0.7% Romanian208 0.6% French Canadian190 0.6% Greek170 0.5% Canadian164 0.5% Dutch163 0.5% Brazilian161 0.5% Ethiopian147 0.5% Danish139 0.4% British137 0.4% Bulgarian128 0.4% Northern European125 0.4% Jordanian124 0.4% Egyptian110 0.3% Scotch-Irish106 0.3% Afghan103 0.3% Swedish101 0.3% Serbian99 0.3% Hungarian92 0.3% Turkish86 0.3% Austrian79 0.2% Arab74 0.2% Syrian71 0.2% Lebanese66 0.2% Armenian66 0.2% Swiss52 0.2% Slavic45 0.1% Belgian43 0.1% Moroccan37 0.1% Norwegian34 0.1% South African28 0.09% Latvian25 0.08% Scandinavian25 0.08% Nigerian23 0.07% Lithuanian19 0.06% Ugandan17 0.05% Cypriot15 0.05% Finnish15 0.05% Haitian14 0.04% Welsh12 0.04% Slovak11 0.03% Pennsylvania German11 0.03% Kenyan9 0.03% Jamaican7 0.02% Czech7 0.02% Sudanese7 0.02% Barbadian3 0.01% Ghanaian3 0.01% Liberian
Geographical mobility in Brookline Same house 1 year ago 32,125 78.6% White (Caucasian)1,347 80.2% Black or African American173 93.9% American Indian / Alaska Native8,289 70.8% Asian970 77.7% Other race5,359 75.8% Two or more races31,376 78.6% White alone, not Hispanic / Latino3,287 74.9% Hispanic or LatinoMoved within same county 2,279 5.6% White / Caucasian40 2.4% Black or African American461 3.9% Asian108 8.7% Other race462 6.5% Two or more races2,208 5.5% White alone, not Hispanic / Latino442 10.1% Hispanic or LatinoMoved within same state 2,691 6.6% White / Caucasian146 8.7% Black or African American998 8.5% Asian46 3.7% Other race678 9.6% Two or more races2,669 6.7% White alone, not Hispanic / Latino159 3.6% Hispanic or LatinoMoved from different state 3,539 8.7% White / Caucasian118 7.0% Black or African American7 3.8% American Indian / Alaska Native813 6.9% Asian96 7.7% Other race374 5.3% Two or more races3,466 8.7% White alone, not Hispanic / Latino414 9.4% Hispanic or LatinoMoved from abroad 922 2.3% White7 0.4% Black or African American6 3.2% American Indian / Alaska Native1,131 9.7% Asian50 4.0% Other race212 3.0% Two or more races984 2.5% White alone, not Hispanic / Latino203 4.6% Hispanic or Latino
Children Nativity (place of birth) in Brookline
Children under 6 years - Living with two parents Both parents native 1,861 98.0% Native38 2.0% Foreign-bornBoth parents foreign-born 848 57.7% Native623 42.3% Foreign-bornOne native, one foreign-born parent 668 100.0% NativeChildren under 6 years - Living with one parent Native parent 187 100.0% NativeForeign-born parent 68 51.6% Native64 48.4% Foreign-bornChildren 6 to 17 years - Living with two parents Both parents native 2,807 97.3% Native79 2.7% Foreign-bornBoth parents foreign-born 1,127 59.2% Native775 40.8% Foreign-bornOne native, one foreign-born parent 1,195 92.0% Native104 8.0% Foreign-bornChildren 6 to 17 years - Living with one parent Native parent 569 78.4% Native157 21.6% Foreign-bornForeign-born parent 294 79.7% Native75 20.3% Foreign-born
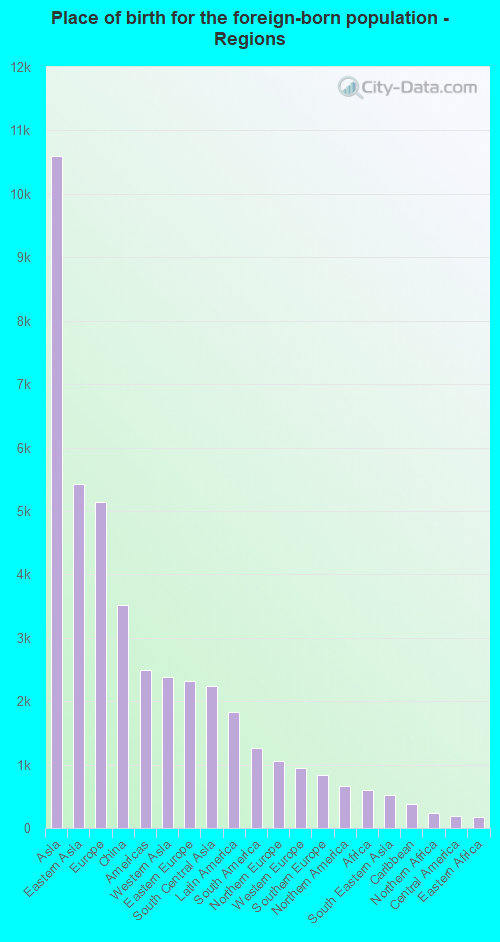
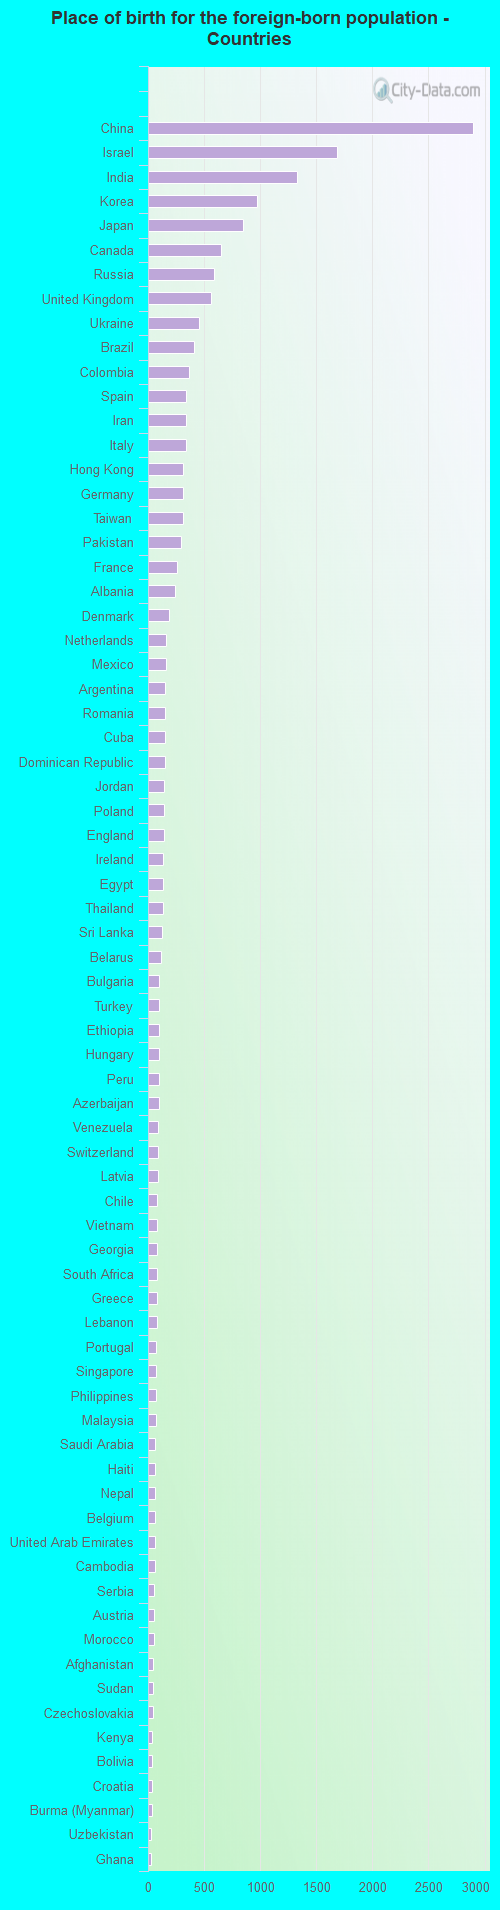
Place of birth for residents in Brookline 10,591 Asia5,417 Eastern Asia5,143 Europe3,520 China2,493 Americas2,387 Western Asia2,320 Eastern Europe2,240 South Central Asia1,837 Latin America1,259 South America1,051 Northern Europe942 Western Europe828 Southern Europe655 Northern America596 Africa528 South Eastern Asia384 Caribbean239 Northern Africa193 Central America177 Eastern Africa82 Western Africa77 Southern Africa19 Middle Africa2,895 China1,685 Israel1,329 India976 Korea846 Japan655 Canada591 Russia566 United Kingdom459 Ukraine409 Brazil367 Colombia339 Spain335 Iran335 Italy316 Hong Kong315 Germany308 Taiwan294 Pakistan262 France241 Albania190 Denmark163 Netherlands158 Mexico152 Argentina149 Romania149 Cuba148 Dominican Republic147 Jordan142 Poland141 England135 Ireland133 Egypt131 Thailand121 Sri Lanka117 Belarus100 Bulgaria100 Turkey97 Ethiopia95 Hungary94 Peru94 Azerbaijan93 Venezuela88 Switzerland85 Latvia83 Chile81 Vietnam81 Georgia77 South Africa77 Greece76 Lebanon74 Portugal69 Singapore69 Philippines68 Malaysia66 Saudi Arabia66 Haiti64 Nepal61 Belgium61 United Arab Emirates60 Cambodia57 Serbia52 Austria51 Morocco47 Afghanistan46 Sudan41 Czechoslovakia38 Kenya36 Bolivia35 Croatia34 Burma (Myanmar)29 Uzbekistan28 Ghana23 Guatemala22 Uganda21 Lithuania21 Ecuador19 Democratic Republic of Congo (Zaire)18 Zimbabwe16 Iraq16 Liberia14 Kuwait12 Indonesia12 Norway11 Panama11 Bangladesh10 Jamaica8 Algeria7 Kazakhstan5 Sweden1 El Salvador
Grandparents responsible for own grandchildren in Brookline
Grandparents (30 to 59 years) White / Caucasian 12 52.9% Responsible for grandchildren11 47.1% Not responsible for grandchildrenAsian 55 100.0% Not responsible for grandchildrenWhite alone, not Hispanic / Latino 13 53.3% Responsible for grandchildren12 46.7% Not responsible for grandchildrenGrandparents (60 years and over) White / Caucasian 12 10.6% Responsible for grandchildren98 89.4% Not responsible for grandchildrenAsian 93 100.0% Not responsible for grandchildrenWhite alone, not Hispanic / Latino 12 10.6% Responsible for grandchildren99 89.4% Not responsible for grandchildren