Races in Broomall, Pennsylvania (PA) Detailed Stats
Data:
Races - White alone (%)
Races - White alone (% change since 2000)
Races - Black alone (%)
Races - Black alone (% change since 2000)
Races - American Indian alone (%)
Races - American Indian alone (% change since 2000)
Races - Asian alone (%)
Races - Asian alone (% change since 2000)
Races - Hispanic (%)
Races - Hispanic (% change since 2000)
Races - Native Hawaiian and Other Pacific Islander alone (%)
Races - Native Hawaiian and Other Pacific Islander alone (% change since 2000)
Races - Two or more races(%)
Races - Two or more races(% change since 2000)
Races - Other race alone (%)
Races - Other race alone (% change since 2000)
Racial diversity
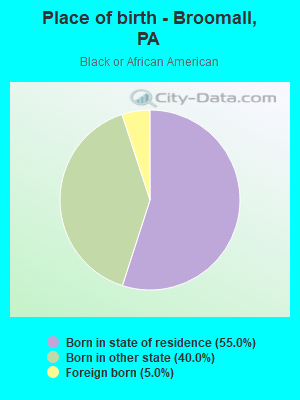
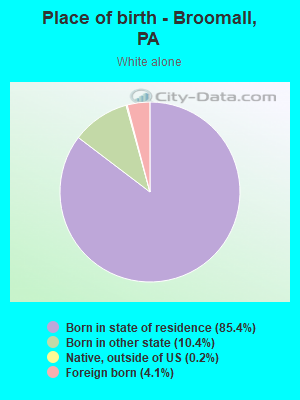
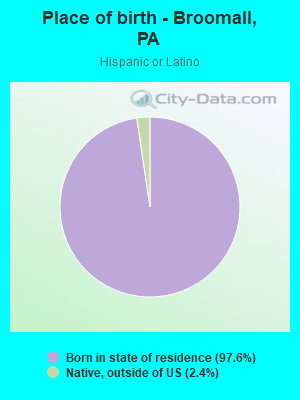
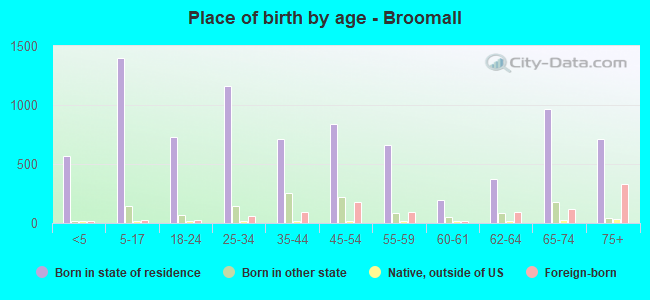
Place of birth - Born in state of residence (%)
Place of birth - Born in state of residence (%) - White
Place of birth - Born in state of residence (%) - Black or African American
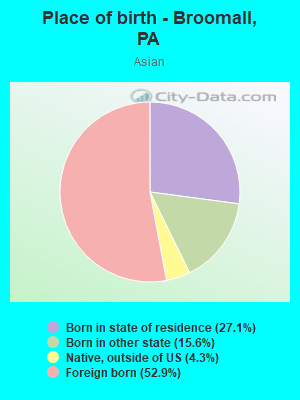
Place of birth - Born in state of residence (%) - Asian
Place of birth - Born in state of residence (%) - Hispanic or Latino
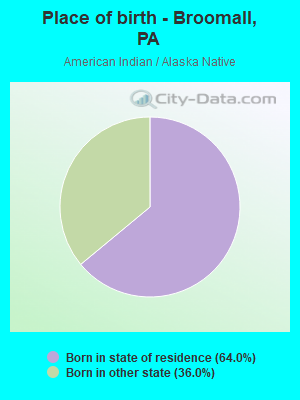
Place of birth - Born in state of residence (%) - American Indian and Alaska Native
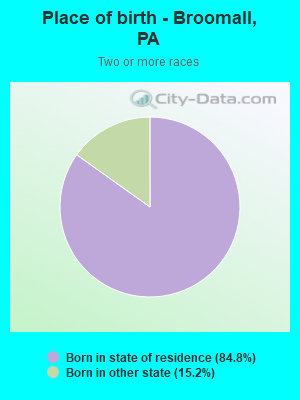
Place of birth - Born in state of residence (%) - Multirace
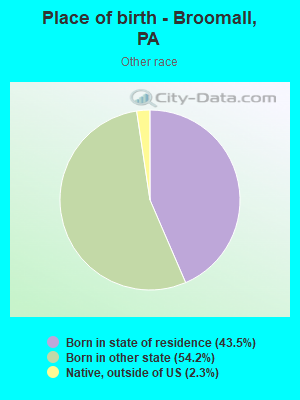
Place of birth - Born in state of residence (%) - Other Race
Place of birth - Born in other state (%)
Place of birth - Born in other state (%) - White
Place of birth - Born in other state (%) - Black or African American
Place of birth - Born in other state (%) - Asian
Place of birth - Born in other state (%) - Hispanic or Latino
Place of birth - Born in other state (%) - American Indian and Alaska Native
Place of birth - Born in other state (%) - Multirace
Place of birth - Born in other state (%) - Other Race
Place of birth - Native, outside of US (%)
Place of birth - Native, outside of US (%) - White
Place of birth - Native, outside of US (%) - Black or African American
Place of birth - Native, outside of US (%) - Asian
Place of birth - Native, outside of US (%) - Hispanic or Latino
Place of birth - Native, outside of US (%) - American Indian and Alaska Native
Place of birth - Native, outside of US (%) - Multirace
Place of birth - Native, outside of US (%) - Other Race
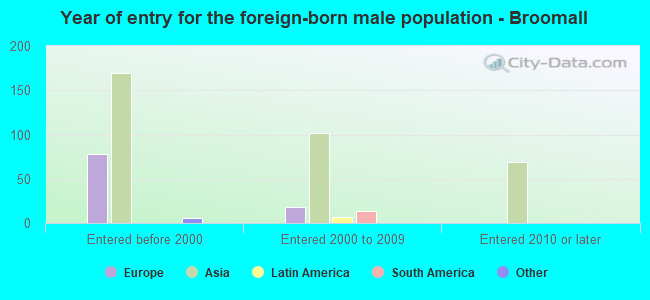
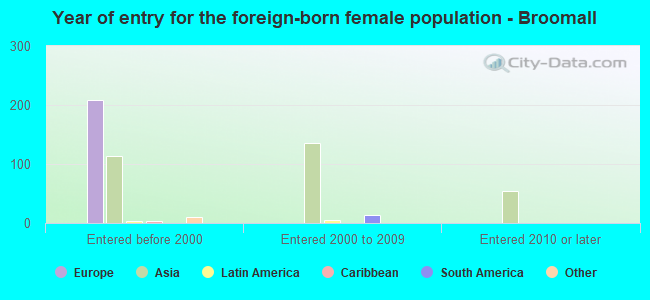
Place of birth - Foreign born (%)
Place of birth - Foreign born (%) - White
Place of birth - Foreign born (%) - Black or African American
Place of birth - Foreign born (%) - Asian
Place of birth - Foreign born (%) - Hispanic or Latino
Place of birth - Foreign born (%) - American Indian and Alaska Native
Place of birth - Foreign born (%) - Multirace
Place of birth - Foreign born (%) - Other Race
Residents speaking English at home (%)
Residents speaking English at home - Born in the United States (%)
Residents speaking English at home - Native, born elsewhere (%)
Residents speaking English at home - Foreign born (%)
Residents speaking Spanish at home (%)
Residents speaking Spanish at home - Born in the United States (%)
Residents speaking Spanish at home - Native, born elsewhere (%)
Residents speaking Spanish at home - Foreign born (%)
Residents speaking other language at home (%)
Residents speaking other language at home - Born in the United States (%)
Residents speaking other language at home - Native, born elsewhere (%)
Residents speaking other language at home - Foreign born (%)
Marital status - Never married (%)
Marital status - Now married (%)
Marital status - Separated (%)
Marital status - Widowed (%)
Marital status - Divorced (%)
Ancestries Reported - Arab (%)
Ancestries Reported - Czech (%)
Ancestries Reported - Danish (%)
Ancestries Reported - Dutch (%)
Ancestries Reported - English (%)
Ancestries Reported - French (%)
Ancestries Reported - French Canadian (%)
Ancestries Reported - German (%)
Ancestries Reported - Greek (%)
Ancestries Reported - Hungarian (%)
Ancestries Reported - Irish (%)
Ancestries Reported - Italian (%)
Ancestries Reported - Lithuanian (%)
Ancestries Reported - Norwegian (%)
Ancestries Reported - Polish (%)
Ancestries Reported - Portuguese (%)
Ancestries Reported - Russian (%)
Ancestries Reported - Scotch-Irish (%)
Ancestries Reported - Scottish (%)
Ancestries Reported - Slovak (%)
Ancestries Reported - Subsaharan African (%)
Ancestries Reported - Swedish (%)
Ancestries Reported - Swiss (%)
Ancestries Reported - Ukrainian (%)
Ancestries Reported - United States (%)
Ancestries Reported - Welsh (%)
Ancestries Reported - West Indian (%)
Ancestries Reported - Other (%)
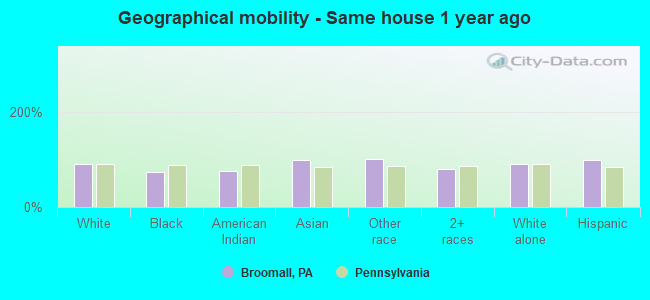
Geographical mobility - Same house 1 year ago (%)
Geographical mobility - Same house 1 year ago (%) - White
Geographical mobility - Same house 1 year ago (%) - Black or African American
Geographical mobility - Same house 1 year ago (%) - Asian
Geographical mobility - Same house 1 year ago (%) - Hispanic or Latino
Geographical mobility - Same house 1 year ago (%) - American Indian and Alaska Native
Geographical mobility - Same house 1 year ago (%) - Multirace
Geographical mobility - Same house 1 year ago (%) - Other Race
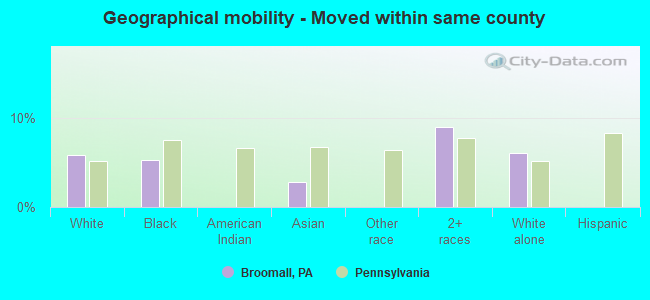
Geographical mobility - Moved within same county (%)
Geographical mobility - Moved within same county (%) - White
Geographical mobility - Moved within same county (%) - Black or African American
Geographical mobility - Moved within same county (%) - Asian
Geographical mobility - Moved within same county (%) - Hispanic or Latino
Geographical mobility - Moved within same county (%) - American Indian and Alaska Native
Geographical mobility - Moved within same county (%) - Multirace
Geographical mobility - Moved within same county (%) - Other Race
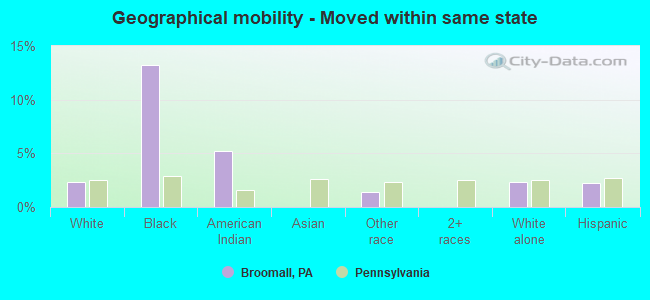
Geographical mobility - Moved from different county within same state (%)
Geographical mobility - Moved from different county within same state (%) - White
Geographical mobility - Moved from different county within same state (%) - Black or African American
Geographical mobility - Moved from different county within same state (%) - Asian
Geographical mobility - Moved from different county within same state (%) - Hispanic or Latino
Geographical mobility - Moved from different county within same state (%) - American Indian and Alaska Native
Geographical mobility - Moved from different county within same state (%) - Multirace
Geographical mobility - Moved from different county within same state (%) - Other Race
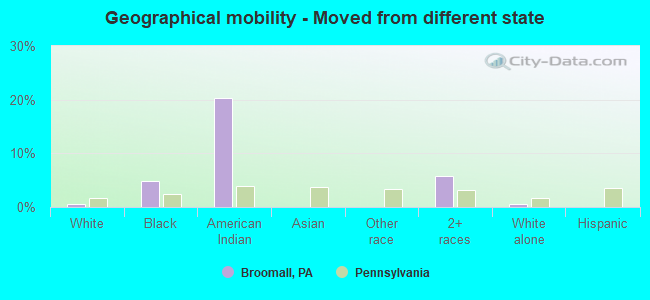
Geographical mobility - Moved from different state (%)
Geographical mobility - Moved from different state (%) - White
Geographical mobility - Moved from different state (%) - Black or African American
Geographical mobility - Moved from different state (%) - Asian
Geographical mobility - Moved from different state (%) - Hispanic or Latino
Geographical mobility - Moved from different state (%) - American Indian and Alaska Native
Geographical mobility - Moved from different state (%) - Multirace
Geographical mobility - Moved from different state (%) - Other Race
Geographical mobility - Moved from abroad (%)
Geographical mobility - Moved from abroad (%) - White
Geographical mobility - Moved from abroad (%) - Black or African American
Geographical mobility - Moved from abroad (%) - Asian
Geographical mobility - Moved from abroad (%) - Hispanic or Latino
Geographical mobility - Moved from abroad (%) - American Indian and Alaska Native
Geographical mobility - Moved from abroad (%) - Multirace
Geographical mobility - Moved from abroad (%) - Other Race
Place of birth for the foreign-born population - Ireland (%)
Place of birth for the foreign-born population - Denmark (%)
Place of birth for the foreign-born population - Norway (%)
Place of birth for the foreign-born population - Sweden (%)
Place of birth for the foreign-born population - United Kingdom (%)
Place of birth for the foreign-born population - England (%)
Place of birth for the foreign-born population - Scotland (%)
Place of birth for the foreign-born population - Other Northern Europe (%)
Place of birth for the foreign-born population - Austria (%)
Place of birth for the foreign-born population - Belgium (%)
Place of birth for the foreign-born population - France (%)
Place of birth for the foreign-born population - Germany (%)
Place of birth for the foreign-born population - Netherlands (%)
Place of birth for the foreign-born population - Switzerland (%)
Place of birth for the foreign-born population - Other Western Europe (%)
Place of birth for the foreign-born population - Greece (%)
Place of birth for the foreign-born population - Italy (%)
Place of birth for the foreign-born population - Portugal (%)
Place of birth for the foreign-born population - Spain (%)
Place of birth for the foreign-born population - Other Southern Europe (%)
Place of birth for the foreign-born population - Albania (%)
Place of birth for the foreign-born population - Belarus (%)
Place of birth for the foreign-born population - Bosnia and Herzegovina (%)
Place of birth for the foreign-born population - Bulgaria (%)
Place of birth for the foreign-born population - Croatia (%)
Place of birth for the foreign-born population - Czechoslovakia (%)
Place of birth for the foreign-born population - Hungary (%)
Place of birth for the foreign-born population - Latvia (%)
Place of birth for the foreign-born population - Lithuania (%)
Place of birth for the foreign-born population - North Macedonia (Macedonia) (%)
Place of birth for the foreign-born population - Moldova (%)
Place of birth for the foreign-born population - Poland (%)
Place of birth for the foreign-born population - Romania (%)
Place of birth for the foreign-born population - Russia (%)
Place of birth for the foreign-born population - Serbia (%)
Place of birth for the foreign-born population - Ukraine (%)
Place of birth for the foreign-born population - Other Eastern Europe (%)
Place of birth for the foreign-born population - China (%)
Place of birth for the foreign-born population - Hong Kong (%)
Place of birth for the foreign-born population - Taiwan (%)
Place of birth for the foreign-born population - Japan (%)
Place of birth for the foreign-born population - Korea (%)
Place of birth for the foreign-born population - Other Eastern Asia (%)
Place of birth for the foreign-born population - Afghanistan (%)
Place of birth for the foreign-born population - Bangladesh (%)
Place of birth for the foreign-born population - India (%)
Place of birth for the foreign-born population - Iran (%)
Place of birth for the foreign-born population - Kazakhstan (%)
Place of birth for the foreign-born population - Nepal (%)
Place of birth for the foreign-born population - Pakistan (%)
Place of birth for the foreign-born population - Sri Lanka (%)
Place of birth for the foreign-born population - Uzbekistan (%)
Place of birth for the foreign-born population - Other South Central Asia (%)
Place of birth for the foreign-born population - Burma (%)
Place of birth for the foreign-born population - Cambodia (%)
Place of birth for the foreign-born population - Indonesia (%)
Place of birth for the foreign-born population - Laos (%)
Place of birth for the foreign-born population - Malaysia (%)
Place of birth for the foreign-born population - Philippines (%)
Place of birth for the foreign-born population - Singapore (%)
Place of birth for the foreign-born population - Thailand (%)
Place of birth for the foreign-born population - Vietnam (%)
Place of birth for the foreign-born population - Other South Eastern Asia (%)
Place of birth for the foreign-born population - Armenia (%)
Place of birth for the foreign-born population - Iraq (%)
Place of birth for the foreign-born population - Israel (%)
Place of birth for the foreign-born population - Jordan (%)
Place of birth for the foreign-born population - Kuwait (%)
Place of birth for the foreign-born population - Lebanon (%)
Place of birth for the foreign-born population - Saudi Arabia (%)
Place of birth for the foreign-born population - Syria (%)
Place of birth for the foreign-born population - Turkey (%)
Place of birth for the foreign-born population - Yemen (%)
Place of birth for the foreign-born population - Other Western Asia (%)
Place of birth for the foreign-born population - Eritrea (%)
Place of birth for the foreign-born population - Ethiopia (%)
Place of birth for the foreign-born population - Kenya (%)
Place of birth for the foreign-born population - Somalia (%)
Place of birth for the foreign-born population - Uganda (%)
Place of birth for the foreign-born population - Zimbabwe (%)
Place of birth for the foreign-born population - Other Eastern Africa (%)
Place of birth for the foreign-born population - Cameroon (%)
Place of birth for the foreign-born population - Congo (%)
Place of birth for the foreign-born population - Democratic Republic of Congo (Zaire) (%)
Place of birth for the foreign-born population - Other Middle Africa (%)
Place of birth for the foreign-born population - Egypt (%)
Place of birth for the foreign-born population - Morocco (%)
Place of birth for the foreign-born population - Sudan (%)
Place of birth for the foreign-born population - Other Northern Africa (%)
Place of birth for the foreign-born population - South Africa (%)
Place of birth for the foreign-born population - Other Southern Africa (%)
Place of birth for the foreign-born population - Cabo Verde (%)
Place of birth for the foreign-born population - Ghana (%)
Place of birth for the foreign-born population - Liberia (%)
Place of birth for the foreign-born population - Nigeria (%)
Place of birth for the foreign-born population - Senegal (%)
Place of birth for the foreign-born population - Sierra Leone (%)
Place of birth for the foreign-born population - Other Western Africa (%)
Place of birth for the foreign-born population - Australia (%)
Place of birth for the foreign-born population - New Zealand (%)
Place of birth for the foreign-born population - Fiji (%)
Place of birth for the foreign-born population - Micronesia (%)
Place of birth for the foreign-born population - Bahamas (%)
Place of birth for the foreign-born population - Barbados (%)
Place of birth for the foreign-born population - Cuba (%)
Place of birth for the foreign-born population - Dominica (%)
Place of birth for the foreign-born population - Dominican Republic (%)
Place of birth for the foreign-born population - Grenada (%)
Place of birth for the foreign-born population - Haiti (%)
Place of birth for the foreign-born population - Jamaica (%)
Place of birth for the foreign-born population - St. Vincent and the Grenadines (%)
Place of birth for the foreign-born population - Trinidad and Tobago (%)
Place of birth for the foreign-born population - West Indies (%)
Place of birth for the foreign-born population - Other Caribbean (%)
Place of birth for the foreign-born population - Belize (%)
Place of birth for the foreign-born population - Costa Rica (%)
Place of birth for the foreign-born population - El Salvador (%)
Place of birth for the foreign-born population - Guatemala (%)
Place of birth for the foreign-born population - Honduras (%)
Place of birth for the foreign-born population - Mexico (%)
Place of birth for the foreign-born population - Nicaragua (%)
Place of birth for the foreign-born population - Panama (%)
Place of birth for the foreign-born population - Other Central America (%)
Place of birth for the foreign-born population - Argentina (%)
Place of birth for the foreign-born population - Bolivia (%)
Place of birth for the foreign-born population - Brazil (%)
Place of birth for the foreign-born population - Chile (%)
Place of birth for the foreign-born population - Colombia (%)
Place of birth for the foreign-born population - Ecuador (%)
Place of birth for the foreign-born population - Guyana (%)
Place of birth for the foreign-born population - Peru (%)
Place of birth for the foreign-born population - Uruguay (%)
Place of birth for the foreign-born population - Venezuela (%)
Place of birth for the foreign-born population - Other South America (%)
Place of birth for the foreign-born population - Canada (%)
Place of birth for the foreign-born population - Other Northern America (%)
Place of birth for the foreign-born population - Other (%)
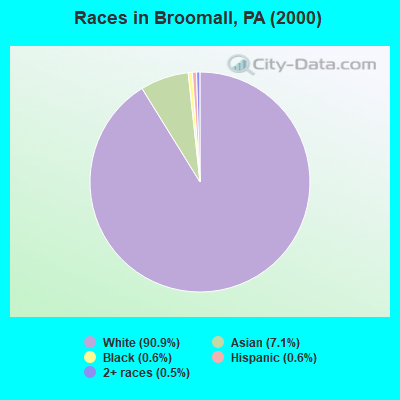
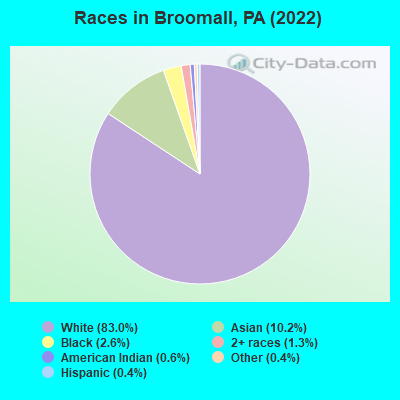
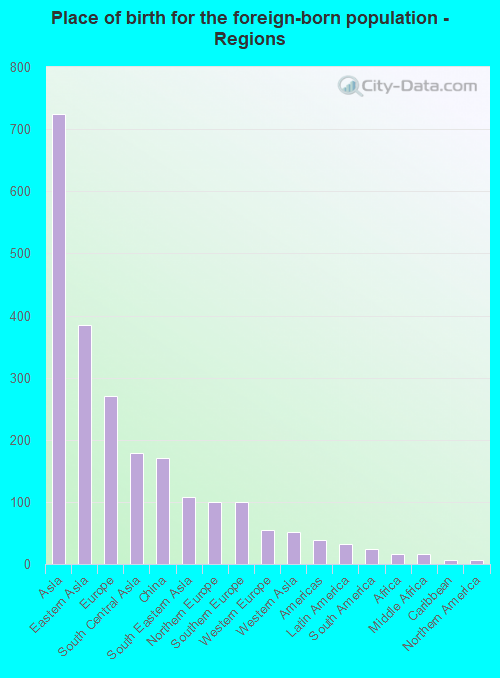
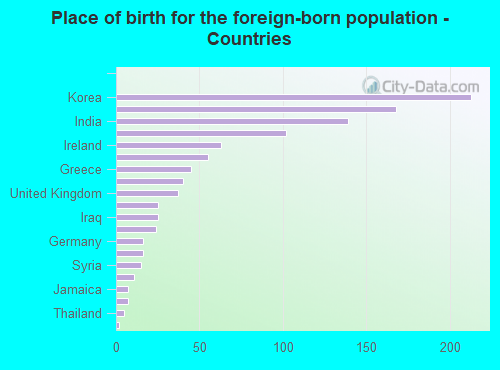
According to 2022 data, the most numerous races in Broomall, PA are White alone (8,853 residents), Black alone (278 residents), and Hispanic (38 residents). 87.1% of Broomall residents speak English at home. 9.9% of Broomall, PA residents are foreign-born (6.5% born in Asia, 2.4% born in Europe), which is 29.1% greater than the foreign-born rate of 7.0% across the entire state of Pennsylvania.
Race distribution in Broomall
2000 2022
10,322,455 84.1% White alone 1,202,437 9.8% Black alone 394,088 3.2% Hispanic 218,296 1.8% Asian alone 113,097 0.9% Two or more races 13,086 0.1% Other race alone 14,904 0.1% American Indian alone 2,691 0.02% Native Hawaiian and Other
9,487,228 73.1% White alone 1,311,581 10.1% Black alone 1,115,997 8.6% Hispanic 493,942 3.8% Two or more races 487,124 3.8% Asian alone 63,582 0.5% Other race alone 10,130 0.08% American Indian alone 2,424 0.02% Native Hawaiian and Other
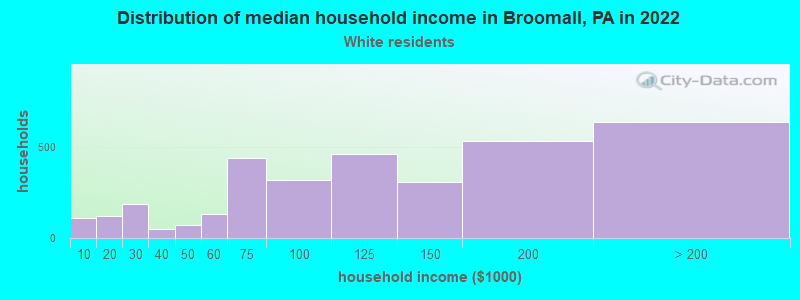
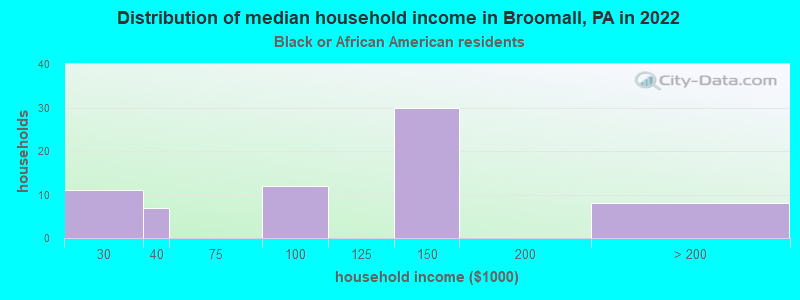
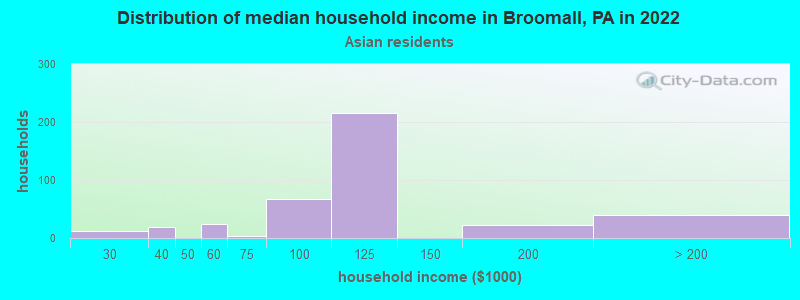
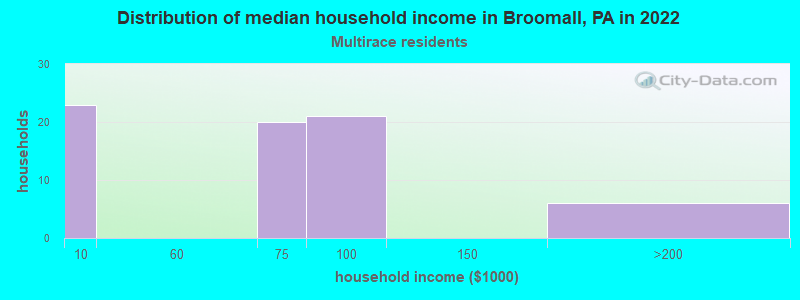
Income and house value in Broomall Median household income in 2022 $114,377 White non-Hispanic householders$140,564 Black householders$111,569 Asian householders$71,863 Two or more races householdersMedian 2022 house value $464,317 White Non-Hispanic householders$178,162 Black or African American householders$445,405 American Indian or Alaska Native householders $470,073 Asian householders$260,390 Some other race householders$445,405 Two or more races householders$502,417 Hispanic or Latino householders
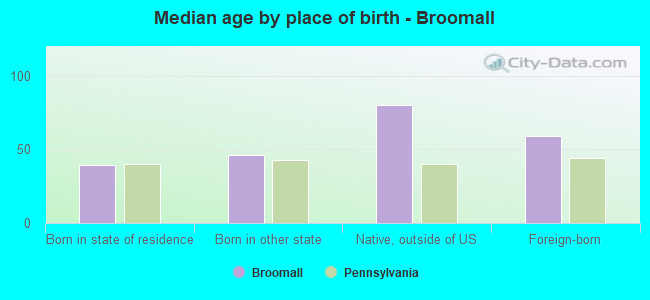
Median age by race in Broomall
44.8 Median age for White residents44.9 43.9 37.2 Median age for Black or African American residents33.1 45.8 21.1 Median age for American Indian / Alaska Native residents18.9 55.8 49.2 Median age for Asian residents49.2 49.0 -680,432,644.4 Median age for Native Hawaiian / Pacific Islander residents-666,666,666.0 -747,474,746.7 29.2 Median age for Other race residents-575,757,575.2 31.2 29.3 Median age for Two or more races residents31.5 24.5 44.6 Median age for White alone residents44.9 43.8 27.3 Median age for Hispanic or Latino residents26.6 -642,246,641.6
Owner/renter occupied households by race in Broomall
House owners and renters - White residents 2,778 82.4% Owner occupied592 17.6% Renter occupiedHouse owners and renters - Black or African American residents 30 44.1% Owner occupied39 55.9% Renter occupiedHouse owners and renters - American Indian / Alaska Native residents 16 100.0% Renter occupiedHouse owners and renters - Asian residents 260 77.0% Owner occupied77 23.0% Renter occupiedHouse owners and renters - Other race residents 12 100.0% Owner occupiedHouse owners and renters - Two or more races residents 33 49.4% Owner occupied34 50.6% Renter occupiedHouse owners and renters - White alone residents 2,786 82.2% Owner occupied605 17.8% Renter occupied
Language usage in Broomall
English speakers - Total 87.1% of residents of Broomall speak English at home.
0.2% of residents speak Spanish at home 11 52.4% Speak English very well10 47.6% Speak English less than very well12.7% of residents speak other language at home 879 69.2% Speak English very well392 30.8% Speak English less than very well
English speakers - Born in the United States 91.5% of residents of Broomall speak English at home.
8.3% of residents speak other language at home 103 100.0% Speak English very well
English speakers - Native, born elsewhere 7.3% of residents of Broomall speak English at home.
85.5% of residents speak other language at home 47 100.0% Speak English less than very well
English speakers - Foreign-born 19.2% of residents of Broomall speak English at home.
80.2% of residents speak other language at home 401 53.8% Speak English very well345 46.2% Speak English less than very well
White (Caucasian) - Speak only English Native:
96.7% (7,649)Foreign-born:
44.6% (146)
White (Caucasian) - Speak another language Native:
3.1% (247)Foreign-born:
56.9% (186)
Asian - Speak only English Native:
54.9% (307)Foreign-born:
9.5% (55)
Asian - Speak another language Native:
44.6% (249)Foreign-born:
88.6% (514)
White alone - Speak only English Native:
96.3% (7,625)Foreign-born:
41.2% (147)
White alone - Speak another language Native:
3.5% (274)Foreign-born:
59.2% (212)
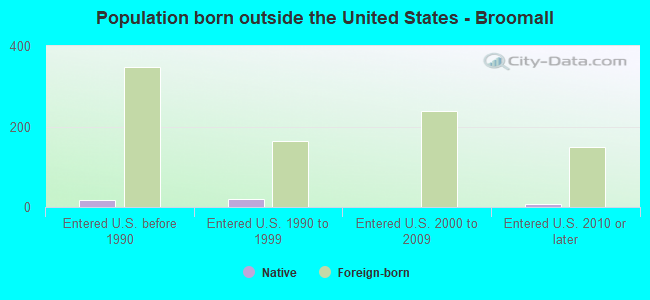
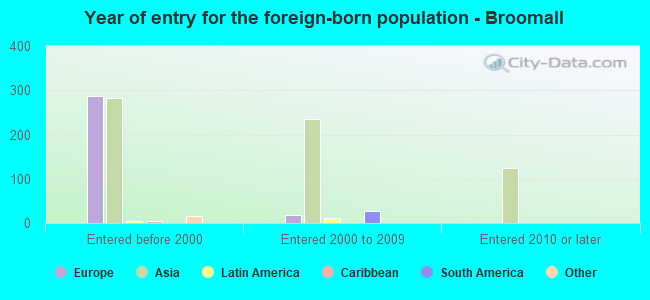
Foreign-born residents in Broomall 1,052 residents are foreign born (6.5% Asia , 2.4% Europe ).
This city:
9.9%Pennsylvania:
7.3%
Marital status for residents in Broomall Marital status - White (Caucasian) population 15 years and over
Males 27.0% Never married62.8% Now married0.3% Separated2.2% Widowed7.7% DivorcedFemales 27.1% Never married52.1% Now married1.3% Separated11.1% Widowed8.4% DivorcedWomen who gave birth in the past 12 months Now married:
100.0% (84)Unmarried:
0.0% (0)
Women who did not give birth in the past 12 months Now married:
47.6% (786)Unmarried:
52.4% (863)
Marital status - Black or African American population 15 years and over
Males 72.2% Never married27.8% Now married0.0% Separated0.0% Widowed0.0% DivorcedFemales 42.7% Never married24.5% Now married9.1% Separated16.4% Widowed7.3% DivorcedWomen who did not give birth in the past 12 months Now married:
37.5% (27)Unmarried:
62.5% (46)
Marital status - Asian population 15 years and over
Males 25.6% Never married72.1% Now married2.3% Separated0.0% Widowed0.0% DivorcedFemales 28.1% Never married69.7% Now married0.0% Separated2.1% Widowed0.0% DivorcedWomen who did not give birth in the past 12 months Now married:
47.0% (121)Unmarried:
53.0% (137)
Marital status - Other race population 15 years and over
Males 9.1% Never married90.9% Now married0.0% Separated0.0% Widowed0.0% DivorcedFemales 68.8% Never married31.2% Now married0.0% Separated0.0% Widowed0.0% DivorcedWomen who did not give birth in the past 12 months Now married:
0.0% (0)Unmarried:
100.0% (27)
Marital status - Two or more races population 15 years and over
Males 67.5% Never married32.5% Now married0.0% Separated0.0% Widowed0.0% DivorcedFemales 51.8% Never married7.1% Now married0.0% Separated0.0% Widowed41.1% DivorcedWomen who gave birth in the past 12 months Now married:
100.0% (5)Unmarried:
0.0% (0)
Women who did not give birth in the past 12 months Now married:
0.0% (0)Unmarried:
100.0% (35)
Marital status - White alone, not Hispanic / Latino population 15 years and over
Males 26.7% Never married63.0% Now married0.3% Separated2.2% Widowed7.7% DivorcedFemales 26.9% Never married52.2% Now married1.3% Separated11.2% Widowed8.4% DivorcedWomen who gave birth in the past 12 months Now married:
100.0% (85)Unmarried:
0.0% (0)
Women who did not give birth in the past 12 months Now married:
47.9% (795)Unmarried:
52.1% (863)
Marital status - Hispanic or Latino population 15 years and over
Males 65.4% Never married34.6% Now married0.0% Separated0.0% Widowed0.0% DivorcedFemales 100.0% Never married0.0% Now married0.0% Separated0.0% Widowed0.0% DivorcedWomen who did not give birth in the past 12 months Now married:
0.0% (0)Unmarried:
100.0% (11)
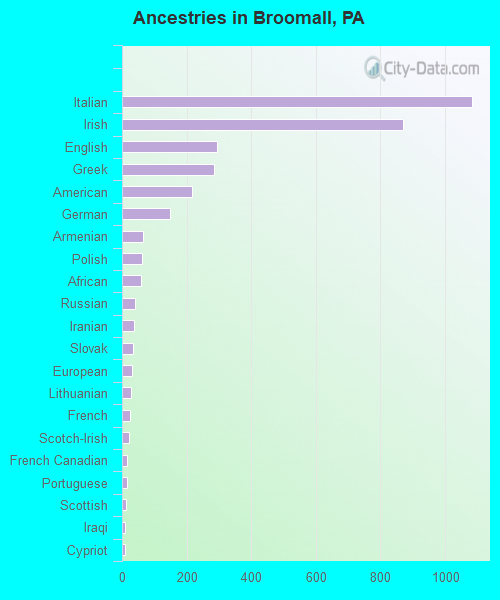
Ancestries in Broomall
1,082 25.5% Italian871 20.5% Irish294 6.9% English286 6.7% Greek216 5.1% American149 3.5% German64 1.5% Armenian63 1.5% Polish59 1.4% African41 1.0% Russian37 0.9% Iranian35 0.8% Slovak30 0.7% European28 0.7% Lithuanian26 0.6% French22 0.5% Scotch-Irish14 0.3% French Canadian14 0.3% Portuguese11 0.3% Scottish10 0.2% Iraqi10 0.2% Cypriot9 0.2% Welsh8 0.2% Northern European8 0.2% Ukrainian7 0.2% Croatian6 0.1% Dutch3 0.07% Swedish1 0.02% Lebanese
Children Nativity (place of birth) in Broomall
Children under 6 years - Living with two parents Both parents native 495 100.0% NativeBoth parents foreign-born 19 100.0% NativeOne native, one foreign-born parent 27 100.0% NativeChildren under 6 years - Living with one parent Native parent 45 100.0% NativeChildren 6 to 17 years - Living with two parents Both parents native 957 100.0% NativeBoth parents foreign-born 134 100.0% NativeOne native, one foreign-born parent 52 91.2% Native5 8.8% Foreign-bornChildren 6 to 17 years - Living with one parent Native parent 242 83.8% Native47 16.2% Foreign-bornForeign-born parent 26 100.0% Native
Grandparents responsible for own grandchildren in Broomall
Grandparents (30 to 59 years) White / Caucasian 8 100.0% Not responsible for grandchildrenAsian 21 100.0% Not responsible for grandchildrenWhite alone, not Hispanic / Latino 8 100.0% Not responsible for grandchildrenGrandparents (60 years and over) White / Caucasian 22 17.7% Responsible for grandchildren104 82.3% Not responsible for grandchildrenAsian 6 100.0% Responsible for grandchildrenWhite alone, not Hispanic / Latino 22 17.5% Responsible for grandchildren106 82.5% Not responsible for grandchildren