Races in Broussard, Louisiana (LA) Detailed Stats
Data:
Races - White alone (%)
Races - White alone (% change since 2000)
Races - Black alone (%)
Races - Black alone (% change since 2000)
Races - American Indian alone (%)
Races - American Indian alone (% change since 2000)
Races - Asian alone (%)
Races - Asian alone (% change since 2000)
Races - Hispanic (%)
Races - Hispanic (% change since 2000)
Races - Native Hawaiian and Other Pacific Islander alone (%)
Races - Native Hawaiian and Other Pacific Islander alone (% change since 2000)
Races - Two or more races(%)
Races - Two or more races(% change since 2000)
Races - Other race alone (%)
Races - Other race alone (% change since 2000)
Racial diversity
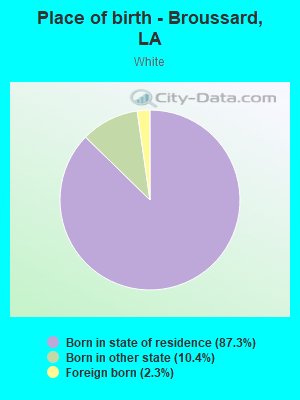
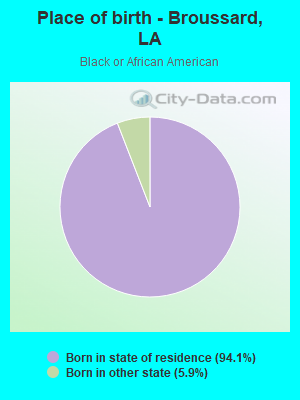
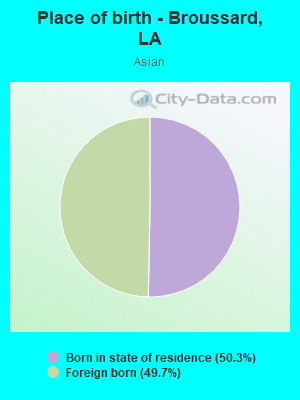
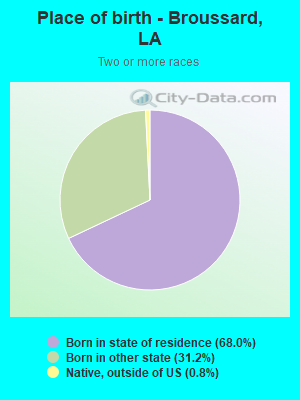
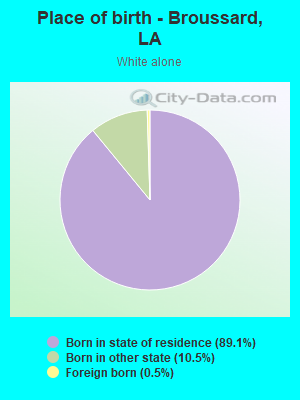
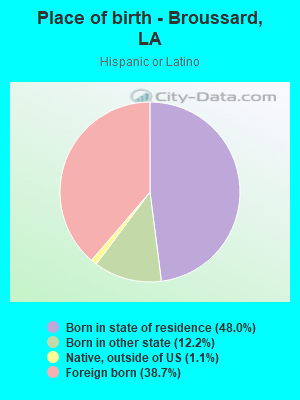
Place of birth - Born in state of residence (%)
Place of birth - Born in state of residence (%) - White
Place of birth - Born in state of residence (%) - Black or African American
Place of birth - Born in state of residence (%) - Asian
Place of birth - Born in state of residence (%) - Hispanic or Latino
Place of birth - Born in state of residence (%) - American Indian and Alaska Native
Place of birth - Born in state of residence (%) - Multirace
Place of birth - Born in state of residence (%) - Other Race
Place of birth - Born in other state (%)
Place of birth - Born in other state (%) - White
Place of birth - Born in other state (%) - Black or African American
Place of birth - Born in other state (%) - Asian
Place of birth - Born in other state (%) - Hispanic or Latino
Place of birth - Born in other state (%) - American Indian and Alaska Native
Place of birth - Born in other state (%) - Multirace
Place of birth - Born in other state (%) - Other Race
Place of birth - Native, outside of US (%)
Place of birth - Native, outside of US (%) - White
Place of birth - Native, outside of US (%) - Black or African American
Place of birth - Native, outside of US (%) - Asian
Place of birth - Native, outside of US (%) - Hispanic or Latino
Place of birth - Native, outside of US (%) - American Indian and Alaska Native
Place of birth - Native, outside of US (%) - Multirace
Place of birth - Native, outside of US (%) - Other Race
Place of birth - Foreign born (%)
Place of birth - Foreign born (%) - White
Place of birth - Foreign born (%) - Black or African American
Place of birth - Foreign born (%) - Asian
Place of birth - Foreign born (%) - Hispanic or Latino
Place of birth - Foreign born (%) - American Indian and Alaska Native
Place of birth - Foreign born (%) - Multirace
Place of birth - Foreign born (%) - Other Race
Residents speaking English at home (%)
Residents speaking English at home - Born in the United States (%)
Residents speaking English at home - Native, born elsewhere (%)
Residents speaking English at home - Foreign born (%)
Residents speaking Spanish at home (%)
Residents speaking Spanish at home - Born in the United States (%)
Residents speaking Spanish at home - Native, born elsewhere (%)
Residents speaking Spanish at home - Foreign born (%)
Residents speaking other language at home (%)
Residents speaking other language at home - Born in the United States (%)
Residents speaking other language at home - Native, born elsewhere (%)
Residents speaking other language at home - Foreign born (%)
Marital status - Never married (%)
Marital status - Now married (%)
Marital status - Separated (%)
Marital status - Widowed (%)
Marital status - Divorced (%)
Ancestries Reported - Arab (%)
Ancestries Reported - Czech (%)
Ancestries Reported - Danish (%)
Ancestries Reported - Dutch (%)
Ancestries Reported - English (%)
Ancestries Reported - French (%)
Ancestries Reported - French Canadian (%)
Ancestries Reported - German (%)
Ancestries Reported - Greek (%)
Ancestries Reported - Hungarian (%)
Ancestries Reported - Irish (%)
Ancestries Reported - Italian (%)
Ancestries Reported - Lithuanian (%)
Ancestries Reported - Norwegian (%)
Ancestries Reported - Polish (%)
Ancestries Reported - Portuguese (%)
Ancestries Reported - Russian (%)
Ancestries Reported - Scotch-Irish (%)
Ancestries Reported - Scottish (%)
Ancestries Reported - Slovak (%)
Ancestries Reported - Subsaharan African (%)
Ancestries Reported - Swedish (%)
Ancestries Reported - Swiss (%)
Ancestries Reported - Ukrainian (%)
Ancestries Reported - United States (%)
Ancestries Reported - Welsh (%)
Ancestries Reported - West Indian (%)
Ancestries Reported - Other (%)
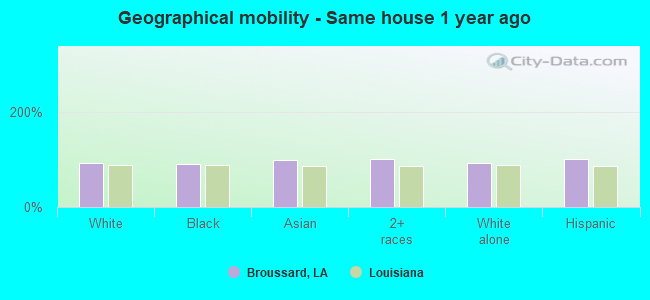
Geographical mobility - Same house 1 year ago (%)
Geographical mobility - Same house 1 year ago (%) - White
Geographical mobility - Same house 1 year ago (%) - Black or African American
Geographical mobility - Same house 1 year ago (%) - Asian
Geographical mobility - Same house 1 year ago (%) - Hispanic or Latino
Geographical mobility - Same house 1 year ago (%) - American Indian and Alaska Native
Geographical mobility - Same house 1 year ago (%) - Multirace
Geographical mobility - Same house 1 year ago (%) - Other Race
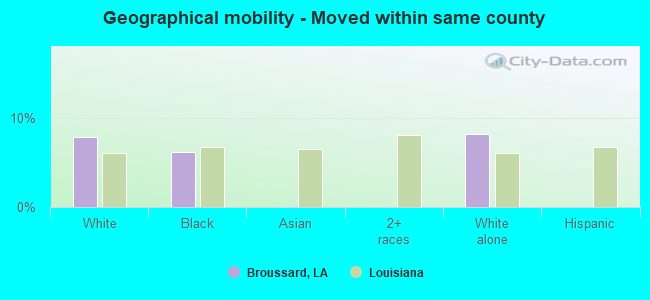
Geographical mobility - Moved within same county (%)
Geographical mobility - Moved within same county (%) - White
Geographical mobility - Moved within same county (%) - Black or African American
Geographical mobility - Moved within same county (%) - Asian
Geographical mobility - Moved within same county (%) - Hispanic or Latino
Geographical mobility - Moved within same county (%) - American Indian and Alaska Native
Geographical mobility - Moved within same county (%) - Multirace
Geographical mobility - Moved within same county (%) - Other Race
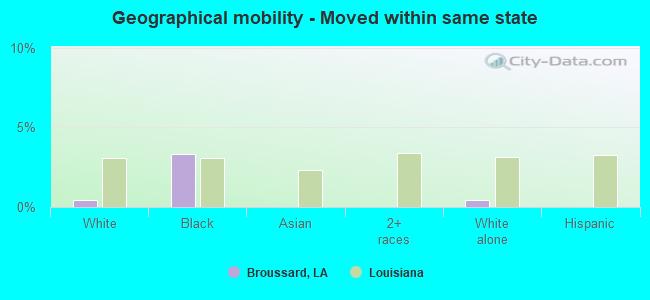
Geographical mobility - Moved from different county within same state (%)
Geographical mobility - Moved from different county within same state (%) - White
Geographical mobility - Moved from different county within same state (%) - Black or African American
Geographical mobility - Moved from different county within same state (%) - Asian
Geographical mobility - Moved from different county within same state (%) - Hispanic or Latino
Geographical mobility - Moved from different county within same state (%) - American Indian and Alaska Native
Geographical mobility - Moved from different county within same state (%) - Multirace
Geographical mobility - Moved from different county within same state (%) - Other Race
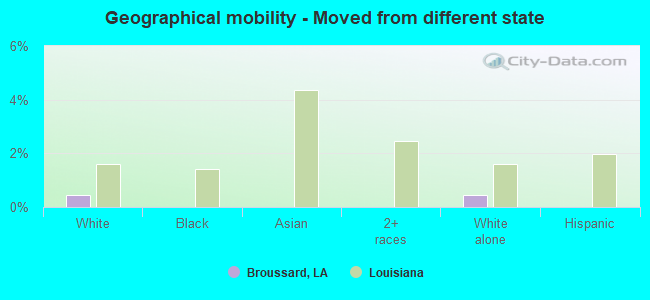
Geographical mobility - Moved from different state (%)
Geographical mobility - Moved from different state (%) - White
Geographical mobility - Moved from different state (%) - Black or African American
Geographical mobility - Moved from different state (%) - Asian
Geographical mobility - Moved from different state (%) - Hispanic or Latino
Geographical mobility - Moved from different state (%) - American Indian and Alaska Native
Geographical mobility - Moved from different state (%) - Multirace
Geographical mobility - Moved from different state (%) - Other Race
Geographical mobility - Moved from abroad (%)
Geographical mobility - Moved from abroad (%) - White
Geographical mobility - Moved from abroad (%) - Black or African American
Geographical mobility - Moved from abroad (%) - Asian
Geographical mobility - Moved from abroad (%) - Hispanic or Latino
Geographical mobility - Moved from abroad (%) - American Indian and Alaska Native
Geographical mobility - Moved from abroad (%) - Multirace
Geographical mobility - Moved from abroad (%) - Other Race
Place of birth for the foreign-born population - Ireland (%)
Place of birth for the foreign-born population - Denmark (%)
Place of birth for the foreign-born population - Norway (%)
Place of birth for the foreign-born population - Sweden (%)
Place of birth for the foreign-born population - United Kingdom (%)
Place of birth for the foreign-born population - England (%)
Place of birth for the foreign-born population - Scotland (%)
Place of birth for the foreign-born population - Other Northern Europe (%)
Place of birth for the foreign-born population - Austria (%)
Place of birth for the foreign-born population - Belgium (%)
Place of birth for the foreign-born population - France (%)
Place of birth for the foreign-born population - Germany (%)
Place of birth for the foreign-born population - Netherlands (%)
Place of birth for the foreign-born population - Switzerland (%)
Place of birth for the foreign-born population - Other Western Europe (%)
Place of birth for the foreign-born population - Greece (%)
Place of birth for the foreign-born population - Italy (%)
Place of birth for the foreign-born population - Portugal (%)
Place of birth for the foreign-born population - Spain (%)
Place of birth for the foreign-born population - Other Southern Europe (%)
Place of birth for the foreign-born population - Albania (%)
Place of birth for the foreign-born population - Belarus (%)
Place of birth for the foreign-born population - Bosnia and Herzegovina (%)
Place of birth for the foreign-born population - Bulgaria (%)
Place of birth for the foreign-born population - Croatia (%)
Place of birth for the foreign-born population - Czechoslovakia (%)
Place of birth for the foreign-born population - Hungary (%)
Place of birth for the foreign-born population - Latvia (%)
Place of birth for the foreign-born population - Lithuania (%)
Place of birth for the foreign-born population - North Macedonia (Macedonia) (%)
Place of birth for the foreign-born population - Moldova (%)
Place of birth for the foreign-born population - Poland (%)
Place of birth for the foreign-born population - Romania (%)
Place of birth for the foreign-born population - Russia (%)
Place of birth for the foreign-born population - Serbia (%)
Place of birth for the foreign-born population - Ukraine (%)
Place of birth for the foreign-born population - Other Eastern Europe (%)
Place of birth for the foreign-born population - China (%)
Place of birth for the foreign-born population - Hong Kong (%)
Place of birth for the foreign-born population - Taiwan (%)
Place of birth for the foreign-born population - Japan (%)
Place of birth for the foreign-born population - Korea (%)
Place of birth for the foreign-born population - Other Eastern Asia (%)
Place of birth for the foreign-born population - Afghanistan (%)
Place of birth for the foreign-born population - Bangladesh (%)
Place of birth for the foreign-born population - India (%)
Place of birth for the foreign-born population - Iran (%)
Place of birth for the foreign-born population - Kazakhstan (%)
Place of birth for the foreign-born population - Nepal (%)
Place of birth for the foreign-born population - Pakistan (%)
Place of birth for the foreign-born population - Sri Lanka (%)
Place of birth for the foreign-born population - Uzbekistan (%)
Place of birth for the foreign-born population - Other South Central Asia (%)
Place of birth for the foreign-born population - Burma (%)
Place of birth for the foreign-born population - Cambodia (%)
Place of birth for the foreign-born population - Indonesia (%)
Place of birth for the foreign-born population - Laos (%)
Place of birth for the foreign-born population - Malaysia (%)
Place of birth for the foreign-born population - Philippines (%)
Place of birth for the foreign-born population - Singapore (%)
Place of birth for the foreign-born population - Thailand (%)
Place of birth for the foreign-born population - Vietnam (%)
Place of birth for the foreign-born population - Other South Eastern Asia (%)
Place of birth for the foreign-born population - Armenia (%)
Place of birth for the foreign-born population - Iraq (%)
Place of birth for the foreign-born population - Israel (%)
Place of birth for the foreign-born population - Jordan (%)
Place of birth for the foreign-born population - Kuwait (%)
Place of birth for the foreign-born population - Lebanon (%)
Place of birth for the foreign-born population - Saudi Arabia (%)
Place of birth for the foreign-born population - Syria (%)
Place of birth for the foreign-born population - Turkey (%)
Place of birth for the foreign-born population - Yemen (%)
Place of birth for the foreign-born population - Other Western Asia (%)
Place of birth for the foreign-born population - Eritrea (%)
Place of birth for the foreign-born population - Ethiopia (%)
Place of birth for the foreign-born population - Kenya (%)
Place of birth for the foreign-born population - Somalia (%)
Place of birth for the foreign-born population - Uganda (%)
Place of birth for the foreign-born population - Zimbabwe (%)
Place of birth for the foreign-born population - Other Eastern Africa (%)
Place of birth for the foreign-born population - Cameroon (%)
Place of birth for the foreign-born population - Congo (%)
Place of birth for the foreign-born population - Democratic Republic of Congo (Zaire) (%)
Place of birth for the foreign-born population - Other Middle Africa (%)
Place of birth for the foreign-born population - Egypt (%)
Place of birth for the foreign-born population - Morocco (%)
Place of birth for the foreign-born population - Sudan (%)
Place of birth for the foreign-born population - Other Northern Africa (%)
Place of birth for the foreign-born population - South Africa (%)
Place of birth for the foreign-born population - Other Southern Africa (%)
Place of birth for the foreign-born population - Cabo Verde (%)
Place of birth for the foreign-born population - Ghana (%)
Place of birth for the foreign-born population - Liberia (%)
Place of birth for the foreign-born population - Nigeria (%)
Place of birth for the foreign-born population - Senegal (%)
Place of birth for the foreign-born population - Sierra Leone (%)
Place of birth for the foreign-born population - Other Western Africa (%)
Place of birth for the foreign-born population - Australia (%)
Place of birth for the foreign-born population - New Zealand (%)
Place of birth for the foreign-born population - Fiji (%)
Place of birth for the foreign-born population - Micronesia (%)
Place of birth for the foreign-born population - Bahamas (%)
Place of birth for the foreign-born population - Barbados (%)
Place of birth for the foreign-born population - Cuba (%)
Place of birth for the foreign-born population - Dominica (%)
Place of birth for the foreign-born population - Dominican Republic (%)
Place of birth for the foreign-born population - Grenada (%)
Place of birth for the foreign-born population - Haiti (%)
Place of birth for the foreign-born population - Jamaica (%)
Place of birth for the foreign-born population - St. Vincent and the Grenadines (%)
Place of birth for the foreign-born population - Trinidad and Tobago (%)
Place of birth for the foreign-born population - West Indies (%)
Place of birth for the foreign-born population - Other Caribbean (%)
Place of birth for the foreign-born population - Belize (%)
Place of birth for the foreign-born population - Costa Rica (%)
Place of birth for the foreign-born population - El Salvador (%)
Place of birth for the foreign-born population - Guatemala (%)
Place of birth for the foreign-born population - Honduras (%)
Place of birth for the foreign-born population - Mexico (%)
Place of birth for the foreign-born population - Nicaragua (%)
Place of birth for the foreign-born population - Panama (%)
Place of birth for the foreign-born population - Other Central America (%)
Place of birth for the foreign-born population - Argentina (%)
Place of birth for the foreign-born population - Bolivia (%)
Place of birth for the foreign-born population - Brazil (%)
Place of birth for the foreign-born population - Chile (%)
Place of birth for the foreign-born population - Colombia (%)
Place of birth for the foreign-born population - Ecuador (%)
Place of birth for the foreign-born population - Guyana (%)
Place of birth for the foreign-born population - Peru (%)
Place of birth for the foreign-born population - Uruguay (%)
Place of birth for the foreign-born population - Venezuela (%)
Place of birth for the foreign-born population - Other South America (%)
Place of birth for the foreign-born population - Canada (%)
Place of birth for the foreign-born population - Other Northern America (%)
Place of birth for the foreign-born population - Other (%)
Latest news about races in Broussard, LA collected exclusively by city-data.com from local newspapers, TV, and radio stations
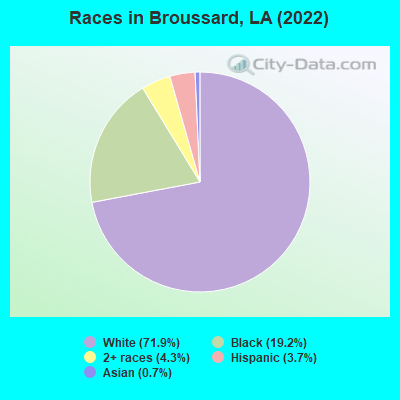
According to 2022 data, the most numerous races in Broussard, LA are White alone (9,759 residents), Black alone (2,601 residents), and Hispanic (499 residents). 94.8% of Broussard residents speak English at home. 3.1% of Broussard, LA residents are foreign-born (2.0% born in Latin America, 0.8% born in Europe, 0.4% born in Asia), which is 27.2% less than the foreign-born rate of 4.0% across the entire state of Louisiana.
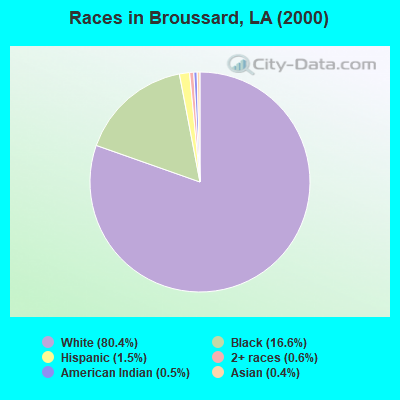
Race distribution in Broussard
2000 2022
2,794,391 62.5% White alone 1,443,390 32.3% Black alone 107,738 2.4% Hispanic 54,256 1.2% Asian alone 39,260 0.9% Two or more races 24,129 0.5% American Indian alone 4,736 0.1% Other race alone 1,076 0.02% Native Hawaiian and Other
2,603,221 56.7% White alone 1,420,055 30.9% Black alone 262,213 5.7% Hispanic 183,270 4.0% Two or more races 81,169 1.8% Asian alone 19,991 0.4% American Indian alone 18,043 0.4% Other race alone 2,279 0.05% Native Hawaiian and Other
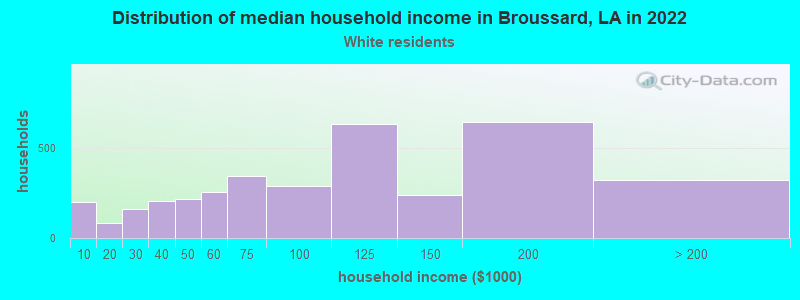
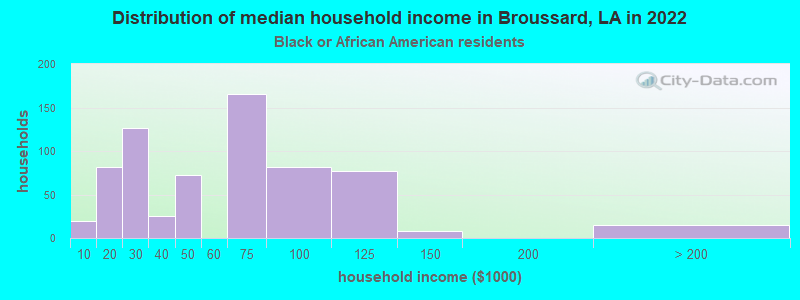
Income and house value in Broussard Median household income in 2022 $81,768 White non-Hispanic householders$66,620 Black householders$150,198 Two or more races householdersover $200,000 Hispanic or Latino race householdersMedian 2022 house value $329,922 White Non-Hispanic householders$155,693 Black or African American householders$200,795 Two or more races householders$214,387 Hispanic or Latino householders
Median age by race in Broussard
34.6 Median age for White residents31.7 37.1 26.1 Median age for Black or African American residents18.0 25.7 -764,444,443.7 Median age for American Indian / Alaska Native residents-721,428,570.7 -781,341,107.1 45.3 Median age for Asian residents-873,429,950.8 6.1 -821,138,210.6 Median age for Native Hawaiian / Pacific Islander residents-666,666,666.0 -666,666,666.0 -371,111,110.7 Median age for Other race residents-633,663,365.7 -448,356,807.1 33.4 Median age for Two or more races residents34.9 30.7 34.0 Median age for White alone residents30.9 37.2 46.3 Median age for Hispanic or Latino residents51.2 17.9
Owner/renter occupied households by race in Broussard
House owners and renters - White residents 2,920 80.9% Owner occupied691 19.1% Renter occupiedHouse owners and renters - Black or African American residents 342 51.6% Owner occupied321 48.4% Renter occupiedHouse owners and renters - Asian residents 66 100.0% Owner occupiedHouse owners and renters - Two or more races residents 326 100.0% Owner occupiedHouse owners and renters - White alone residents 2,736 80.0% Owner occupied686 20.0% Renter occupiedHouse owners and renters - Hispanic or Latino residents 264 93.9% Owner occupied17 6.1% Renter occupied
Language usage in Broussard
English speakers - Total 94.8% of residents of Broussard speak English at home.
1.8% of residents speak Spanish at home 56 25.5% Speak English very well164 74.5% Speak English less than very well2.9% of residents speak other language at home 335 92.5% Speak English very well27 7.5% Speak English less than very well
English speakers - Born in the United States 95.1% of residents of Broussard speak English at home.
4.0% of residents speak Spanish at home 53 100.0% Speak English very well0.9% of residents speak other language at home 12 100.0% Speak English very well
All residents speak only English at home
English speakers - Foreign-born 13.3% of residents of Broussard speak English at home.
44.6% of residents speak Spanish at home 148 100.0% Speak English less than very well28.3% of residents speak other language at home 79 84.0% Speak English very well15 16.0% Speak English less than very well
White (Caucasian) - Speak only English Native:
96.0% (8,457)Foreign-born:
10.1% (23)
White (Caucasian) - Speak another language Native:
3.8% (338)Foreign-born:
79.0% (180)
Asian - Speak only English Native:
100.0% (62)Foreign-born:
20.5% (10)
White alone - Speak only English Native:
96.2% (8,467)Foreign-born:
36.1% (17)
White alone - Speak another language Native:
3.6% (317)Foreign-born:
100.0% (47)
Hispanic or Latino - Speak only English Native:
92.2% (234)Foreign-born:
8.3% (15)
Hispanic or Latino - Speak another language Native:
13.1% (33)Foreign-born:
97.6% (173)
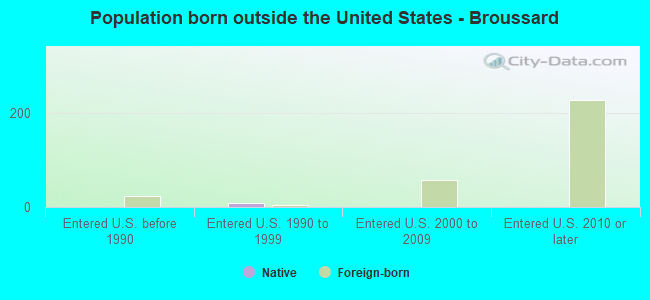
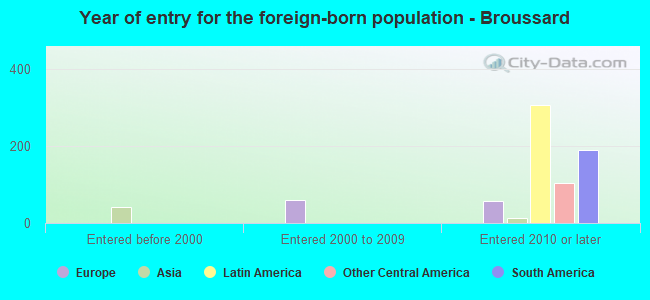
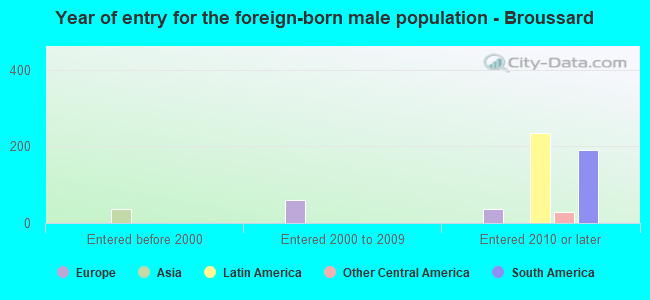
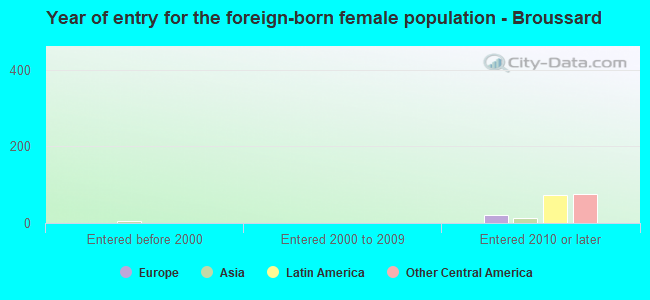
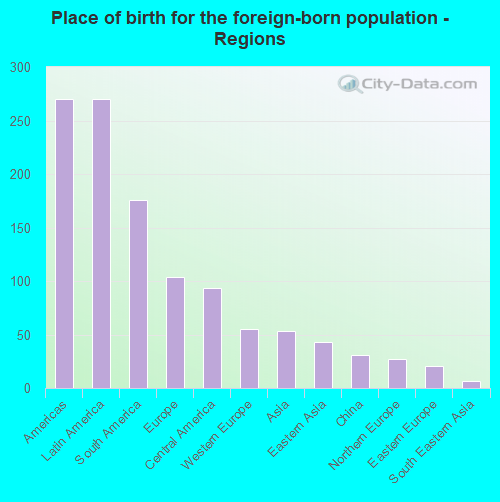
Foreign-born residents in Broussard 427 residents are foreign born (2.0% Latin America , 0.8% Europe , 0.4% Asia ).
This city:
3.1%Louisiana:
4.2%
Marital status for residents in Broussard Marital status - White (Caucasian) population 15 years and over
Males 27.5% Never married66.1% Now married0.3% Separated2.6% Widowed3.4% DivorcedFemales 23.6% Never married61.0% Now married2.3% Separated5.6% Widowed7.6% DivorcedWomen who gave birth in the past 12 months Now married:
82.3% (194)Unmarried:
17.7% (42)
Women who did not give birth in the past 12 months Now married:
58.0% (1,337)Unmarried:
42.0% (967)
Marital status - Black or African American population 15 years and over
Males 63.2% Never married32.2% Now married3.1% Separated0.7% Widowed0.7% DivorcedFemales 57.2% Never married32.6% Now married0.0% Separated0.7% Widowed9.5% DivorcedWomen who gave birth in the past 12 months Now married:
100.0% (16)Unmarried:
0.0% (0)
Women who did not give birth in the past 12 months Now married:
20.7% (146)Unmarried:
79.3% (561)
Marital status - Asian population 15 years and over
Males 0.0% Never married100.0% Now married0.0% Separated0.0% Widowed0.0% DivorcedFemales 24.0% Never married56.0% Now married0.0% Separated20.0% Widowed0.0% DivorcedWomen who did not give birth in the past 12 months Now married:
70.0% (16)Unmarried:
30.0% (7)
Marital status - Two or more races population 15 years and over
Males 66.7% Never married29.1% Now married0.0% Separated4.2% Widowed0.0% DivorcedFemales 30.8% Never married69.2% Now married0.0% Separated0.0% Widowed0.0% DivorcedWomen who gave birth in the past 12 months Now married:
100.0% (15)Unmarried:
0.0% (0)
Women who did not give birth in the past 12 months Now married:
58.5% (189)Unmarried:
41.5% (134)
Marital status - White alone, not Hispanic / Latino population 15 years and over
Males 28.7% Never married65.3% Now married0.4% Separated2.8% Widowed2.9% DivorcedFemales 23.2% Never married61.2% Now married2.3% Separated5.7% Widowed7.6% DivorcedWomen who gave birth in the past 12 months Now married:
82.3% (196)Unmarried:
17.7% (42)
Women who did not give birth in the past 12 months Now married:
58.4% (1,341)Unmarried:
41.6% (955)
Marital status - Hispanic or Latino population 15 years and over
Males 21.0% Never married69.7% Now married0.0% Separated0.0% Widowed9.2% DivorcedFemales 65.0% Never married35.0% Now married0.0% Separated0.0% Widowed0.0% DivorcedWomen who gave birth in the past 12 months Now married:
100.0% (11)Unmarried:
0.0% (0)
Women who did not give birth in the past 12 months Now married:
26.8% (22)Unmarried:
73.2% (61)
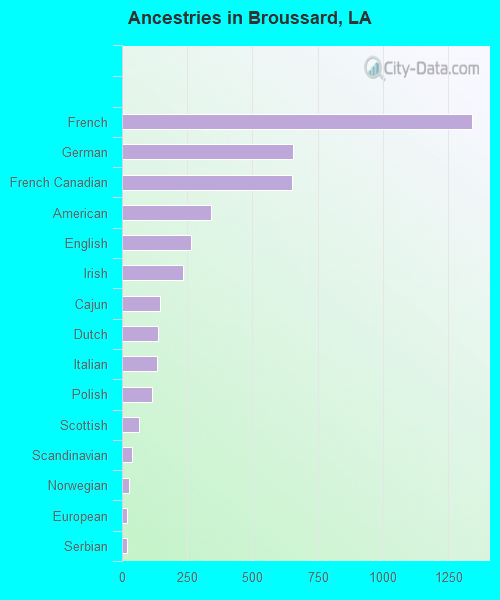
Ancestries in Broussard
1,340 17.7% French655 8.6% German650 8.6% French Canadian341 4.5% American263 3.5% English233 3.1% Irish145 1.9% Cajun138 1.8% Dutch133 1.8% Italian114 1.5% Polish65 0.9% Scottish38 0.5% Scandinavian27 0.4% Norwegian20 0.3% European20 0.3% Serbian11 0.1% Scotch-Irish1 0.01% Iranian
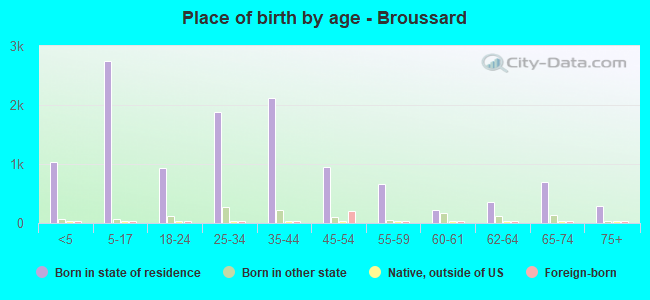
Children Nativity (place of birth) in Broussard
Children under 6 years - Living with two parents Both parents native 1,193 100.0% NativeOne native, one foreign-born parent 73 100.0% NativeChildren under 6 years - Living with one parent Native parent 136 100.0% Native
Children 6 to 17 years - Living with two parents Both parents native 1,187 99.5% Native7 0.5% Foreign-bornBoth parents foreign-born 18 100.0% Foreign-bornOne native, one foreign-born parent 4 100.0% NativeChildren 6 to 17 years - Living with one parent Native parent 1,103 100.0% Native
Grandparents responsible for own grandchildren in Broussard
Grandparents (30 to 59 years) White / Caucasian 59 100.0% Not responsible for grandchildrenBlack or African American 46 100.0% Not responsible for grandchildrenWhite alone, not Hispanic / Latino 59 100.0% Not responsible for grandchildren
Grandparents (60 years and over) White / Caucasian 3 100.0% Responsible for grandchildrenWhite alone, not Hispanic / Latino 3 100.0% Responsible for grandchildren