Races in Brownsburg, Indiana (IN) Detailed Stats
Data:
Races - White alone (%)
Races - White alone (% change since 2000)
Races - Black alone (%)
Races - Black alone (% change since 2000)
Races - American Indian alone (%)
Races - American Indian alone (% change since 2000)
Races - Asian alone (%)
Races - Asian alone (% change since 2000)
Races - Hispanic (%)
Races - Hispanic (% change since 2000)
Races - Native Hawaiian and Other Pacific Islander alone (%)
Races - Native Hawaiian and Other Pacific Islander alone (% change since 2000)
Races - Two or more races(%)
Races - Two or more races(% change since 2000)
Races - Other race alone (%)
Races - Other race alone (% change since 2000)
Racial diversity
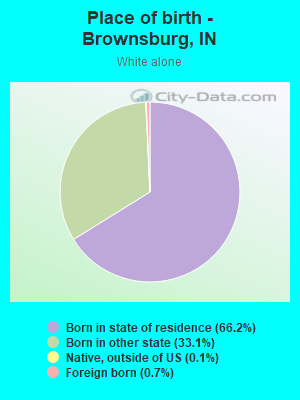
Place of birth - Born in state of residence (%)
Place of birth - Born in state of residence (%) - White
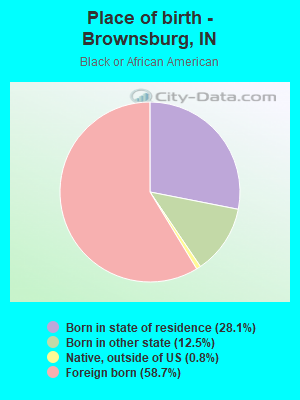
Place of birth - Born in state of residence (%) - Black or African American
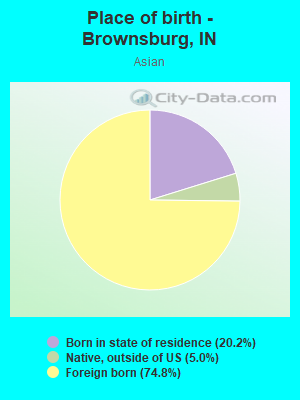
Place of birth - Born in state of residence (%) - Asian
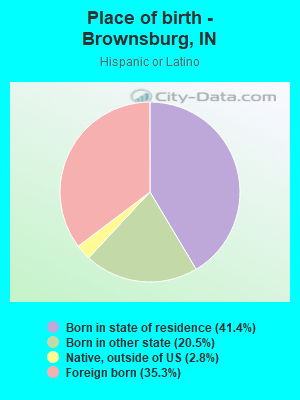
Place of birth - Born in state of residence (%) - Hispanic or Latino
Place of birth - Born in state of residence (%) - American Indian and Alaska Native
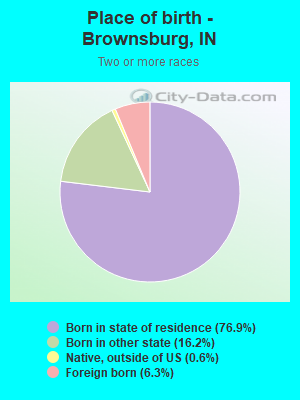
Place of birth - Born in state of residence (%) - Multirace
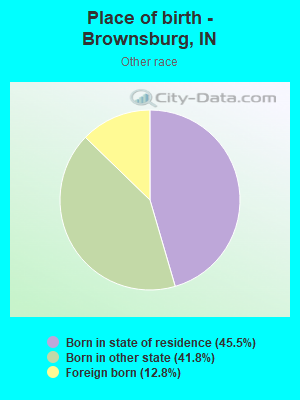
Place of birth - Born in state of residence (%) - Other Race
Place of birth - Born in other state (%)
Place of birth - Born in other state (%) - White
Place of birth - Born in other state (%) - Black or African American
Place of birth - Born in other state (%) - Asian
Place of birth - Born in other state (%) - Hispanic or Latino
Place of birth - Born in other state (%) - American Indian and Alaska Native
Place of birth - Born in other state (%) - Multirace
Place of birth - Born in other state (%) - Other Race
Place of birth - Native, outside of US (%)
Place of birth - Native, outside of US (%) - White
Place of birth - Native, outside of US (%) - Black or African American
Place of birth - Native, outside of US (%) - Asian
Place of birth - Native, outside of US (%) - Hispanic or Latino
Place of birth - Native, outside of US (%) - American Indian and Alaska Native
Place of birth - Native, outside of US (%) - Multirace
Place of birth - Native, outside of US (%) - Other Race
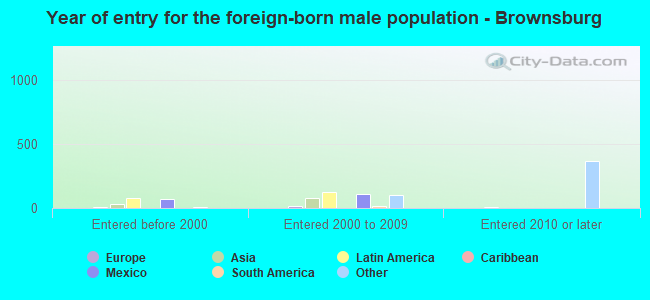
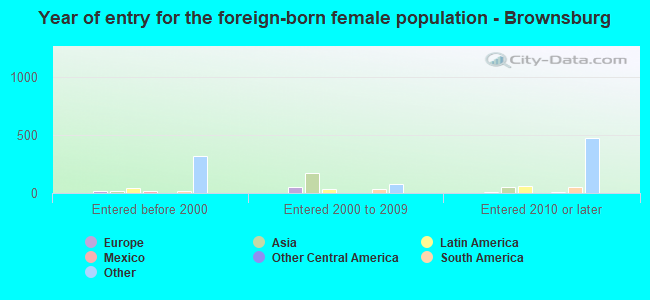
Place of birth - Foreign born (%)
Place of birth - Foreign born (%) - White
Place of birth - Foreign born (%) - Black or African American
Place of birth - Foreign born (%) - Asian
Place of birth - Foreign born (%) - Hispanic or Latino
Place of birth - Foreign born (%) - American Indian and Alaska Native
Place of birth - Foreign born (%) - Multirace
Place of birth - Foreign born (%) - Other Race
Residents speaking English at home (%)
Residents speaking English at home - Born in the United States (%)
Residents speaking English at home - Native, born elsewhere (%)
Residents speaking English at home - Foreign born (%)
Residents speaking Spanish at home (%)
Residents speaking Spanish at home - Born in the United States (%)
Residents speaking Spanish at home - Native, born elsewhere (%)
Residents speaking Spanish at home - Foreign born (%)
Residents speaking other language at home (%)
Residents speaking other language at home - Born in the United States (%)
Residents speaking other language at home - Native, born elsewhere (%)
Residents speaking other language at home - Foreign born (%)
Marital status - Never married (%)
Marital status - Now married (%)
Marital status - Separated (%)
Marital status - Widowed (%)
Marital status - Divorced (%)
Ancestries Reported - Arab (%)
Ancestries Reported - Czech (%)
Ancestries Reported - Danish (%)
Ancestries Reported - Dutch (%)
Ancestries Reported - English (%)
Ancestries Reported - French (%)
Ancestries Reported - French Canadian (%)
Ancestries Reported - German (%)
Ancestries Reported - Greek (%)
Ancestries Reported - Hungarian (%)
Ancestries Reported - Irish (%)
Ancestries Reported - Italian (%)
Ancestries Reported - Lithuanian (%)
Ancestries Reported - Norwegian (%)
Ancestries Reported - Polish (%)
Ancestries Reported - Portuguese (%)
Ancestries Reported - Russian (%)
Ancestries Reported - Scotch-Irish (%)
Ancestries Reported - Scottish (%)
Ancestries Reported - Slovak (%)
Ancestries Reported - Subsaharan African (%)
Ancestries Reported - Swedish (%)
Ancestries Reported - Swiss (%)
Ancestries Reported - Ukrainian (%)
Ancestries Reported - United States (%)
Ancestries Reported - Welsh (%)
Ancestries Reported - West Indian (%)
Ancestries Reported - Other (%)
Geographical mobility - Same house 1 year ago (%)
Geographical mobility - Same house 1 year ago (%) - White
Geographical mobility - Same house 1 year ago (%) - Black or African American
Geographical mobility - Same house 1 year ago (%) - Asian
Geographical mobility - Same house 1 year ago (%) - Hispanic or Latino
Geographical mobility - Same house 1 year ago (%) - American Indian and Alaska Native
Geographical mobility - Same house 1 year ago (%) - Multirace
Geographical mobility - Same house 1 year ago (%) - Other Race
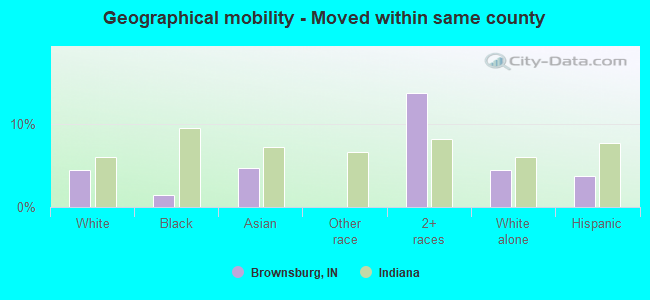
Geographical mobility - Moved within same county (%)
Geographical mobility - Moved within same county (%) - White
Geographical mobility - Moved within same county (%) - Black or African American
Geographical mobility - Moved within same county (%) - Asian
Geographical mobility - Moved within same county (%) - Hispanic or Latino
Geographical mobility - Moved within same county (%) - American Indian and Alaska Native
Geographical mobility - Moved within same county (%) - Multirace
Geographical mobility - Moved within same county (%) - Other Race
Geographical mobility - Moved from different county within same state (%)
Geographical mobility - Moved from different county within same state (%) - White
Geographical mobility - Moved from different county within same state (%) - Black or African American
Geographical mobility - Moved from different county within same state (%) - Asian
Geographical mobility - Moved from different county within same state (%) - Hispanic or Latino
Geographical mobility - Moved from different county within same state (%) - American Indian and Alaska Native
Geographical mobility - Moved from different county within same state (%) - Multirace
Geographical mobility - Moved from different county within same state (%) - Other Race
Geographical mobility - Moved from different state (%)
Geographical mobility - Moved from different state (%) - White
Geographical mobility - Moved from different state (%) - Black or African American
Geographical mobility - Moved from different state (%) - Asian
Geographical mobility - Moved from different state (%) - Hispanic or Latino
Geographical mobility - Moved from different state (%) - American Indian and Alaska Native
Geographical mobility - Moved from different state (%) - Multirace
Geographical mobility - Moved from different state (%) - Other Race
Geographical mobility - Moved from abroad (%)
Geographical mobility - Moved from abroad (%) - White
Geographical mobility - Moved from abroad (%) - Black or African American
Geographical mobility - Moved from abroad (%) - Asian
Geographical mobility - Moved from abroad (%) - Hispanic or Latino
Geographical mobility - Moved from abroad (%) - American Indian and Alaska Native
Geographical mobility - Moved from abroad (%) - Multirace
Geographical mobility - Moved from abroad (%) - Other Race
Place of birth for the foreign-born population - Ireland (%)
Place of birth for the foreign-born population - Denmark (%)
Place of birth for the foreign-born population - Norway (%)
Place of birth for the foreign-born population - Sweden (%)
Place of birth for the foreign-born population - United Kingdom (%)
Place of birth for the foreign-born population - England (%)
Place of birth for the foreign-born population - Scotland (%)
Place of birth for the foreign-born population - Other Northern Europe (%)
Place of birth for the foreign-born population - Austria (%)
Place of birth for the foreign-born population - Belgium (%)
Place of birth for the foreign-born population - France (%)
Place of birth for the foreign-born population - Germany (%)
Place of birth for the foreign-born population - Netherlands (%)
Place of birth for the foreign-born population - Switzerland (%)
Place of birth for the foreign-born population - Other Western Europe (%)
Place of birth for the foreign-born population - Greece (%)
Place of birth for the foreign-born population - Italy (%)
Place of birth for the foreign-born population - Portugal (%)
Place of birth for the foreign-born population - Spain (%)
Place of birth for the foreign-born population - Other Southern Europe (%)
Place of birth for the foreign-born population - Albania (%)
Place of birth for the foreign-born population - Belarus (%)
Place of birth for the foreign-born population - Bosnia and Herzegovina (%)
Place of birth for the foreign-born population - Bulgaria (%)
Place of birth for the foreign-born population - Croatia (%)
Place of birth for the foreign-born population - Czechoslovakia (%)
Place of birth for the foreign-born population - Hungary (%)
Place of birth for the foreign-born population - Latvia (%)
Place of birth for the foreign-born population - Lithuania (%)
Place of birth for the foreign-born population - North Macedonia (Macedonia) (%)
Place of birth for the foreign-born population - Moldova (%)
Place of birth for the foreign-born population - Poland (%)
Place of birth for the foreign-born population - Romania (%)
Place of birth for the foreign-born population - Russia (%)
Place of birth for the foreign-born population - Serbia (%)
Place of birth for the foreign-born population - Ukraine (%)
Place of birth for the foreign-born population - Other Eastern Europe (%)
Place of birth for the foreign-born population - China (%)
Place of birth for the foreign-born population - Hong Kong (%)
Place of birth for the foreign-born population - Taiwan (%)
Place of birth for the foreign-born population - Japan (%)
Place of birth for the foreign-born population - Korea (%)
Place of birth for the foreign-born population - Other Eastern Asia (%)
Place of birth for the foreign-born population - Afghanistan (%)
Place of birth for the foreign-born population - Bangladesh (%)
Place of birth for the foreign-born population - India (%)
Place of birth for the foreign-born population - Iran (%)
Place of birth for the foreign-born population - Kazakhstan (%)
Place of birth for the foreign-born population - Nepal (%)
Place of birth for the foreign-born population - Pakistan (%)
Place of birth for the foreign-born population - Sri Lanka (%)
Place of birth for the foreign-born population - Uzbekistan (%)
Place of birth for the foreign-born population - Other South Central Asia (%)
Place of birth for the foreign-born population - Burma (%)
Place of birth for the foreign-born population - Cambodia (%)
Place of birth for the foreign-born population - Indonesia (%)
Place of birth for the foreign-born population - Laos (%)
Place of birth for the foreign-born population - Malaysia (%)
Place of birth for the foreign-born population - Philippines (%)
Place of birth for the foreign-born population - Singapore (%)
Place of birth for the foreign-born population - Thailand (%)
Place of birth for the foreign-born population - Vietnam (%)
Place of birth for the foreign-born population - Other South Eastern Asia (%)
Place of birth for the foreign-born population - Armenia (%)
Place of birth for the foreign-born population - Iraq (%)
Place of birth for the foreign-born population - Israel (%)
Place of birth for the foreign-born population - Jordan (%)
Place of birth for the foreign-born population - Kuwait (%)
Place of birth for the foreign-born population - Lebanon (%)
Place of birth for the foreign-born population - Saudi Arabia (%)
Place of birth for the foreign-born population - Syria (%)
Place of birth for the foreign-born population - Turkey (%)
Place of birth for the foreign-born population - Yemen (%)
Place of birth for the foreign-born population - Other Western Asia (%)
Place of birth for the foreign-born population - Eritrea (%)
Place of birth for the foreign-born population - Ethiopia (%)
Place of birth for the foreign-born population - Kenya (%)
Place of birth for the foreign-born population - Somalia (%)
Place of birth for the foreign-born population - Uganda (%)
Place of birth for the foreign-born population - Zimbabwe (%)
Place of birth for the foreign-born population - Other Eastern Africa (%)
Place of birth for the foreign-born population - Cameroon (%)
Place of birth for the foreign-born population - Congo (%)
Place of birth for the foreign-born population - Democratic Republic of Congo (Zaire) (%)
Place of birth for the foreign-born population - Other Middle Africa (%)
Place of birth for the foreign-born population - Egypt (%)
Place of birth for the foreign-born population - Morocco (%)
Place of birth for the foreign-born population - Sudan (%)
Place of birth for the foreign-born population - Other Northern Africa (%)
Place of birth for the foreign-born population - South Africa (%)
Place of birth for the foreign-born population - Other Southern Africa (%)
Place of birth for the foreign-born population - Cabo Verde (%)
Place of birth for the foreign-born population - Ghana (%)
Place of birth for the foreign-born population - Liberia (%)
Place of birth for the foreign-born population - Nigeria (%)
Place of birth for the foreign-born population - Senegal (%)
Place of birth for the foreign-born population - Sierra Leone (%)
Place of birth for the foreign-born population - Other Western Africa (%)
Place of birth for the foreign-born population - Australia (%)
Place of birth for the foreign-born population - New Zealand (%)
Place of birth for the foreign-born population - Fiji (%)
Place of birth for the foreign-born population - Micronesia (%)
Place of birth for the foreign-born population - Bahamas (%)
Place of birth for the foreign-born population - Barbados (%)
Place of birth for the foreign-born population - Cuba (%)
Place of birth for the foreign-born population - Dominica (%)
Place of birth for the foreign-born population - Dominican Republic (%)
Place of birth for the foreign-born population - Grenada (%)
Place of birth for the foreign-born population - Haiti (%)
Place of birth for the foreign-born population - Jamaica (%)
Place of birth for the foreign-born population - St. Vincent and the Grenadines (%)
Place of birth for the foreign-born population - Trinidad and Tobago (%)
Place of birth for the foreign-born population - West Indies (%)
Place of birth for the foreign-born population - Other Caribbean (%)
Place of birth for the foreign-born population - Belize (%)
Place of birth for the foreign-born population - Costa Rica (%)
Place of birth for the foreign-born population - El Salvador (%)
Place of birth for the foreign-born population - Guatemala (%)
Place of birth for the foreign-born population - Honduras (%)
Place of birth for the foreign-born population - Mexico (%)
Place of birth for the foreign-born population - Nicaragua (%)
Place of birth for the foreign-born population - Panama (%)
Place of birth for the foreign-born population - Other Central America (%)
Place of birth for the foreign-born population - Argentina (%)
Place of birth for the foreign-born population - Bolivia (%)
Place of birth for the foreign-born population - Brazil (%)
Place of birth for the foreign-born population - Chile (%)
Place of birth for the foreign-born population - Colombia (%)
Place of birth for the foreign-born population - Ecuador (%)
Place of birth for the foreign-born population - Guyana (%)
Place of birth for the foreign-born population - Peru (%)
Place of birth for the foreign-born population - Uruguay (%)
Place of birth for the foreign-born population - Venezuela (%)
Place of birth for the foreign-born population - Other South America (%)
Place of birth for the foreign-born population - Canada (%)
Place of birth for the foreign-born population - Other Northern America (%)
Place of birth for the foreign-born population - Other (%)
Latest news about races in Brownsburg, IN collected exclusively by city-data.com from local newspapers, TV, and radio stations
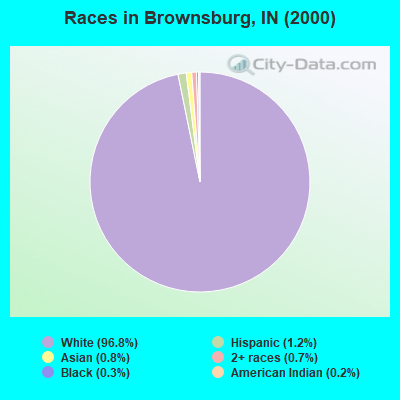
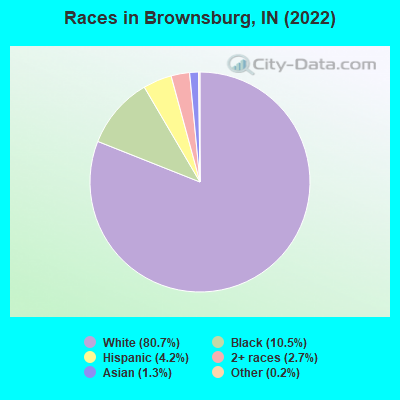
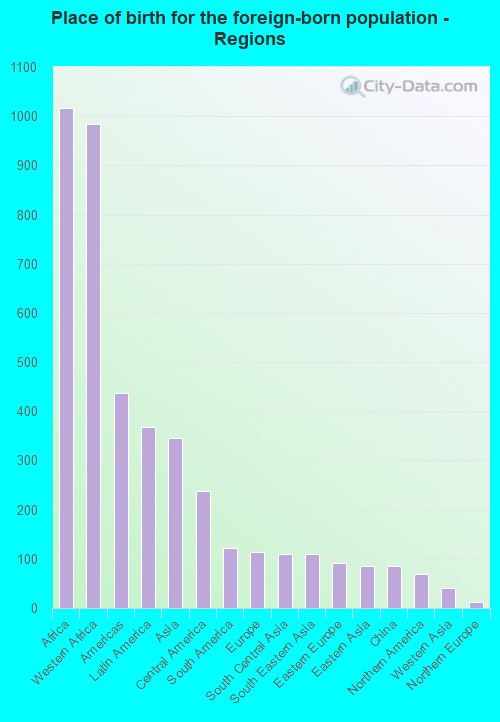
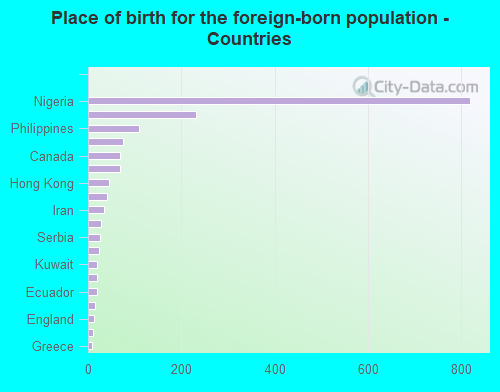
According to 2022 data, the most numerous races in Brownsburg, IN are White alone (24,643 residents), Black alone (3,203 residents), and Hispanic (1,268 residents). 88.4% of Brownsburg residents speak English at home. 6.3% of Brownsburg, IN residents are foreign-born (3.2% born in Africa, 1.1% born in Latin America, 1.1% born in Asia), which is 4.3% greater than the foreign-born rate of 6.0% across the entire state of Indiana.
Race distribution in Brownsburg
2000 2022
5,219,373 85.8% White alone 505,462 8.3% Black alone 214,536 3.5% Hispanic 61,115 1.0% Two or more races 58,424 1.0% Asian alone 13,654 0.2% American Indian alone 6,348 0.1% Other race alone 1,573 0.03% Native Hawaiian and Other
5,192,455 76.0% White alone 628,054 9.2% Black alone 534,528 7.8% Hispanic 263,242 3.9% Two or more races 172,880 2.5% Asian alone 33,467 0.5% Other race alone 5,866 0.09% American Indian alone 2,545 0.04% Native Hawaiian and Other
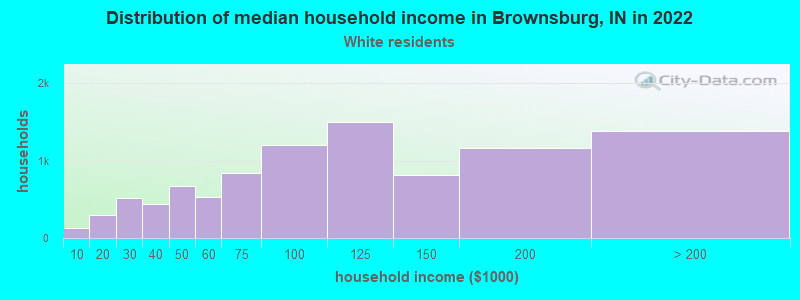
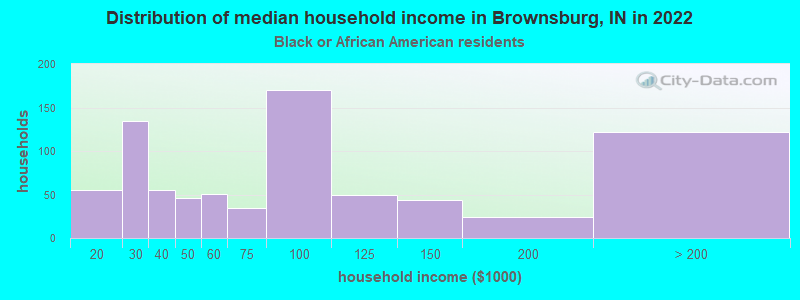
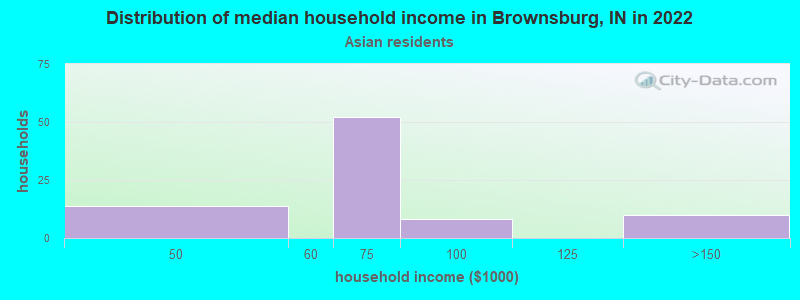
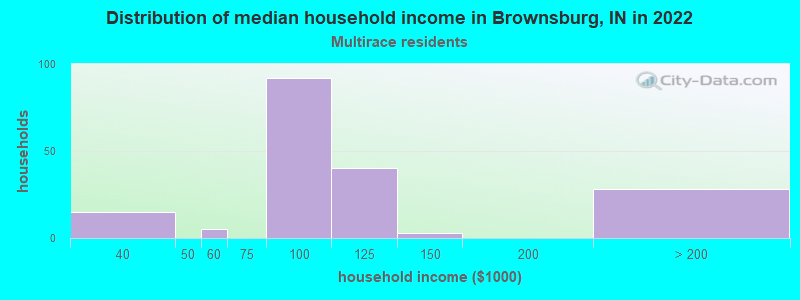
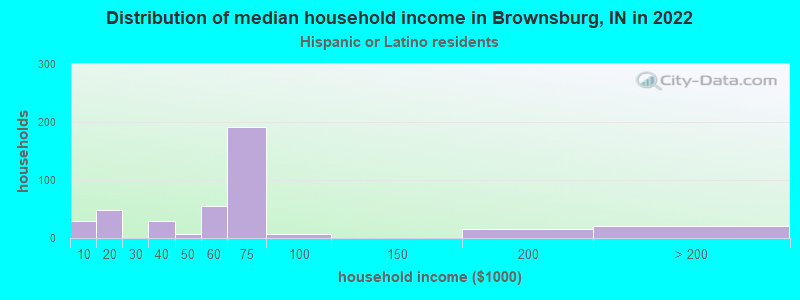
Income and house value in Brownsburg Median household income in 2022 $103,915 White non-Hispanic householders$69,927 Black householders$91,172 Asian householders$93,511 Two or more races householders$61,009 Hispanic or Latino race householdersMedian 2022 house value $284,082 White Non-Hispanic householders $293,933 Asian householders$241,241 Two or more races householders$458,197 Hispanic or Latino householders
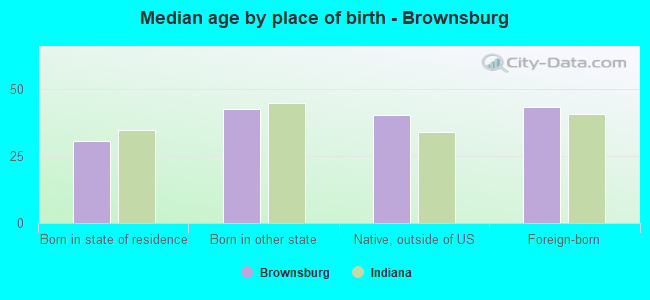
Median age by race in Brownsburg
38.1 Median age for White residents36.0 40.6 36.8 Median age for Black or African American residents26.1 46.2 -558,797,523.8 Median age for American Indian / Alaska Native residents-654,255,318.5 -491,600,353.2 39.3 Median age for Asian residents40.2 32.1 -666,666,666.0 Median age for Native Hawaiian / Pacific Islander residents-666,666,666.0 -666,666,666.0 15.6 Median age for Other race residents12.2 13.9 15.6 Median age for Two or more races residents15.4 13.5 38.3 Median age for White alone residents36.1 40.4 29.2 Median age for Hispanic or Latino residents29.0 41.4
Owner/renter occupied households by race in Brownsburg
House owners and renters - White residents 6,969 72.3% Owner occupied2,671 27.7% Renter occupiedHouse owners and renters - Black or African American residents 558 64.0% Owner occupied313 36.0% Renter occupiedHouse owners and renters - Asian residents 66 66.7% Owner occupied33 33.3% Renter occupiedHouse owners and renters - Other race residents 22 100.0% Owner occupiedHouse owners and renters - Two or more races residents 140 73.3% Owner occupied51 26.7% Renter occupiedHouse owners and renters - White alone residents 6,990 73.8% Owner occupied2,481 26.2% Renter occupiedHouse owners and renters - Hispanic or Latino residents 70 24.0% Owner occupied223 76.0% Renter occupied
Language usage in Brownsburg
English speakers - Total 88.4% of residents of Brownsburg speak English at home.
3.3% of residents speak Spanish at home 654 67.6% Speak English very well313 32.4% Speak English less than very well7.4% of residents speak other language at home 1,496 70.0% Speak English very well642 30.0% Speak English less than very well
English speakers - Born in the United States 93.9% of residents of Brownsburg speak English at home.
3.4% of residents speak Spanish at home 302 100.0% Speak English very well1.7% of residents speak other language at home 139 91.4% Speak English very well13 8.6% Speak English less than very well
English speakers - Native, born elsewhere 45.7% of residents of Brownsburg speak English at home.
21.7% of residents speak Spanish at home 20 100.0% Speak English less than very well26.1% of residents speak other language at home 24 100.0% Speak English very well
English speakers - Foreign-born 15.6% of residents of Brownsburg speak English at home.
13.2% of residents speak Spanish at home 145 42.2% Speak English very well199 57.8% Speak English less than very well61.4% of residents speak other language at home 1,055 66.1% Speak English very well542 33.9% Speak English less than very well
White (Caucasian) - Speak only English Native:
98.1% (22,721)Foreign-born:
9.1% (32)
White (Caucasian) - Speak another language Native:
1.9% (436)Foreign-born:
78.2% (274)
Black or African American - Speak only English Native:
82.4% (1,200)Foreign-born:
20.4% (444)
Black or African American - Speak another language Native:
30.0% (437)Foreign-born:
76.0% (1,654)
Asian - Speak only English Native:
29.1% (33)Foreign-born:
7.9% (24)
Asian - Speak another language Native:
62.2% (70)Foreign-born:
91.4% (271)
Other race - Speak only English Native:
54.2% (87)Foreign-born:
28.9% (7)
Other race - Speak another language Native:
46.0% (74)Foreign-born:
74.4% (19)
Two or more races - Speak another language Native:
8.3% (123)Foreign-born:
100.0% (104)
White alone - Speak only English Native:
98.1% (22,703)Foreign-born:
24.1% (39)
White alone - Speak another language Native:
2.0% (469)Foreign-born:
82.2% (132)
Hispanic or Latino - Speak only English Native:
54.8% (401)Foreign-born:
1.5% (7)
Hispanic or Latino - Speak another language Native:
38.7% (283)Foreign-born:
98.5% (449)
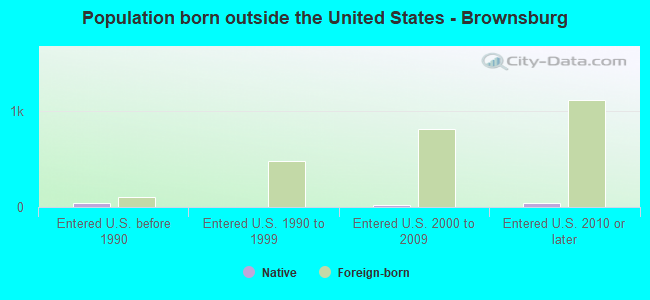
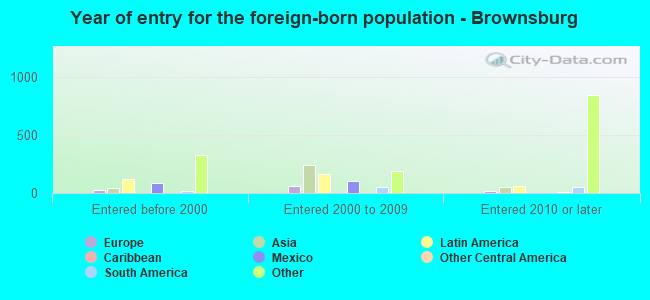
Foreign-born residents in Brownsburg 1,915 residents are foreign born (3.2% Africa , 1.1% Latin America , 1.1% Asia ).
This city:
6.3%Indiana:
5.6%
Marital status for residents in Brownsburg Marital status - White (Caucasian) population 15 years and over
Males 28.3% Never married60.4% Now married2.2% Separated3.5% Widowed5.5% DivorcedFemales 20.7% Never married59.9% Now married0.1% Separated7.2% Widowed12.1% DivorcedWomen who gave birth in the past 12 months Now married:
73.3% (180)Unmarried:
26.7% (66)
Women who did not give birth in the past 12 months Now married:
56.5% (3,148)Unmarried:
43.5% (2,423)
Marital status - Black or African American population 15 years and over
Males 33.4% Never married60.3% Now married3.6% Separated0.0% Widowed2.6% DivorcedFemales 25.7% Never married54.6% Now married2.6% Separated2.0% Widowed15.1% DivorcedWomen who did not give birth in the past 12 months Now married:
48.6% (277)Unmarried:
51.4% (293)
Marital status - Asian population 15 years and over
Males 36.4% Never married63.6% Now married0.0% Separated0.0% Widowed0.0% DivorcedFemales 33.7% Never married56.3% Now married0.0% Separated10.1% Widowed0.0% DivorcedWomen who did not give birth in the past 12 months Now married:
52.5% (66)Unmarried:
47.5% (59)
Marital status - Other race population 15 years and over
Males 35.7% Never married64.3% Now married0.0% Separated0.0% Widowed0.0% DivorcedFemales 27.1% Never married72.9% Now married0.0% Separated0.0% Widowed0.0% DivorcedWomen who did not give birth in the past 12 months Now married:
72.9% (62)Unmarried:
27.1% (23)
Marital status - Two or more races population 15 years and over
Males 34.1% Never married60.1% Now married0.0% Separated1.2% Widowed4.7% DivorcedFemales 46.5% Never married46.5% Now married0.0% Separated1.3% Widowed5.7% DivorcedWomen who gave birth in the past 12 months Now married:
100.0% (3)Unmarried:
0.0% (0)
Women who did not give birth in the past 12 months Now married:
44.8% (118)Unmarried:
55.2% (145)
Marital status - White alone, not Hispanic / Latino population 15 years and over
Males 28.6% Never married61.9% Now married0.1% Separated3.6% Widowed5.8% DivorcedFemales 20.6% Never married59.9% Now married0.1% Separated7.3% Widowed12.2% DivorcedWomen who gave birth in the past 12 months Now married:
73.3% (184)Unmarried:
26.7% (67)
Women who did not give birth in the past 12 months Now married:
56.5% (3,186)Unmarried:
43.5% (2,456)
Marital status - Hispanic or Latino population 15 years and over
Males 19.5% Never married39.0% Now married41.6% Separated0.0% Widowed0.0% DivorcedFemales 32.0% Never married68.0% Now married0.0% Separated0.0% Widowed0.0% DivorcedWomen who did not give birth in the past 12 months Now married:
66.2% (191)Unmarried:
33.8% (98)
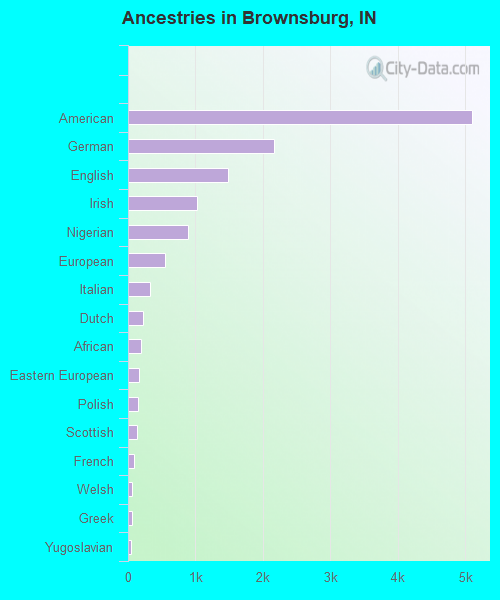
Ancestries in Brownsburg
5,100 35.4% American2,173 15.1% German1,485 10.3% English1,023 7.1% Irish897 6.2% Nigerian542 3.8% European321 2.2% Italian218 1.5% Dutch186 1.3% African162 1.1% Eastern European154 1.1% Polish128 0.9% Scottish84 0.6% French64 0.4% Welsh56 0.4% Greek49 0.3% Yugoslavian42 0.3% Turkish41 0.3% Serbian36 0.2% Belgian34 0.2% British32 0.2% Iranian32 0.2% Norwegian29 0.2% Swiss28 0.2% Ukrainian21 0.1% Danish19 0.1% Russian17 0.1% Scotch-Irish15 0.1% Swedish9 0.06% Slovak8 0.06% Romanian7 0.05% Armenian7 0.05% Slovene4 0.03% Czech
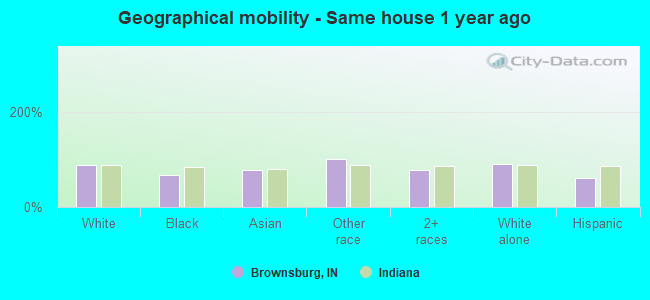
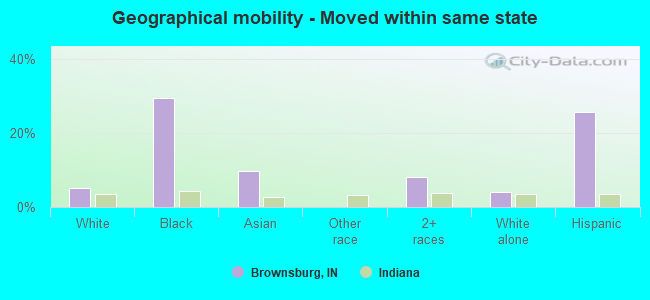
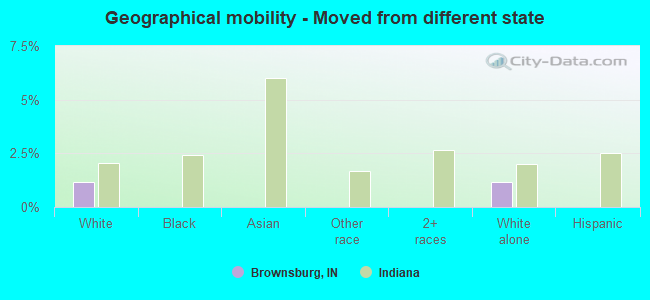
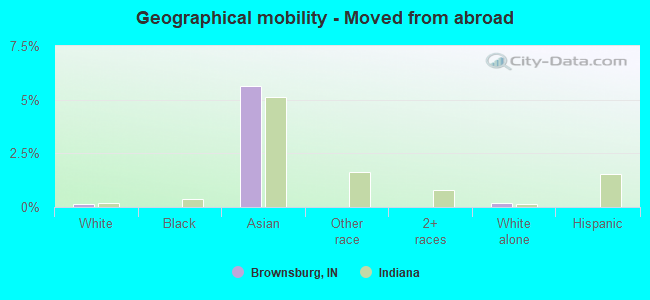
Geographical mobility in Brownsburg Same house 1 year ago 21,856 89.1% White (Caucasian)2,252 68.3% Black or African American276 78.1% Asian210 100.0% Other race1,128 77.3% Two or more races22,002 90.0% White alone, not Hispanic / Latino752 59.6% Hispanic or LatinoMoved within same county 1,086 4.4% White / Caucasian49 1.5% Black or African American17 4.7% Asian202 13.8% Two or more races1,095 4.5% White alone, not Hispanic / Latino47 3.8% Hispanic or LatinoMoved within same state 1,227 5.0% White / Caucasian971 29.5% Black or African American35 9.9% Asian117 8.0% Two or more races986 4.0% White alone, not Hispanic / Latino325 25.8% Hispanic or LatinoMoved from different state 281 1.1% White / Caucasian286 1.2% White alone, not Hispanic / LatinoMoved from abroad 33 0.1% White20 5.6% Asian44 0.2% White alone, not Hispanic / Latino
Children Nativity (place of birth) in Brownsburg
Children under 6 years - Living with two parents Both parents native 1,579 100.0% NativeBoth parents foreign-born 62 100.0% NativeOne native, one foreign-born parent 76 100.0% NativeChildren under 6 years - Living with one parent Native parent 310 100.0% NativeChildren 6 to 17 years - Living with two parents Both parents native 4,398 100.0% NativeBoth parents foreign-born 160 23.1% Native531 76.9% Foreign-bornOne native, one foreign-born parent 216 100.0% NativeChildren 6 to 17 years - Living with one parent Native parent 691 100.0% NativeForeign-born parent 408 56.1% Native319 43.9% Foreign-born
Grandparents responsible for own grandchildren in Brownsburg
Grandparents (30 to 59 years) White / Caucasian 51 100.0% Not responsible for grandchildrenWhite alone, not Hispanic / Latino 54 100.0% Not responsible for grandchildren
Grandparents (60 years and over) White / Caucasian 39 100.0% Not responsible for grandchildrenWhite alone, not Hispanic / Latino 40 100.0% Not responsible for grandchildren