Races in Brunswick, Georgia (GA) Detailed Stats
Data:
Races - White alone (%)
Races - White alone (% change since 2000)
Races - Black alone (%)
Races - Black alone (% change since 2000)
Races - American Indian alone (%)
Races - American Indian alone (% change since 2000)
Races - Asian alone (%)
Races - Asian alone (% change since 2000)
Races - Hispanic (%)
Races - Hispanic (% change since 2000)
Races - Native Hawaiian and Other Pacific Islander alone (%)
Races - Native Hawaiian and Other Pacific Islander alone (% change since 2000)
Races - Two or more races(%)
Races - Two or more races(% change since 2000)
Races - Other race alone (%)
Races - Other race alone (% change since 2000)
Racial diversity
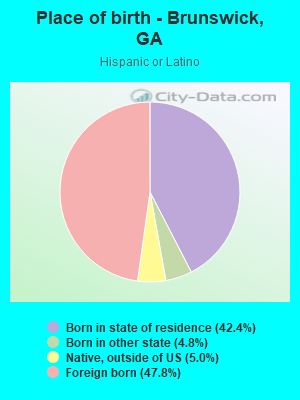
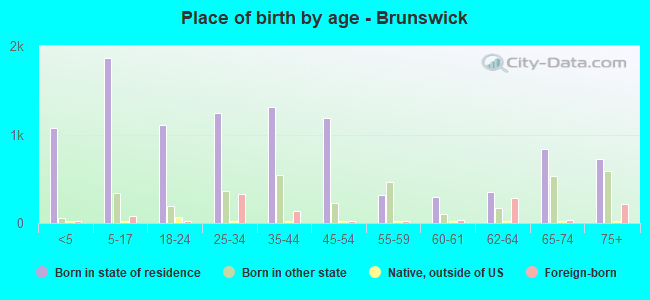
Place of birth - Born in state of residence (%)
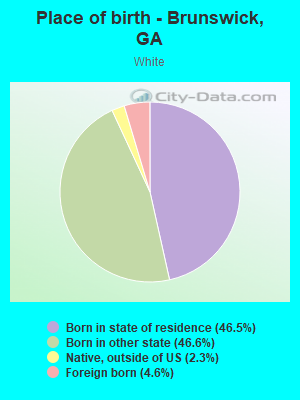
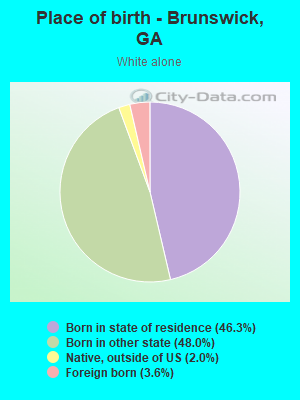
Place of birth - Born in state of residence (%) - White
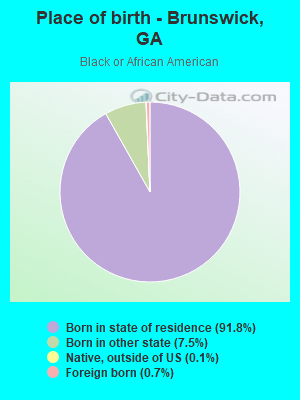
Place of birth - Born in state of residence (%) - Black or African American
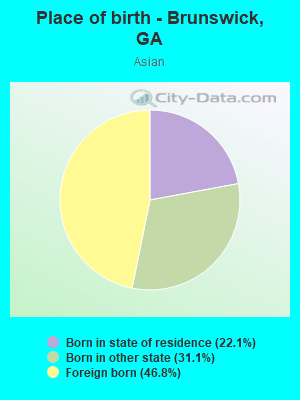
Place of birth - Born in state of residence (%) - Asian
Place of birth - Born in state of residence (%) - Hispanic or Latino
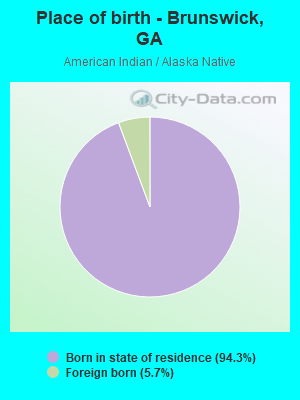
Place of birth - Born in state of residence (%) - American Indian and Alaska Native
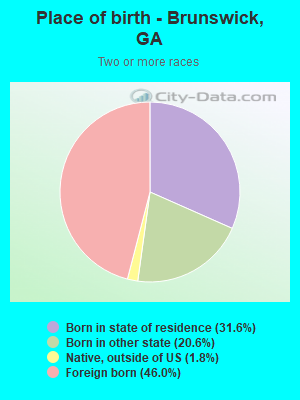
Place of birth - Born in state of residence (%) - Multirace
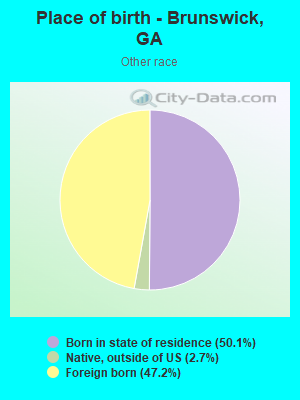
Place of birth - Born in state of residence (%) - Other Race
Place of birth - Born in other state (%)
Place of birth - Born in other state (%) - White
Place of birth - Born in other state (%) - Black or African American
Place of birth - Born in other state (%) - Asian
Place of birth - Born in other state (%) - Hispanic or Latino
Place of birth - Born in other state (%) - American Indian and Alaska Native
Place of birth - Born in other state (%) - Multirace
Place of birth - Born in other state (%) - Other Race
Place of birth - Native, outside of US (%)
Place of birth - Native, outside of US (%) - White
Place of birth - Native, outside of US (%) - Black or African American
Place of birth - Native, outside of US (%) - Asian
Place of birth - Native, outside of US (%) - Hispanic or Latino
Place of birth - Native, outside of US (%) - American Indian and Alaska Native
Place of birth - Native, outside of US (%) - Multirace
Place of birth - Native, outside of US (%) - Other Race
Place of birth - Foreign born (%)
Place of birth - Foreign born (%) - White
Place of birth - Foreign born (%) - Black or African American
Place of birth - Foreign born (%) - Asian
Place of birth - Foreign born (%) - Hispanic or Latino
Place of birth - Foreign born (%) - American Indian and Alaska Native
Place of birth - Foreign born (%) - Multirace
Place of birth - Foreign born (%) - Other Race
Residents speaking English at home (%)
Residents speaking English at home - Born in the United States (%)
Residents speaking English at home - Native, born elsewhere (%)
Residents speaking English at home - Foreign born (%)
Residents speaking Spanish at home (%)
Residents speaking Spanish at home - Born in the United States (%)
Residents speaking Spanish at home - Native, born elsewhere (%)
Residents speaking Spanish at home - Foreign born (%)
Residents speaking other language at home (%)
Residents speaking other language at home - Born in the United States (%)
Residents speaking other language at home - Native, born elsewhere (%)
Residents speaking other language at home - Foreign born (%)
Marital status - Never married (%)
Marital status - Now married (%)
Marital status - Separated (%)
Marital status - Widowed (%)
Marital status - Divorced (%)
Ancestries Reported - Arab (%)
Ancestries Reported - Czech (%)
Ancestries Reported - Danish (%)
Ancestries Reported - Dutch (%)
Ancestries Reported - English (%)
Ancestries Reported - French (%)
Ancestries Reported - French Canadian (%)
Ancestries Reported - German (%)
Ancestries Reported - Greek (%)
Ancestries Reported - Hungarian (%)
Ancestries Reported - Irish (%)
Ancestries Reported - Italian (%)
Ancestries Reported - Lithuanian (%)
Ancestries Reported - Norwegian (%)
Ancestries Reported - Polish (%)
Ancestries Reported - Portuguese (%)
Ancestries Reported - Russian (%)
Ancestries Reported - Scotch-Irish (%)
Ancestries Reported - Scottish (%)
Ancestries Reported - Slovak (%)
Ancestries Reported - Subsaharan African (%)
Ancestries Reported - Swedish (%)
Ancestries Reported - Swiss (%)
Ancestries Reported - Ukrainian (%)
Ancestries Reported - United States (%)
Ancestries Reported - Welsh (%)
Ancestries Reported - West Indian (%)
Ancestries Reported - Other (%)
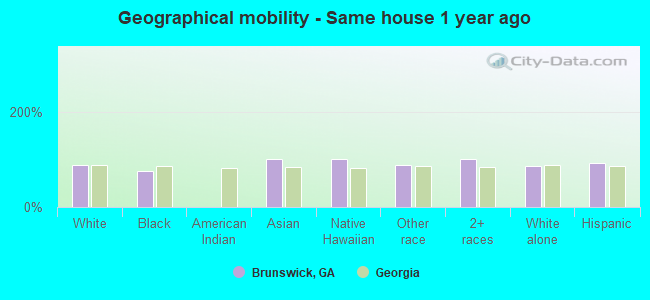
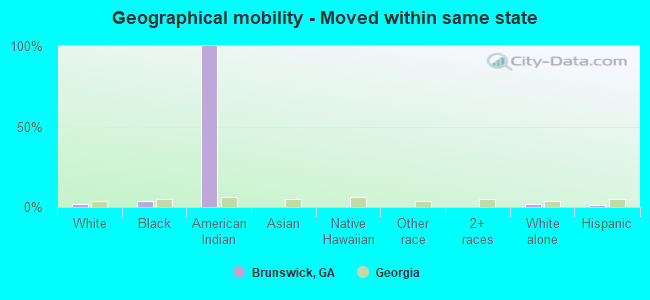
Geographical mobility - Same house 1 year ago (%)
Geographical mobility - Same house 1 year ago (%) - White
Geographical mobility - Same house 1 year ago (%) - Black or African American
Geographical mobility - Same house 1 year ago (%) - Asian
Geographical mobility - Same house 1 year ago (%) - Hispanic or Latino
Geographical mobility - Same house 1 year ago (%) - American Indian and Alaska Native
Geographical mobility - Same house 1 year ago (%) - Multirace
Geographical mobility - Same house 1 year ago (%) - Other Race
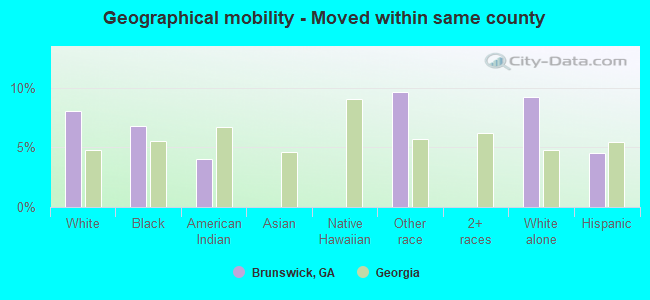
Geographical mobility - Moved within same county (%)
Geographical mobility - Moved within same county (%) - White
Geographical mobility - Moved within same county (%) - Black or African American
Geographical mobility - Moved within same county (%) - Asian
Geographical mobility - Moved within same county (%) - Hispanic or Latino
Geographical mobility - Moved within same county (%) - American Indian and Alaska Native
Geographical mobility - Moved within same county (%) - Multirace
Geographical mobility - Moved within same county (%) - Other Race
Geographical mobility - Moved from different county within same state (%)
Geographical mobility - Moved from different county within same state (%) - White
Geographical mobility - Moved from different county within same state (%) - Black or African American
Geographical mobility - Moved from different county within same state (%) - Asian
Geographical mobility - Moved from different county within same state (%) - Hispanic or Latino
Geographical mobility - Moved from different county within same state (%) - American Indian and Alaska Native
Geographical mobility - Moved from different county within same state (%) - Multirace
Geographical mobility - Moved from different county within same state (%) - Other Race
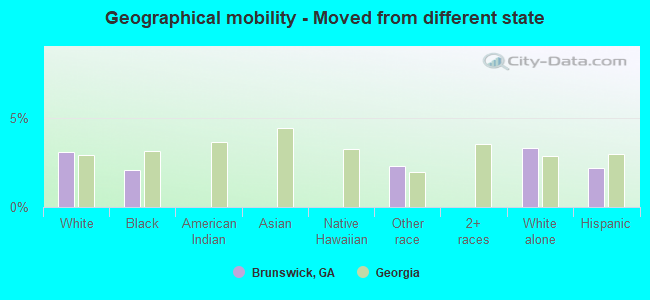
Geographical mobility - Moved from different state (%)
Geographical mobility - Moved from different state (%) - White
Geographical mobility - Moved from different state (%) - Black or African American
Geographical mobility - Moved from different state (%) - Asian
Geographical mobility - Moved from different state (%) - Hispanic or Latino
Geographical mobility - Moved from different state (%) - American Indian and Alaska Native
Geographical mobility - Moved from different state (%) - Multirace
Geographical mobility - Moved from different state (%) - Other Race
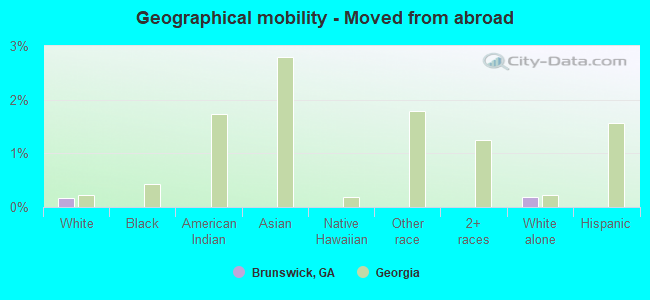
Geographical mobility - Moved from abroad (%)
Geographical mobility - Moved from abroad (%) - White
Geographical mobility - Moved from abroad (%) - Black or African American
Geographical mobility - Moved from abroad (%) - Asian
Geographical mobility - Moved from abroad (%) - Hispanic or Latino
Geographical mobility - Moved from abroad (%) - American Indian and Alaska Native
Geographical mobility - Moved from abroad (%) - Multirace
Geographical mobility - Moved from abroad (%) - Other Race
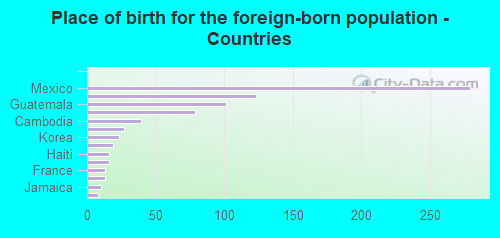
Place of birth for the foreign-born population - Ireland (%)
Place of birth for the foreign-born population - Denmark (%)
Place of birth for the foreign-born population - Norway (%)
Place of birth for the foreign-born population - Sweden (%)
Place of birth for the foreign-born population - United Kingdom (%)
Place of birth for the foreign-born population - England (%)
Place of birth for the foreign-born population - Scotland (%)
Place of birth for the foreign-born population - Other Northern Europe (%)
Place of birth for the foreign-born population - Austria (%)
Place of birth for the foreign-born population - Belgium (%)
Place of birth for the foreign-born population - France (%)
Place of birth for the foreign-born population - Germany (%)
Place of birth for the foreign-born population - Netherlands (%)
Place of birth for the foreign-born population - Switzerland (%)
Place of birth for the foreign-born population - Other Western Europe (%)
Place of birth for the foreign-born population - Greece (%)
Place of birth for the foreign-born population - Italy (%)
Place of birth for the foreign-born population - Portugal (%)
Place of birth for the foreign-born population - Spain (%)
Place of birth for the foreign-born population - Other Southern Europe (%)
Place of birth for the foreign-born population - Albania (%)
Place of birth for the foreign-born population - Belarus (%)
Place of birth for the foreign-born population - Bosnia and Herzegovina (%)
Place of birth for the foreign-born population - Bulgaria (%)
Place of birth for the foreign-born population - Croatia (%)
Place of birth for the foreign-born population - Czechoslovakia (%)
Place of birth for the foreign-born population - Hungary (%)
Place of birth for the foreign-born population - Latvia (%)
Place of birth for the foreign-born population - Lithuania (%)
Place of birth for the foreign-born population - North Macedonia (Macedonia) (%)
Place of birth for the foreign-born population - Moldova (%)
Place of birth for the foreign-born population - Poland (%)
Place of birth for the foreign-born population - Romania (%)
Place of birth for the foreign-born population - Russia (%)
Place of birth for the foreign-born population - Serbia (%)
Place of birth for the foreign-born population - Ukraine (%)
Place of birth for the foreign-born population - Other Eastern Europe (%)
Place of birth for the foreign-born population - China (%)
Place of birth for the foreign-born population - Hong Kong (%)
Place of birth for the foreign-born population - Taiwan (%)
Place of birth for the foreign-born population - Japan (%)
Place of birth for the foreign-born population - Korea (%)
Place of birth for the foreign-born population - Other Eastern Asia (%)
Place of birth for the foreign-born population - Afghanistan (%)
Place of birth for the foreign-born population - Bangladesh (%)
Place of birth for the foreign-born population - India (%)
Place of birth for the foreign-born population - Iran (%)
Place of birth for the foreign-born population - Kazakhstan (%)
Place of birth for the foreign-born population - Nepal (%)
Place of birth for the foreign-born population - Pakistan (%)
Place of birth for the foreign-born population - Sri Lanka (%)
Place of birth for the foreign-born population - Uzbekistan (%)
Place of birth for the foreign-born population - Other South Central Asia (%)
Place of birth for the foreign-born population - Burma (%)
Place of birth for the foreign-born population - Cambodia (%)
Place of birth for the foreign-born population - Indonesia (%)
Place of birth for the foreign-born population - Laos (%)
Place of birth for the foreign-born population - Malaysia (%)
Place of birth for the foreign-born population - Philippines (%)
Place of birth for the foreign-born population - Singapore (%)
Place of birth for the foreign-born population - Thailand (%)
Place of birth for the foreign-born population - Vietnam (%)
Place of birth for the foreign-born population - Other South Eastern Asia (%)
Place of birth for the foreign-born population - Armenia (%)
Place of birth for the foreign-born population - Iraq (%)
Place of birth for the foreign-born population - Israel (%)
Place of birth for the foreign-born population - Jordan (%)
Place of birth for the foreign-born population - Kuwait (%)
Place of birth for the foreign-born population - Lebanon (%)
Place of birth for the foreign-born population - Saudi Arabia (%)
Place of birth for the foreign-born population - Syria (%)
Place of birth for the foreign-born population - Turkey (%)
Place of birth for the foreign-born population - Yemen (%)
Place of birth for the foreign-born population - Other Western Asia (%)
Place of birth for the foreign-born population - Eritrea (%)
Place of birth for the foreign-born population - Ethiopia (%)
Place of birth for the foreign-born population - Kenya (%)
Place of birth for the foreign-born population - Somalia (%)
Place of birth for the foreign-born population - Uganda (%)
Place of birth for the foreign-born population - Zimbabwe (%)
Place of birth for the foreign-born population - Other Eastern Africa (%)
Place of birth for the foreign-born population - Cameroon (%)
Place of birth for the foreign-born population - Congo (%)
Place of birth for the foreign-born population - Democratic Republic of Congo (Zaire) (%)
Place of birth for the foreign-born population - Other Middle Africa (%)
Place of birth for the foreign-born population - Egypt (%)
Place of birth for the foreign-born population - Morocco (%)
Place of birth for the foreign-born population - Sudan (%)
Place of birth for the foreign-born population - Other Northern Africa (%)
Place of birth for the foreign-born population - South Africa (%)
Place of birth for the foreign-born population - Other Southern Africa (%)
Place of birth for the foreign-born population - Cabo Verde (%)
Place of birth for the foreign-born population - Ghana (%)
Place of birth for the foreign-born population - Liberia (%)
Place of birth for the foreign-born population - Nigeria (%)
Place of birth for the foreign-born population - Senegal (%)
Place of birth for the foreign-born population - Sierra Leone (%)
Place of birth for the foreign-born population - Other Western Africa (%)
Place of birth for the foreign-born population - Australia (%)
Place of birth for the foreign-born population - New Zealand (%)
Place of birth for the foreign-born population - Fiji (%)
Place of birth for the foreign-born population - Micronesia (%)
Place of birth for the foreign-born population - Bahamas (%)
Place of birth for the foreign-born population - Barbados (%)
Place of birth for the foreign-born population - Cuba (%)
Place of birth for the foreign-born population - Dominica (%)
Place of birth for the foreign-born population - Dominican Republic (%)
Place of birth for the foreign-born population - Grenada (%)
Place of birth for the foreign-born population - Haiti (%)
Place of birth for the foreign-born population - Jamaica (%)
Place of birth for the foreign-born population - St. Vincent and the Grenadines (%)
Place of birth for the foreign-born population - Trinidad and Tobago (%)
Place of birth for the foreign-born population - West Indies (%)
Place of birth for the foreign-born population - Other Caribbean (%)
Place of birth for the foreign-born population - Belize (%)
Place of birth for the foreign-born population - Costa Rica (%)
Place of birth for the foreign-born population - El Salvador (%)
Place of birth for the foreign-born population - Guatemala (%)
Place of birth for the foreign-born population - Honduras (%)
Place of birth for the foreign-born population - Mexico (%)
Place of birth for the foreign-born population - Nicaragua (%)
Place of birth for the foreign-born population - Panama (%)
Place of birth for the foreign-born population - Other Central America (%)
Place of birth for the foreign-born population - Argentina (%)
Place of birth for the foreign-born population - Bolivia (%)
Place of birth for the foreign-born population - Brazil (%)
Place of birth for the foreign-born population - Chile (%)
Place of birth for the foreign-born population - Colombia (%)
Place of birth for the foreign-born population - Ecuador (%)
Place of birth for the foreign-born population - Guyana (%)
Place of birth for the foreign-born population - Peru (%)
Place of birth for the foreign-born population - Uruguay (%)
Place of birth for the foreign-born population - Venezuela (%)
Place of birth for the foreign-born population - Other South America (%)
Place of birth for the foreign-born population - Canada (%)
Place of birth for the foreign-born population - Other Northern America (%)
Place of birth for the foreign-born population - Other (%)
Latest news about races in Brunswick, GA collected exclusively by city-data.com from local newspapers, TV, and radio stations
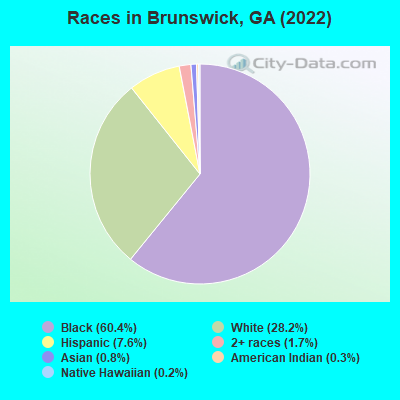
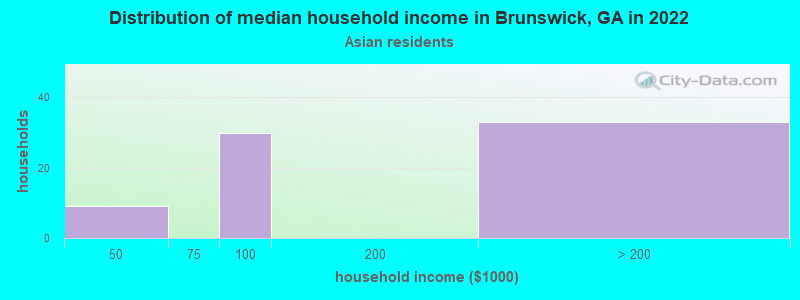
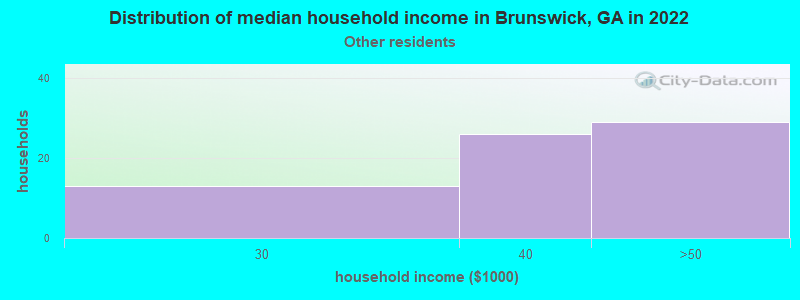
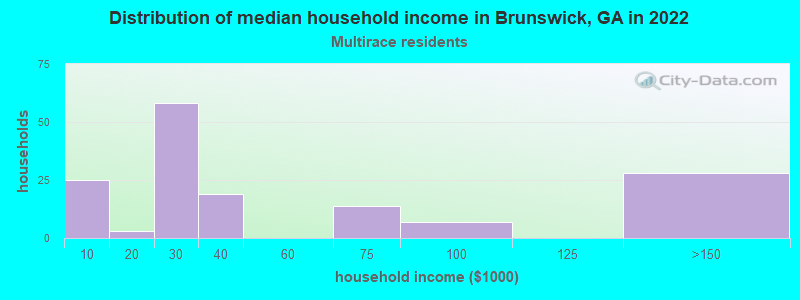
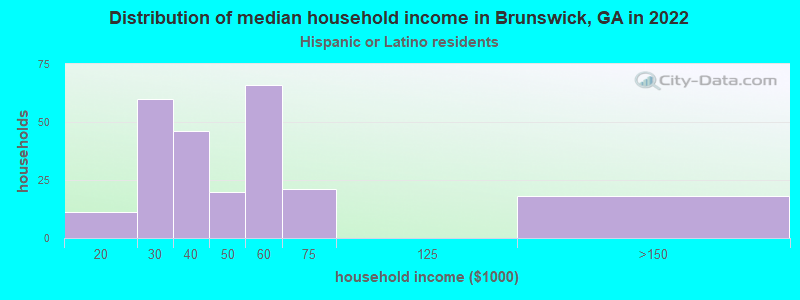
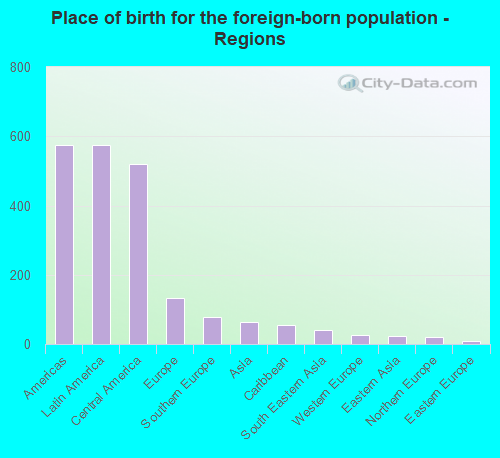
According to 2022 data, the most numerous races in Brunswick, GA are White alone (4,382 residents), Black alone (9,371 residents), and Hispanic (1,175 residents). 90.8% of Brunswick residents speak English at home. 5.0% of Brunswick, GA residents are foreign-born (3.6% born in Latin America, 0.8% born in Europe), which is 98.4% less than the foreign-born rate of 10.0% across the entire state of Georgia.
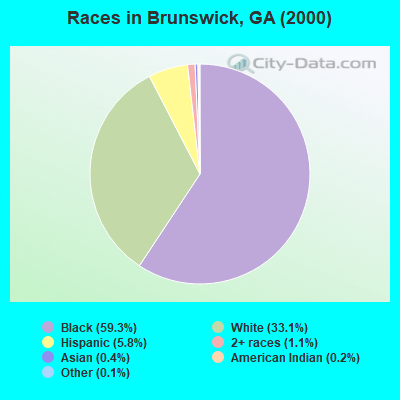
Race distribution in Brunswick
2000 2022
5,128,661 62.6% White alone 2,331,465 28.5% Black alone 435,227 5.3% Hispanic 171,513 2.1% Asian alone 87,364 1.1% Two or more races 17,670 0.2% American Indian alone 11,275 0.1% Other race alone 3,278 0.04% Native Hawaiian and Other
5,415,657 49.6% White alone 3,349,240 30.7% Black alone 1,132,604 10.4% Hispanic 479,156 4.4% Asian alone 462,923 4.2% Two or more races 54,416 0.5% Other race alone 11,923 0.1% American Indian alone 6,957 0.06% Native Hawaiian and Other
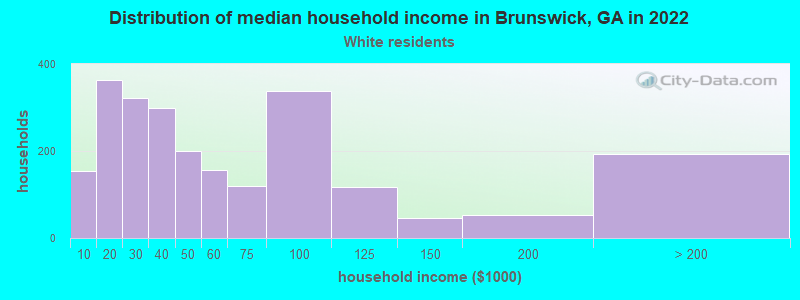
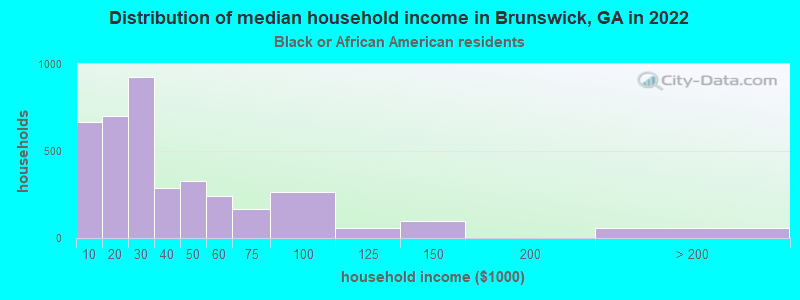
Income and house value in Brunswick Median household income in 2022 $37,254 White non-Hispanic householders$32,580 Black householders$39,027 Some other race householders$31,660 Two or more races householders$59,982 Hispanic or Latino race householdersMedian 2022 house value $171,660 White Non-Hispanic householders$100,927 Black or African American householders$95,015 Some other race householders$153,713 Two or more races householders$103,672 Hispanic or Latino householders
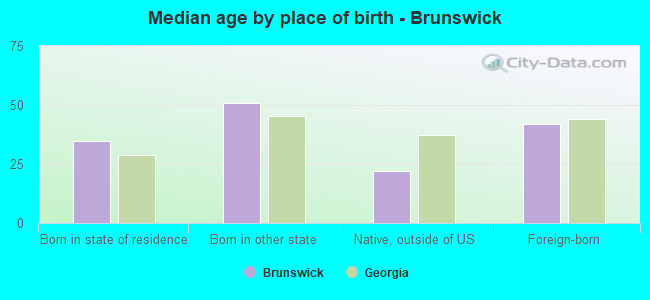
Median age by race in Brunswick
48.1 Median age for White residents42.2 49.3 35.4 Median age for Black or African American residents32.4 36.3 -498,168,497.7 Median age for American Indian / Alaska Native residents-388,888,888.5 -597,938,143.7 61.4 Median age for Asian residents61.9 60.5 -657,243,815.6 Median age for Native Hawaiian / Pacific Islander residents-693,227,090.9 -666,666,666.0 15.1 Median age for Other race residents34.4 14.3 33.7 Median age for Two or more races residents26.4 42.7 49.2 Median age for White alone residents46.0 48.7 23.3 Median age for Hispanic or Latino residents29.6 17.5
Owner/renter occupied households by race in Brunswick
House owners and renters - White residents 1,114 48.7% Owner occupied1,176 51.3% Renter occupiedHouse owners and renters - Black or African American residents 1,535 44.4% Owner occupied1,921 55.6% Renter occupiedHouse owners and renters - Asian residents 79 100.0% Owner occupiedHouse owners and renters - Other race residents 39 50.6% Owner occupied38 49.4% Renter occupiedHouse owners and renters - Two or more races residents 88 54.0% Owner occupied75 46.0% Renter occupiedHouse owners and renters - White alone residents 1,056 47.1% Owner occupied1,186 52.9% Renter occupiedHouse owners and renters - Hispanic or Latino residents 139 47.4% Owner occupied154 52.6% Renter occupied
Language usage in Brunswick
English speakers - Total 90.8% of residents of Brunswick speak English at home.
7.2% of residents speak Spanish at home 697 67.5% Speak English very well335 32.5% Speak English less than very well2.2% of residents speak other language at home 171 54.8% Speak English very well141 45.2% Speak English less than very well
English speakers - Born in the United States 97.4% of residents of Brunswick speak English at home.
2.1% of residents speak Spanish at home 59 75.6% Speak English very well19 24.4% Speak English less than very well1.2% of residents speak other language at home 45 100.0% Speak English very well
English speakers - Native, born elsewhere 68.3% of residents of Brunswick speak English at home.
47.0% of residents speak Spanish at home 86 100.0% Speak English very well
English speakers - Foreign-born 22.1% of residents of Brunswick speak English at home.
46.5% of residents speak Spanish at home 199 44.5% Speak English very well248 55.5% Speak English less than very well20.4% of residents speak other language at home 51 26.0% Speak English very well145 74.0% Speak English less than very well
White (Caucasian) - Speak only English Native:
94.5% (4,118)Foreign-born:
16.9% (37)
White (Caucasian) - Speak another language Native:
4.2% (182)Foreign-born:
75.7% (166)
Black or African American - Speak only English Native:
97.8% (8,268)Foreign-born:
67.6% (40)
Black or African American - Speak another language Native:
2.2% (188)Foreign-born:
31.4% (18)
American Indian / Alaska Native - Speak only English Native:
95.0% (49)Foreign-born:
96.6% (3)
Asian - Speak only English Native:
83.8% (60)Foreign-born:
56.7% (35)
Asian - Speak another language Native:
13.0% (9)Foreign-born:
38.2% (24)
Other race - Speak another language Native:
44.6% (108)Foreign-born:
99.0% (218)
Two or more races - Speak another language Native:
25.0% (86)Foreign-born:
99.4% (202)
White alone - Speak only English Native:
98.2% (4,033)Foreign-born:
24.2% (39)
White alone - Speak another language Native:
1.7% (71)Foreign-born:
86.0% (139)
Hispanic or Latino - Speak only English Native:
25.8% (140)Foreign-born:
0.8% (4)
Hispanic or Latino - Speak another language Native:
76.3% (415)Foreign-born:
94.5% (517)
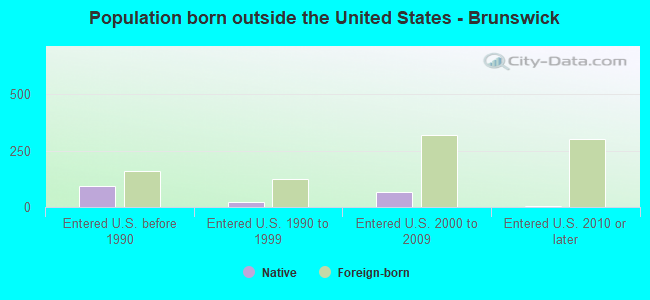
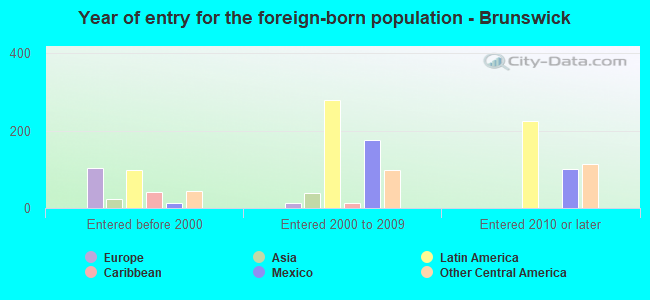
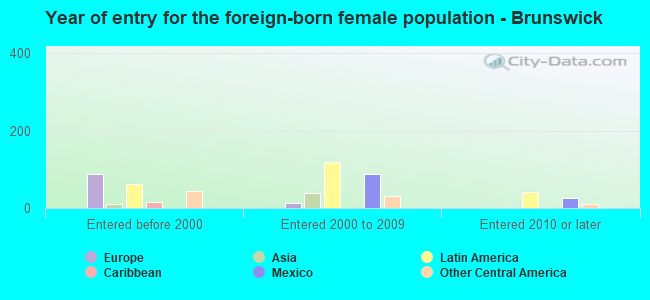
Foreign-born residents in Brunswick 773 residents are foreign born (3.6% Latin America , 0.8% Europe ).
This city:
5.0%Georgia:
10.4%
Marital status for residents in Brunswick Marital status - White (Caucasian) population 15 years and over
Males 38.2% Never married33.0% Now married1.0% Separated9.2% Widowed18.6% DivorcedFemales 18.5% Never married40.9% Now married0.5% Separated21.8% Widowed18.3% DivorcedWomen who gave birth in the past 12 months Now married:
54.5% (23)Unmarried:
45.5% (20)
Women who did not give birth in the past 12 months Now married:
49.4% (464)Unmarried:
50.6% (475)
Marital status - Black or African American population 15 years and over
Males 64.2% Never married18.8% Now married2.3% Separated2.7% Widowed12.1% DivorcedFemales 53.7% Never married13.7% Now married3.5% Separated8.3% Widowed20.7% DivorcedWomen who gave birth in the past 12 months Now married:
0.0% (0)Unmarried:
100.0% (116)
Women who did not give birth in the past 12 months Now married:
17.3% (412)Unmarried:
82.7% (1,975)
Marital status - Asian population 15 years and over
Males 16.7% Never married83.3% Now married0.0% Separated0.0% Widowed0.0% DivorcedFemales 0.0% Never married50.6% Now married0.0% Separated0.0% Widowed49.4% DivorcedWomen who did not give birth in the past 12 months Now married:
100.0% (30)Unmarried:
0.0% (0)
Marital status - Other race population 15 years and over
Males 17.3% Never married82.7% Now married0.0% Separated0.0% Widowed0.0% DivorcedFemales 43.1% Never married56.9% Now married0.0% Separated0.0% Widowed0.0% DivorcedWomen who gave birth in the past 12 months Now married:
100.0% (27)Unmarried:
0.0% (0)
Women who did not give birth in the past 12 months Now married:
39.2% (26)Unmarried:
60.8% (40)
Marital status - Two or more races population 15 years and over
Males 46.6% Never married31.5% Now married8.9% Separated0.0% Widowed13.0% DivorcedFemales 66.2% Never married29.4% Now married0.0% Separated0.0% Widowed4.4% DivorcedWomen who did not give birth in the past 12 months Now married:
36.7% (59)Unmarried:
63.3% (102)
Marital status - White alone, not Hispanic / Latino population 15 years and over
Males 33.4% Never married33.9% Now married1.1% Separated10.4% Widowed21.2% DivorcedFemales 16.0% Never married41.0% Now married0.5% Separated23.1% Widowed19.4% DivorcedWomen who gave birth in the past 12 months Now married:
54.5% (25)Unmarried:
45.5% (21)
Women who did not give birth in the past 12 months Now married:
53.6% (489)Unmarried:
46.4% (423)
Marital status - Hispanic or Latino population 15 years and over
Males 52.7% Never married44.2% Now married2.8% Separated0.0% Widowed0.4% DivorcedFemales 45.3% Never married45.6% Now married0.0% Separated0.0% Widowed9.1% DivorcedWomen who gave birth in the past 12 months Now married:
100.0% (23)Unmarried:
0.0% (0)
Women who did not give birth in the past 12 months Now married:
31.6% (65)Unmarried:
68.4% (140)
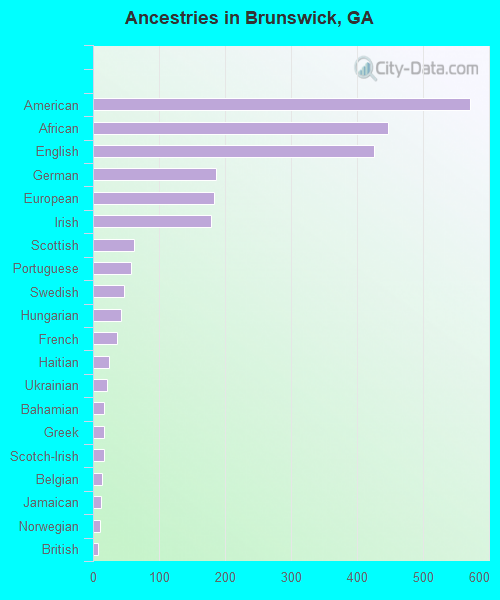
Ancestries in Brunswick
572 5.6% American448 4.4% African426 4.2% English187 1.8% German183 1.8% European179 1.8% Irish62 0.6% Scottish57 0.6% Portuguese47 0.5% Swedish42 0.4% Hungarian36 0.4% French25 0.2% Haitian21 0.2% Ukrainian17 0.2% Bahamian16 0.2% Greek16 0.2% Scotch-Irish13 0.1% Belgian12 0.1% Jamaican11 0.1% Norwegian8 0.08% British
Children Nativity (place of birth) in Brunswick
Children under 6 years - Living with two parents Both parents native 189 100.0% NativeBoth parents foreign-born 61 100.0% NativeChildren under 6 years - Living with one parent Native parent 622 100.0% NativeForeign-born parent 56 100.0% NativeChildren 6 to 17 years - Living with two parents Both parents native 350 100.0% NativeBoth parents foreign-born 92 84.1% Native17 15.9% Foreign-bornChildren 6 to 17 years - Living with one parent Native parent 1,280 100.0% NativeForeign-born parent 231 54.7% Native191 45.3% Foreign-born
Grandparents responsible for own grandchildren in Brunswick
Grandparents (30 to 59 years) Black or African American 116 76.9% Responsible for grandchildren35 23.1% Not responsible for grandchildrenGrandparents (60 years and over) Black or African American 114 66.8% Responsible for grandchildren56 33.2% Not responsible for grandchildren