Races in Brunswick, New York (NY) Detailed Stats
Ancestries, Foreign-born residents, place of birth

Recent posts about races in Brunswick, New York on our local forum with over 2,400,000 registered users:
 | Capital Region bids farewell to ShopRite: Five local stores set for closure (9 replies) |
| Moving to Albany area (6 replies) |
| Moving from Central IL - Capitol Region or NC RTP ? (33 replies) |
| Neighborhoods in Rensselaer/Troy area (2 replies) |
| Guilderland or East Greenbush for family? (11 replies) |
| NYTimes article about Troy... from 1979 (11 replies) |
3.4% of Brunswick, NY residents are foreign-born (1.4% born in Asia, 1.1% born in Europe, 0.6% born in North America, 0.4% born in Latin America), which is 541.5% less than the foreign-born rate of 22.0% across the entire state of New York.
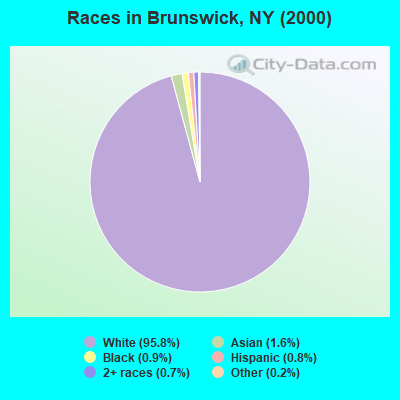
Race distribution in Brunswick

- 11,17795.8%White alone
- 1861.6%Asian alone
- 1040.9%Black alone
- 930.8%Hispanic
- 770.7%Two or more races
- 180.2%Other race alone
- 70.06%American Indian alone
- 20.02%Native Hawaiian and Other
Pacific Islander alone
2000
2022
-
- 11,760,98162.0%White alone
- 2,867,58315.1%Hispanic
- 2,812,62314.8%Black alone
- 1,035,9265.5%Asian alone
- 366,1161.9%Two or more races
- 75,4990.4%Other race alone
- 52,4990.3%American Indian alone
- 5,2300.03%Native Hawaiian and Other
Pacific Islander alone

-
- 10,408,93352.9%White alone
- 3,867,29919.7%Hispanic
- 2,633,84013.4%Black alone
- 1,776,2869.0%Asian alone
- 732,6703.7%Two or more races
- 216,1101.1%Other race alone
- 35,0820.2%American Indian alone
- 6,9310.04%Native Hawaiian and Other
Pacific Islander alone

Income and house value in Brunswick
- Median household income in 2022
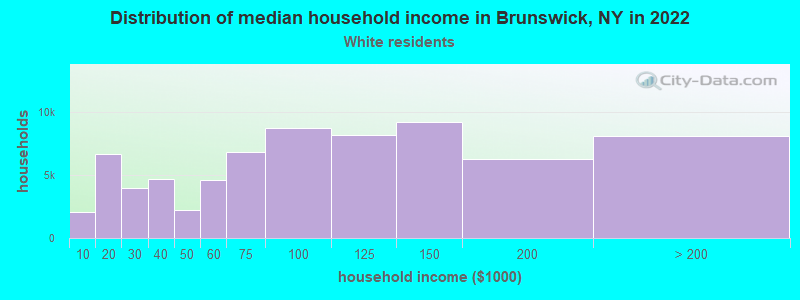
- $114,191White non-Hispanic householders
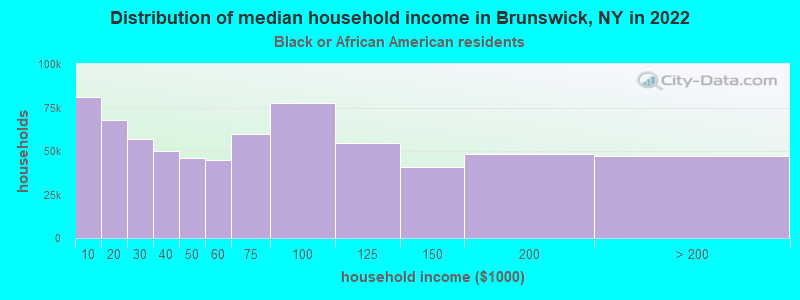
- $72,338Black householders
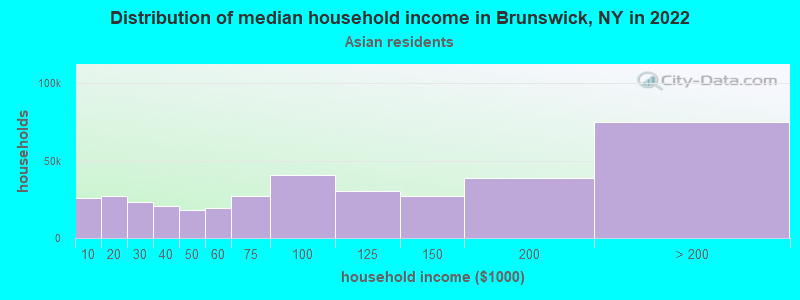
- $132,220Asian householders
- over $200,000Some other race householders
- $50,737Two or more races householders
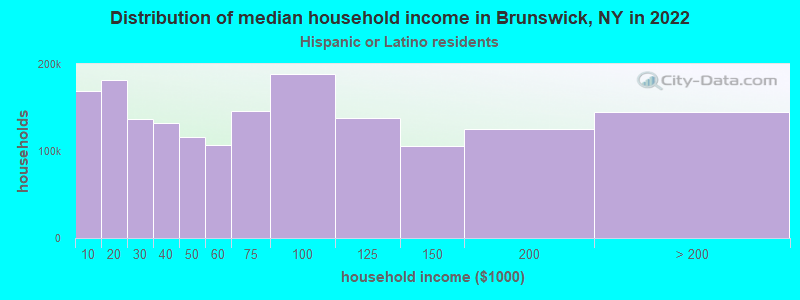
- over $200,000Hispanic or Latino race householders
- Median 2022 house value
- $287,323White Non-Hispanic householders
- $342,645Black or African American householders
- $560,692Some other race householders
- $195,121Two or more races householders
- $602,308Hispanic or Latino householders
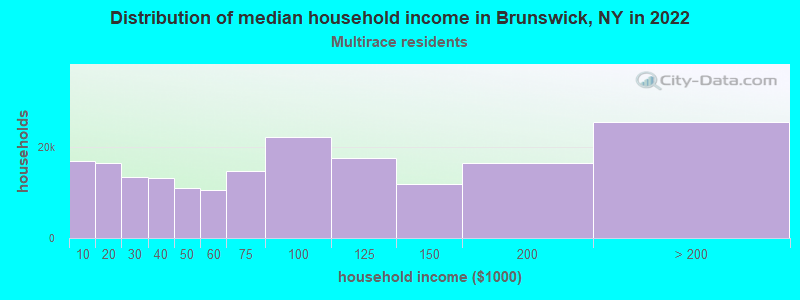
Household income for White non-Hispanic householders
Household income for Black householders
Household income for Asian householders
Household income for Two or more races householders
Household income for Hispanic or Latino race householders
Foreign-born residents in Brunswick
400 residents are foreign born (1.4% Asia, 1.1% Europe, 0.6% North America, 0.4% Latin America).
| This city: | 3.4% |
| New York: | 20.4% |
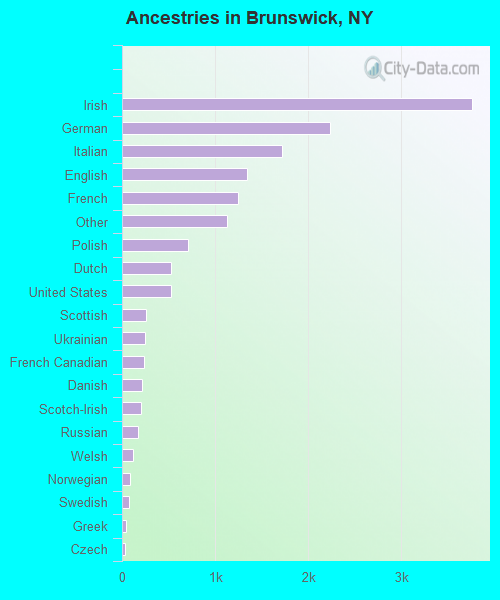
Ancestries in Brunswick

- 3,75725.1%Irish
- 2,23914.9%German
- 1,72211.5%Italian
- 1,3479.0%English
- 1,2488.3%French
- 1,1277.5%Other
- 7134.8%Polish
- 5263.5%Dutch
- 5243.5%United States
- 2581.7%Scottish
- 2421.6%Ukrainian
- 2381.6%French Canadian
- 2161.4%Danish
- 2081.4%Scotch-Irish
- 1691.1%Russian
- 1140.8%Welsh
- 840.6%Norwegian
- 770.5%Swedish
- 420.3%Greek
- 360.2%Czech
- 270.2%Hungarian
- 230.2%Arab
- 210.1%Swiss
- 160.1%Lithuanian
- 150.1%Slovak
- 80.05%Portuguese
Zip codes: 12180.