Races in Bryn Mawr-Skyway, Washington (WA) Detailed Stats
Data:
Races - White alone (%)
Races - White alone (% change since 2000)
Races - Black alone (%)
Races - Black alone (% change since 2000)
Races - American Indian alone (%)
Races - American Indian alone (% change since 2000)
Races - Asian alone (%)
Races - Asian alone (% change since 2000)
Races - Hispanic (%)
Races - Hispanic (% change since 2000)
Races - Native Hawaiian and Other Pacific Islander alone (%)
Races - Native Hawaiian and Other Pacific Islander alone (% change since 2000)
Races - Two or more races(%)
Races - Two or more races(% change since 2000)
Races - Other race alone (%)
Races - Other race alone (% change since 2000)
Racial diversity
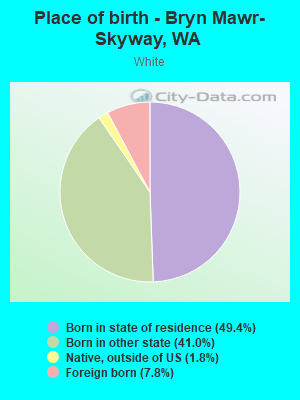
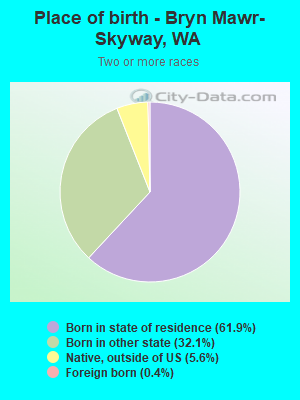
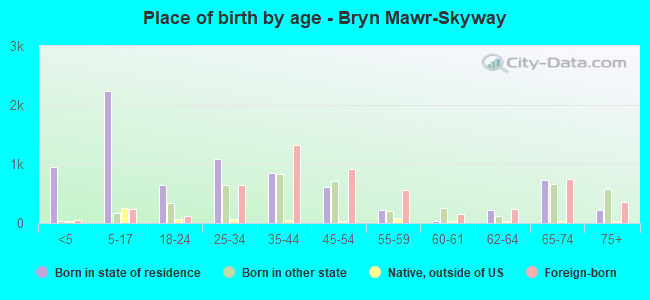
Place of birth - Born in state of residence (%)
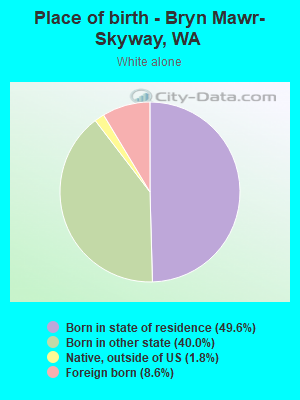
Place of birth - Born in state of residence (%) - White
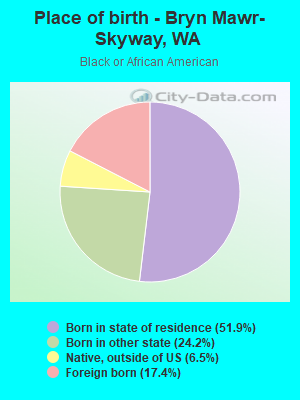
Place of birth - Born in state of residence (%) - Black or African American
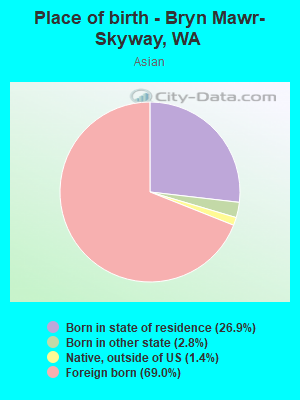
Place of birth - Born in state of residence (%) - Asian
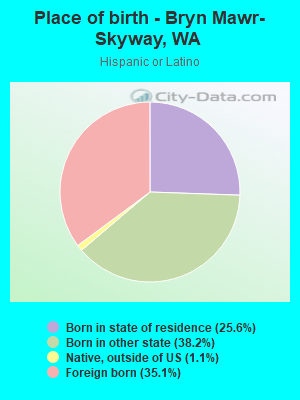
Place of birth - Born in state of residence (%) - Hispanic or Latino
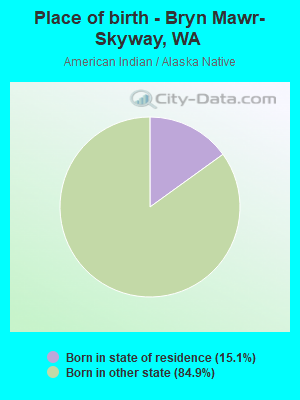
Place of birth - Born in state of residence (%) - American Indian and Alaska Native
Place of birth - Born in state of residence (%) - Multirace
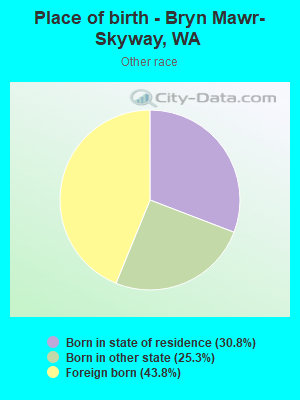
Place of birth - Born in state of residence (%) - Other Race
Place of birth - Born in other state (%)
Place of birth - Born in other state (%) - White
Place of birth - Born in other state (%) - Black or African American
Place of birth - Born in other state (%) - Asian
Place of birth - Born in other state (%) - Hispanic or Latino
Place of birth - Born in other state (%) - American Indian and Alaska Native
Place of birth - Born in other state (%) - Multirace
Place of birth - Born in other state (%) - Other Race
Place of birth - Native, outside of US (%)
Place of birth - Native, outside of US (%) - White
Place of birth - Native, outside of US (%) - Black or African American
Place of birth - Native, outside of US (%) - Asian
Place of birth - Native, outside of US (%) - Hispanic or Latino
Place of birth - Native, outside of US (%) - American Indian and Alaska Native
Place of birth - Native, outside of US (%) - Multirace
Place of birth - Native, outside of US (%) - Other Race
Place of birth - Foreign born (%)
Place of birth - Foreign born (%) - White
Place of birth - Foreign born (%) - Black or African American
Place of birth - Foreign born (%) - Asian
Place of birth - Foreign born (%) - Hispanic or Latino
Place of birth - Foreign born (%) - American Indian and Alaska Native
Place of birth - Foreign born (%) - Multirace
Place of birth - Foreign born (%) - Other Race
Residents speaking English at home (%)
Residents speaking English at home - Born in the United States (%)
Residents speaking English at home - Native, born elsewhere (%)
Residents speaking English at home - Foreign born (%)
Residents speaking Spanish at home (%)
Residents speaking Spanish at home - Born in the United States (%)
Residents speaking Spanish at home - Native, born elsewhere (%)
Residents speaking Spanish at home - Foreign born (%)
Residents speaking other language at home (%)
Residents speaking other language at home - Born in the United States (%)
Residents speaking other language at home - Native, born elsewhere (%)
Residents speaking other language at home - Foreign born (%)
Marital status - Never married (%)
Marital status - Now married (%)
Marital status - Separated (%)
Marital status - Widowed (%)
Marital status - Divorced (%)
Ancestries Reported - Arab (%)
Ancestries Reported - Czech (%)
Ancestries Reported - Danish (%)
Ancestries Reported - Dutch (%)
Ancestries Reported - English (%)
Ancestries Reported - French (%)
Ancestries Reported - French Canadian (%)
Ancestries Reported - German (%)
Ancestries Reported - Greek (%)
Ancestries Reported - Hungarian (%)
Ancestries Reported - Irish (%)
Ancestries Reported - Italian (%)
Ancestries Reported - Lithuanian (%)
Ancestries Reported - Norwegian (%)
Ancestries Reported - Polish (%)
Ancestries Reported - Portuguese (%)
Ancestries Reported - Russian (%)
Ancestries Reported - Scotch-Irish (%)
Ancestries Reported - Scottish (%)
Ancestries Reported - Slovak (%)
Ancestries Reported - Subsaharan African (%)
Ancestries Reported - Swedish (%)
Ancestries Reported - Swiss (%)
Ancestries Reported - Ukrainian (%)
Ancestries Reported - United States (%)
Ancestries Reported - Welsh (%)
Ancestries Reported - West Indian (%)
Ancestries Reported - Other (%)
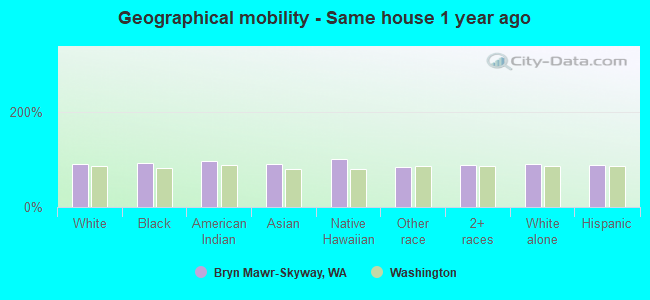
Geographical mobility - Same house 1 year ago (%)
Geographical mobility - Same house 1 year ago (%) - White
Geographical mobility - Same house 1 year ago (%) - Black or African American
Geographical mobility - Same house 1 year ago (%) - Asian
Geographical mobility - Same house 1 year ago (%) - Hispanic or Latino
Geographical mobility - Same house 1 year ago (%) - American Indian and Alaska Native
Geographical mobility - Same house 1 year ago (%) - Multirace
Geographical mobility - Same house 1 year ago (%) - Other Race
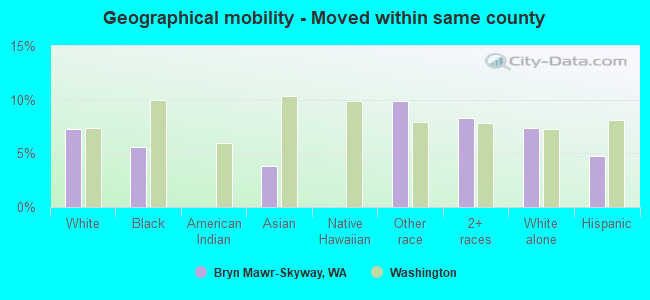
Geographical mobility - Moved within same county (%)
Geographical mobility - Moved within same county (%) - White
Geographical mobility - Moved within same county (%) - Black or African American
Geographical mobility - Moved within same county (%) - Asian
Geographical mobility - Moved within same county (%) - Hispanic or Latino
Geographical mobility - Moved within same county (%) - American Indian and Alaska Native
Geographical mobility - Moved within same county (%) - Multirace
Geographical mobility - Moved within same county (%) - Other Race
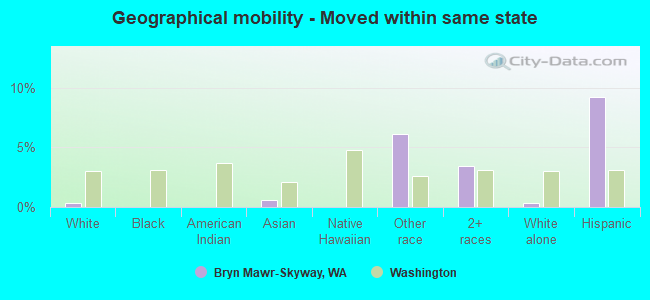
Geographical mobility - Moved from different county within same state (%)
Geographical mobility - Moved from different county within same state (%) - White
Geographical mobility - Moved from different county within same state (%) - Black or African American
Geographical mobility - Moved from different county within same state (%) - Asian
Geographical mobility - Moved from different county within same state (%) - Hispanic or Latino
Geographical mobility - Moved from different county within same state (%) - American Indian and Alaska Native
Geographical mobility - Moved from different county within same state (%) - Multirace
Geographical mobility - Moved from different county within same state (%) - Other Race
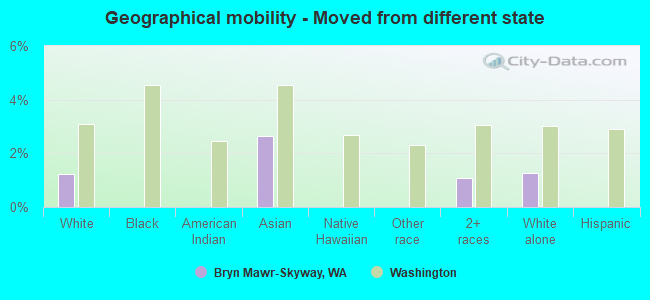
Geographical mobility - Moved from different state (%)
Geographical mobility - Moved from different state (%) - White
Geographical mobility - Moved from different state (%) - Black or African American
Geographical mobility - Moved from different state (%) - Asian
Geographical mobility - Moved from different state (%) - Hispanic or Latino
Geographical mobility - Moved from different state (%) - American Indian and Alaska Native
Geographical mobility - Moved from different state (%) - Multirace
Geographical mobility - Moved from different state (%) - Other Race
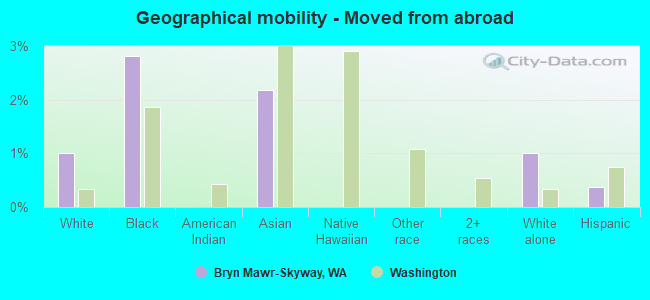
Geographical mobility - Moved from abroad (%)
Geographical mobility - Moved from abroad (%) - White
Geographical mobility - Moved from abroad (%) - Black or African American
Geographical mobility - Moved from abroad (%) - Asian
Geographical mobility - Moved from abroad (%) - Hispanic or Latino
Geographical mobility - Moved from abroad (%) - American Indian and Alaska Native
Geographical mobility - Moved from abroad (%) - Multirace
Geographical mobility - Moved from abroad (%) - Other Race
Place of birth for the foreign-born population - Ireland (%)
Place of birth for the foreign-born population - Denmark (%)
Place of birth for the foreign-born population - Norway (%)
Place of birth for the foreign-born population - Sweden (%)
Place of birth for the foreign-born population - United Kingdom (%)
Place of birth for the foreign-born population - England (%)
Place of birth for the foreign-born population - Scotland (%)
Place of birth for the foreign-born population - Other Northern Europe (%)
Place of birth for the foreign-born population - Austria (%)
Place of birth for the foreign-born population - Belgium (%)
Place of birth for the foreign-born population - France (%)
Place of birth for the foreign-born population - Germany (%)
Place of birth for the foreign-born population - Netherlands (%)
Place of birth for the foreign-born population - Switzerland (%)
Place of birth for the foreign-born population - Other Western Europe (%)
Place of birth for the foreign-born population - Greece (%)
Place of birth for the foreign-born population - Italy (%)
Place of birth for the foreign-born population - Portugal (%)
Place of birth for the foreign-born population - Spain (%)
Place of birth for the foreign-born population - Other Southern Europe (%)
Place of birth for the foreign-born population - Albania (%)
Place of birth for the foreign-born population - Belarus (%)
Place of birth for the foreign-born population - Bosnia and Herzegovina (%)
Place of birth for the foreign-born population - Bulgaria (%)
Place of birth for the foreign-born population - Croatia (%)
Place of birth for the foreign-born population - Czechoslovakia (%)
Place of birth for the foreign-born population - Hungary (%)
Place of birth for the foreign-born population - Latvia (%)
Place of birth for the foreign-born population - Lithuania (%)
Place of birth for the foreign-born population - North Macedonia (Macedonia) (%)
Place of birth for the foreign-born population - Moldova (%)
Place of birth for the foreign-born population - Poland (%)
Place of birth for the foreign-born population - Romania (%)
Place of birth for the foreign-born population - Russia (%)
Place of birth for the foreign-born population - Serbia (%)
Place of birth for the foreign-born population - Ukraine (%)
Place of birth for the foreign-born population - Other Eastern Europe (%)
Place of birth for the foreign-born population - China (%)
Place of birth for the foreign-born population - Hong Kong (%)
Place of birth for the foreign-born population - Taiwan (%)
Place of birth for the foreign-born population - Japan (%)
Place of birth for the foreign-born population - Korea (%)
Place of birth for the foreign-born population - Other Eastern Asia (%)
Place of birth for the foreign-born population - Afghanistan (%)
Place of birth for the foreign-born population - Bangladesh (%)
Place of birth for the foreign-born population - India (%)
Place of birth for the foreign-born population - Iran (%)
Place of birth for the foreign-born population - Kazakhstan (%)
Place of birth for the foreign-born population - Nepal (%)
Place of birth for the foreign-born population - Pakistan (%)
Place of birth for the foreign-born population - Sri Lanka (%)
Place of birth for the foreign-born population - Uzbekistan (%)
Place of birth for the foreign-born population - Other South Central Asia (%)
Place of birth for the foreign-born population - Burma (%)
Place of birth for the foreign-born population - Cambodia (%)
Place of birth for the foreign-born population - Indonesia (%)
Place of birth for the foreign-born population - Laos (%)
Place of birth for the foreign-born population - Malaysia (%)
Place of birth for the foreign-born population - Philippines (%)
Place of birth for the foreign-born population - Singapore (%)
Place of birth for the foreign-born population - Thailand (%)
Place of birth for the foreign-born population - Vietnam (%)
Place of birth for the foreign-born population - Other South Eastern Asia (%)
Place of birth for the foreign-born population - Armenia (%)
Place of birth for the foreign-born population - Iraq (%)
Place of birth for the foreign-born population - Israel (%)
Place of birth for the foreign-born population - Jordan (%)
Place of birth for the foreign-born population - Kuwait (%)
Place of birth for the foreign-born population - Lebanon (%)
Place of birth for the foreign-born population - Saudi Arabia (%)
Place of birth for the foreign-born population - Syria (%)
Place of birth for the foreign-born population - Turkey (%)
Place of birth for the foreign-born population - Yemen (%)
Place of birth for the foreign-born population - Other Western Asia (%)
Place of birth for the foreign-born population - Eritrea (%)
Place of birth for the foreign-born population - Ethiopia (%)
Place of birth for the foreign-born population - Kenya (%)
Place of birth for the foreign-born population - Somalia (%)
Place of birth for the foreign-born population - Uganda (%)
Place of birth for the foreign-born population - Zimbabwe (%)
Place of birth for the foreign-born population - Other Eastern Africa (%)
Place of birth for the foreign-born population - Cameroon (%)
Place of birth for the foreign-born population - Congo (%)
Place of birth for the foreign-born population - Democratic Republic of Congo (Zaire) (%)
Place of birth for the foreign-born population - Other Middle Africa (%)
Place of birth for the foreign-born population - Egypt (%)
Place of birth for the foreign-born population - Morocco (%)
Place of birth for the foreign-born population - Sudan (%)
Place of birth for the foreign-born population - Other Northern Africa (%)
Place of birth for the foreign-born population - South Africa (%)
Place of birth for the foreign-born population - Other Southern Africa (%)
Place of birth for the foreign-born population - Cabo Verde (%)
Place of birth for the foreign-born population - Ghana (%)
Place of birth for the foreign-born population - Liberia (%)
Place of birth for the foreign-born population - Nigeria (%)
Place of birth for the foreign-born population - Senegal (%)
Place of birth for the foreign-born population - Sierra Leone (%)
Place of birth for the foreign-born population - Other Western Africa (%)
Place of birth for the foreign-born population - Australia (%)
Place of birth for the foreign-born population - New Zealand (%)
Place of birth for the foreign-born population - Fiji (%)
Place of birth for the foreign-born population - Micronesia (%)
Place of birth for the foreign-born population - Bahamas (%)
Place of birth for the foreign-born population - Barbados (%)
Place of birth for the foreign-born population - Cuba (%)
Place of birth for the foreign-born population - Dominica (%)
Place of birth for the foreign-born population - Dominican Republic (%)
Place of birth for the foreign-born population - Grenada (%)
Place of birth for the foreign-born population - Haiti (%)
Place of birth for the foreign-born population - Jamaica (%)
Place of birth for the foreign-born population - St. Vincent and the Grenadines (%)
Place of birth for the foreign-born population - Trinidad and Tobago (%)
Place of birth for the foreign-born population - West Indies (%)
Place of birth for the foreign-born population - Other Caribbean (%)
Place of birth for the foreign-born population - Belize (%)
Place of birth for the foreign-born population - Costa Rica (%)
Place of birth for the foreign-born population - El Salvador (%)
Place of birth for the foreign-born population - Guatemala (%)
Place of birth for the foreign-born population - Honduras (%)
Place of birth for the foreign-born population - Mexico (%)
Place of birth for the foreign-born population - Nicaragua (%)
Place of birth for the foreign-born population - Panama (%)
Place of birth for the foreign-born population - Other Central America (%)
Place of birth for the foreign-born population - Argentina (%)
Place of birth for the foreign-born population - Bolivia (%)
Place of birth for the foreign-born population - Brazil (%)
Place of birth for the foreign-born population - Chile (%)
Place of birth for the foreign-born population - Colombia (%)
Place of birth for the foreign-born population - Ecuador (%)
Place of birth for the foreign-born population - Guyana (%)
Place of birth for the foreign-born population - Peru (%)
Place of birth for the foreign-born population - Uruguay (%)
Place of birth for the foreign-born population - Venezuela (%)
Place of birth for the foreign-born population - Other South America (%)
Place of birth for the foreign-born population - Canada (%)
Place of birth for the foreign-born population - Other Northern America (%)
Place of birth for the foreign-born population - Other (%)
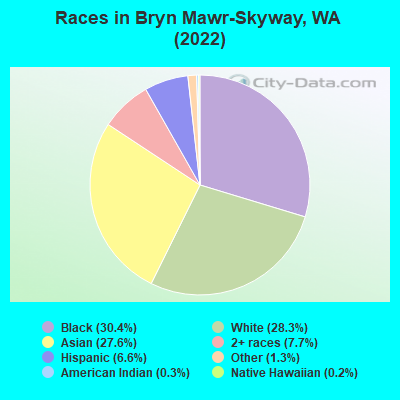
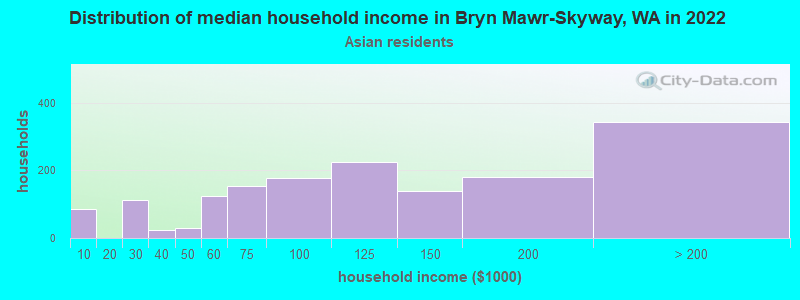
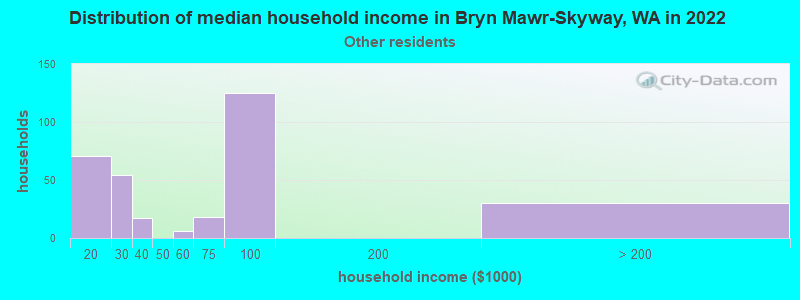
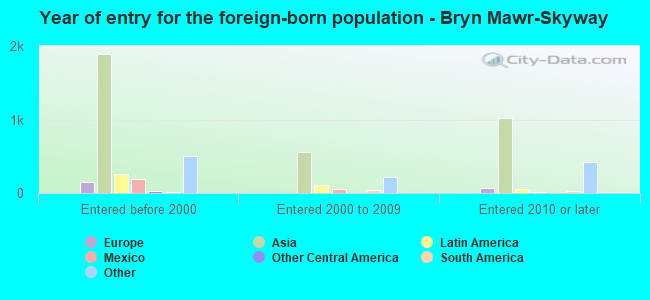
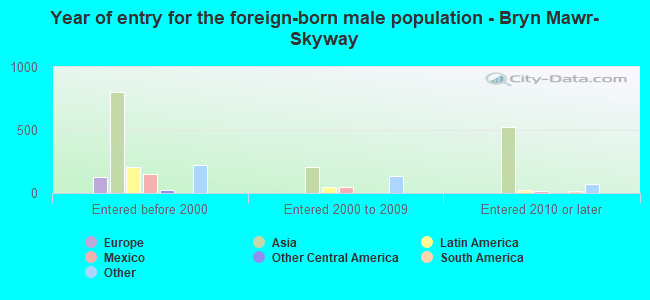
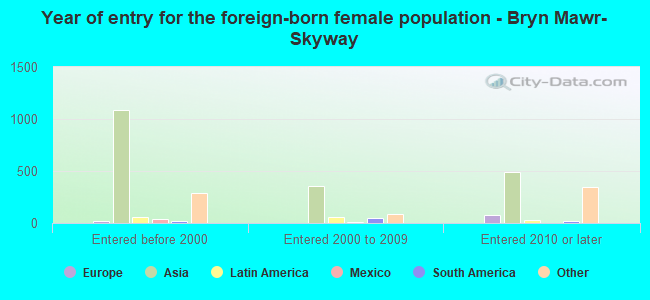
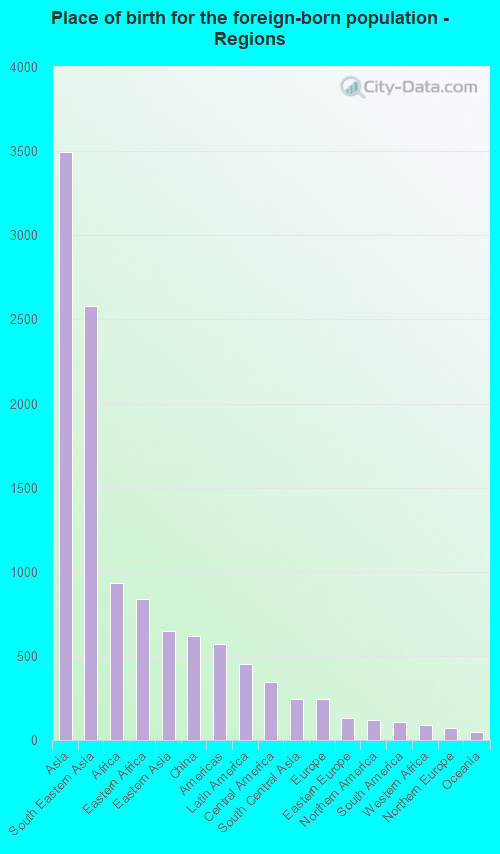
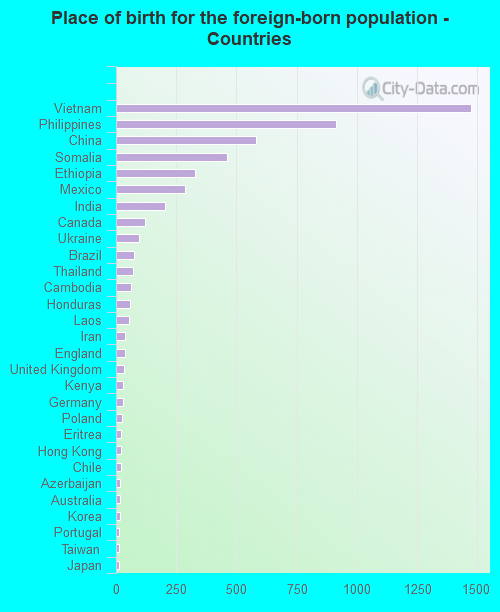
According to 2022 data, the most numerous races in Bryn Mawr-Skyway, WA are White alone (5,129 residents), Hispanic (1,189 residents), and Asian alone (4,998 residents). 62.0% of Bryn Mawr-Skyway residents speak English at home. 29.2% of Bryn Mawr-Skyway, WA residents are foreign-born (18.5% born in Asia, 4.9% born in Africa), which is 48.5% greater than the foreign-born rate of 15.0% across the entire state of Washington.
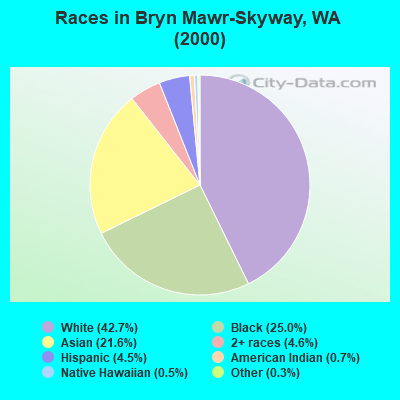
Race distribution in Bryn Mawr-Skyway
2000 2022
4,652,490 78.9% White alone 441,509 7.5% Hispanic 319,401 5.4% Asian alone 184,631 3.1% Black alone 175,926 3.0% Two or more races 85,396 1.4% American Indian alone 22,779 0.4% Native Hawaiian and Other 11,989 0.2% Other race alone
4,941,456 63.5% White alone 1,093,313 14.0% Hispanic 755,832 9.7% Asian alone 523,448 6.7% Two or more races 299,537 3.8% Black alone 69,024 0.9% American Indian alone 52,231 0.7% Native Hawaiian and Other 50,945 0.7% Other race alone
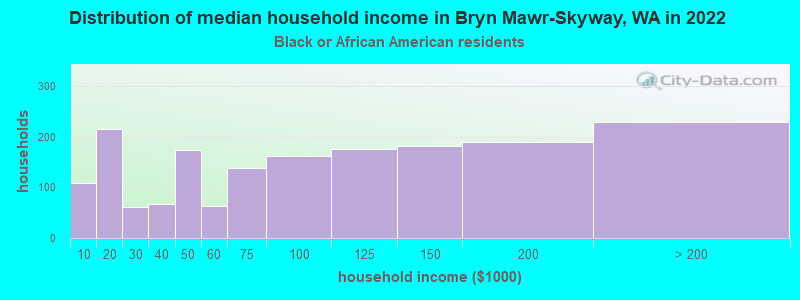
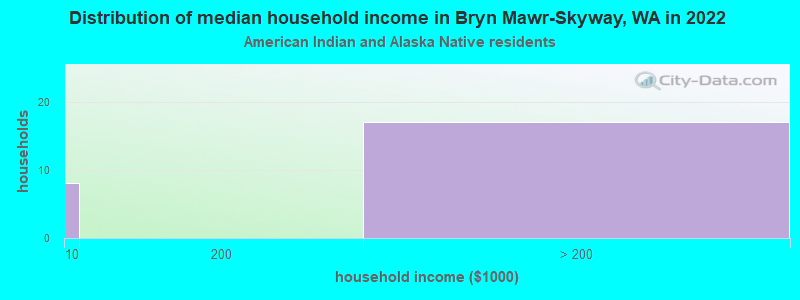
Income and house value in Bryn Mawr-Skyway Median household income in 2022 $90,095 White non-Hispanic householders$72,933 Black householders$115,731 Asian householders$99,559 Two or more races householders$85,444 Hispanic or Latino race householdersMedian 2022 house value $679,056 White Non-Hispanic householders$685,835 Black or African American householders$499,029 American Indian or Alaska Native householders $718,225 Asian householdersover $1,000,000 Native Hawaiian and other Pacific Islander householders$517,860 Some other race householders$506,938 Two or more races householders$674,913 Hispanic or Latino householders
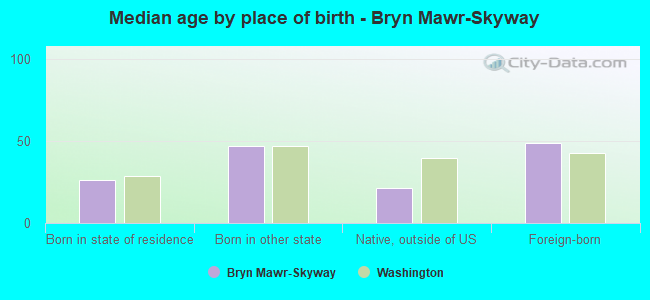
Median age by race in Bryn Mawr-Skyway
46.8 Median age for White residents42.1 48.8 36.4 Median age for Black or African American residents36.8 32.9 6.4 Median age for American Indian / Alaska Native residents-658,092,175.1 28.8 38.6 Median age for Asian residents35.3 41.8 -653,927,812.5 Median age for Native Hawaiian / Pacific Islander residents-664,509,168.7 -651,945,320.1 46.1 Median age for Other race residents39.4 53.0 25.9 Median age for Two or more races residents35.1 17.1 46.4 Median age for White alone residents43.1 48.5 39.9 Median age for Hispanic or Latino residents42.5 34.0
Owner/renter occupied households by race in Bryn Mawr-Skyway
House owners and renters - White residents 1,840 73.6% Owner occupied659 26.4% Renter occupiedHouse owners and renters - Black or African American residents 647 36.0% Owner occupied1,148 64.0% Renter occupiedHouse owners and renters - American Indian / Alaska Native residents 15 100.0% Owner occupiedHouse owners and renters - Asian residents 1,319 83.6% Owner occupied259 16.4% Renter occupiedHouse owners and renters - Other race residents 48 11.8% Owner occupied355 88.2% Renter occupiedHouse owners and renters - Two or more races residents 262 41.1% Owner occupied376 58.9% Renter occupiedHouse owners and renters - White alone residents 1,761 72.8% Owner occupied657 27.2% Renter occupiedHouse owners and renters - Hispanic or Latino residents 217 44.3% Owner occupied273 55.7% Renter occupied
Language usage in Bryn Mawr-Skyway
English speakers - Total 62.0% of residents of Bryn Mawr-Skyway speak English at home.
2.9% of residents speak Spanish at home 172 34.1% Speak English very well332 65.9% Speak English less than very well35.6% of residents speak other language at home 3,669 60.3% Speak English very well2,415 39.7% Speak English less than very well
English speakers - Born in the United States 89.4% of residents of Bryn Mawr-Skyway speak English at home.
5.1% of residents speak Spanish at home 66 29.3% Speak English very well159 70.7% Speak English less than very well6.5% of residents speak other language at home 267 92.1% Speak English very well23 7.9% Speak English less than very well
English speakers - Native, born elsewhere 58.6% of residents of Bryn Mawr-Skyway speak English at home.
41.6% of residents speak other language at home 228 84.8% Speak English very well41 15.2% Speak English less than very well
English speakers - Foreign-born 18.2% of residents of Bryn Mawr-Skyway speak English at home.
4.6% of residents speak Spanish at home 35 14.4% Speak English very well208 85.6% Speak English less than very well76.5% of residents speak other language at home 1,816 45.3% Speak English very well2,191 54.7% Speak English less than very well
White (Caucasian) - Speak only English Native:
95.5% (4,318)Foreign-born:
53.0% (213)
White (Caucasian) - Speak another language Native:
4.5% (206)Foreign-born:
46.2% (186)
Black or African American - Speak only English Native:
76.7% (3,209)Foreign-born:
10.2% (97)
Black or African American - Speak another language Native:
23.0% (961)Foreign-born:
88.9% (844)
Asian - Speak only English Native:
41.4% (591)Foreign-born:
15.6% (540)
Asian - Speak another language Native:
60.8% (868)Foreign-born:
84.5% (2,932)
Other race - Speak only English Native:
86.9% (386)Foreign-born:
22.8% (91)
Other race - Speak another language Native:
15.3% (68)Foreign-born:
72.2% (290)
Two or more races - Speak another language Native:
10.2% (169)Foreign-born:
100.0% (7)
White alone - Speak only English Native:
95.0% (4,249)Foreign-born:
49.0% (217)
White alone - Speak another language Native:
5.1% (228)Foreign-born:
48.2% (214)
Hispanic or Latino - Speak only English Native:
84.7% (606)Foreign-born:
35.8% (147)
Hispanic or Latino - Speak another language Native:
13.3% (95)Foreign-born:
60.4% (248)
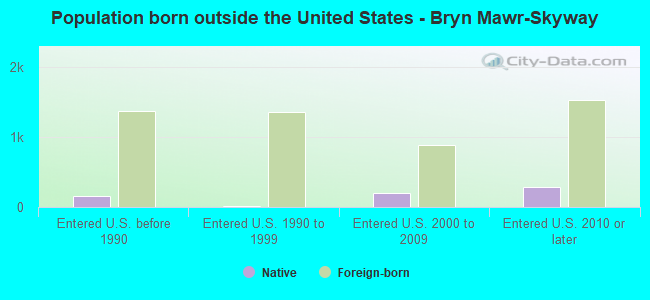
Foreign-born residents in Bryn Mawr-Skyway 5,286 residents are foreign born (18.5% Asia , 4.9% Africa ).
This city:
29.2%Washington:
14.9%
Marital status for residents in Bryn Mawr-Skyway Marital status - White (Caucasian) population 15 years and over
Males 32.3% Never married54.2% Now married0.0% Separated3.5% Widowed10.0% DivorcedFemales 27.8% Never married46.7% Now married0.0% Separated10.2% Widowed15.4% DivorcedWomen who gave birth in the past 12 months Now married:
100.0% (22)Unmarried:
0.0% (0)
Women who did not give birth in the past 12 months Now married:
52.7% (621)Unmarried:
47.3% (557)
Marital status - Black or African American population 15 years and over
Males 48.7% Never married35.0% Now married0.5% Separated6.3% Widowed9.5% DivorcedFemales 34.6% Never married30.7% Now married4.5% Separated10.3% Widowed19.9% DivorcedWomen who gave birth in the past 12 months Now married:
100.0% (165)Unmarried:
0.0% (0)
Women who did not give birth in the past 12 months Now married:
37.7% (437)Unmarried:
62.3% (723)
Marital status - Asian population 15 years and over
Males 36.0% Never married56.3% Now married4.1% Separated1.3% Widowed2.3% DivorcedFemales 18.0% Never married65.5% Now married1.6% Separated9.7% Widowed5.1% DivorcedWomen who gave birth in the past 12 months Now married:
100.0% (30)Unmarried:
0.0% (0)
Women who did not give birth in the past 12 months Now married:
71.1% (840)Unmarried:
28.9% (342)
Marital status - Other race population 15 years and over
Males 19.2% Never married55.4% Now married0.0% Separated0.0% Widowed25.4% DivorcedFemales 27.6% Never married25.1% Now married14.3% Separated22.3% Widowed10.7% DivorcedWomen who gave birth in the past 12 months Now married:
100.0% (21)Unmarried:
0.0% (0)
Women who did not give birth in the past 12 months Now married:
10.7% (22)Unmarried:
89.3% (185)
Marital status - Two or more races population 15 years and over
Males 40.6% Never married40.8% Now married0.0% Separated0.0% Widowed18.6% DivorcedFemales 53.8% Never married19.0% Now married2.3% Separated1.4% Widowed23.5% DivorcedWomen who did not give birth in the past 12 months Now married:
32.3% (134)Unmarried:
67.7% (280)
Marital status - White alone, not Hispanic / Latino population 15 years and over
Males 33.5% Never married52.7% Now married0.0% Separated3.4% Widowed10.4% DivorcedFemales 26.8% Never married47.3% Now married0.0% Separated10.3% Widowed15.6% DivorcedWomen who gave birth in the past 12 months Now married:
100.0% (23)Unmarried:
0.0% (0)
Women who did not give birth in the past 12 months Now married:
54.1% (640)Unmarried:
45.9% (543)
Marital status - Hispanic or Latino population 15 years and over
Males 17.4% Never married58.9% Now married0.0% Separated1.1% Widowed22.6% DivorcedFemales 35.1% Never married29.4% Now married19.1% Separated2.5% Widowed13.9% DivorcedWomen who gave birth in the past 12 months Now married:
100.0% (18)Unmarried:
0.0% (0)
Women who did not give birth in the past 12 months Now married:
9.1% (19)Unmarried:
90.9% (187)
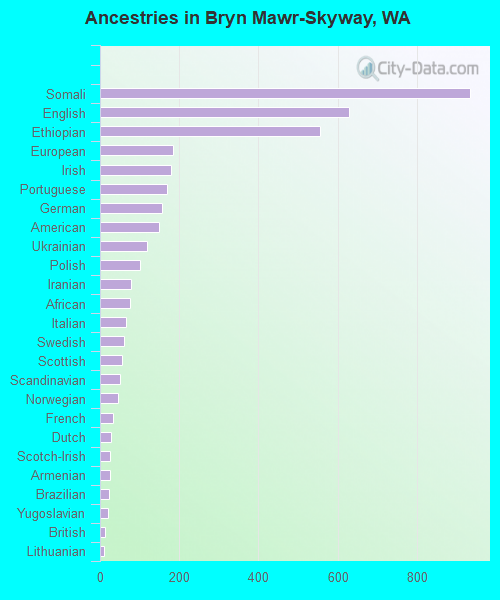
Ancestries in Bryn Mawr-Skyway
935 9.1% Somali629 6.1% English556 5.4% Ethiopian185 1.8% European179 1.7% Irish168 1.6% Portuguese156 1.5% German150 1.5% American119 1.2% Ukrainian100 1.0% Polish79 0.8% Iranian75 0.7% African66 0.6% Italian60 0.6% Swedish55 0.5% Scottish50 0.5% Scandinavian46 0.4% Norwegian32 0.3% French27 0.3% Dutch26 0.3% Scotch-Irish24 0.2% Armenian23 0.2% Brazilian19 0.2% Yugoslavian13 0.1% British11 0.1% Lithuanian10 0.10% Northern European8 0.08% Welsh
Geographical mobility in Bryn Mawr-Skyway Same house 1 year ago 4,613 90.5% White (Caucasian)4,980 93.5% Black or African American52 96.7% American Indian / Alaska Native4,570 90.2% Asian28 100.0% Native Hawaiian / Pacific Islander760 83.5% Other race1,648 88.3% Two or more races4,603 90.2% White alone, not Hispanic / Latino1,018 87.3% Hispanic or LatinoMoved within same county 369 7.2% White / Caucasian298 5.6% Black or African American194 3.8% Asian90 9.9% Other race155 8.3% Two or more races376 7.4% White alone, not Hispanic / Latino55 4.7% Hispanic or LatinoMoved within same state 18 0.4% White / Caucasian31 0.6% Asian56 6.1% Other race64 3.4% Two or more races19 0.4% White alone, not Hispanic / Latino108 9.3% Hispanic or LatinoMoved from different state 63 1.2% White / Caucasian133 2.6% Asian20 1.1% Two or more races64 1.3% White alone, not Hispanic / LatinoMoved from abroad 52 1.0% White150 2.8% Black or African American110 2.2% Asian51 1.0% White alone, not Hispanic / Latino4 0.4% Hispanic or Latino
Children Nativity (place of birth) in Bryn Mawr-Skyway
Children under 6 years - Living with two parents Both parents native 374 100.0% NativeBoth parents foreign-born 507 88.5% Native66 11.5% Foreign-bornOne native, one foreign-born parent 197 100.0% NativeChildren under 6 years - Living with one parent Native parent 236 100.0% NativeChildren 6 to 17 years - Living with two parents Both parents native 281 100.0% NativeBoth parents foreign-born 630 75.8% Native201 24.2% Foreign-bornOne native, one foreign-born parent 246 100.0% NativeChildren 6 to 17 years - Living with one parent Native parent 653 100.0% NativeForeign-born parent 225 50.9% Native218 49.1% Foreign-born
Grandparents responsible for own grandchildren in Bryn Mawr-Skyway
Grandparents (30 to 59 years) Black or African American 40 100.0% Responsible for grandchildrenAsian 16 100.0% Not responsible for grandchildrenTwo or more races 67 100.0% Not responsible for grandchildrenHispanic or Latino 8 100.0% Not responsible for grandchildrenGrandparents (60 years and over) Black or African American 15 11.3% Responsible for grandchildren120 88.7% Not responsible for grandchildrenAsian 73 26.1% Responsible for grandchildren206 73.9% Not responsible for grandchildrenTwo or more races 16 100.0% Not responsible for grandchildrenHispanic or Latino 13 100.0% Not responsible for grandchildren