Races in Buffalo Grove, Illinois (IL) Detailed Stats
Data:
Races - White alone (%)
Races - White alone (% change since 2000)
Races - Black alone (%)
Races - Black alone (% change since 2000)
Races - American Indian alone (%)
Races - American Indian alone (% change since 2000)
Races - Asian alone (%)
Races - Asian alone (% change since 2000)
Races - Hispanic (%)
Races - Hispanic (% change since 2000)
Races - Native Hawaiian and Other Pacific Islander alone (%)
Races - Native Hawaiian and Other Pacific Islander alone (% change since 2000)
Races - Two or more races(%)
Races - Two or more races(% change since 2000)
Races - Other race alone (%)
Races - Other race alone (% change since 2000)
Racial diversity
Place of birth - Born in state of residence (%)
Place of birth - Born in state of residence (%) - White
Place of birth - Born in state of residence (%) - Black or African American
Place of birth - Born in state of residence (%) - Asian
Place of birth - Born in state of residence (%) - Hispanic or Latino
Place of birth - Born in state of residence (%) - American Indian and Alaska Native
Place of birth - Born in state of residence (%) - Multirace
Place of birth - Born in state of residence (%) - Other Race
Place of birth - Born in other state (%)
Place of birth - Born in other state (%) - White
Place of birth - Born in other state (%) - Black or African American
Place of birth - Born in other state (%) - Asian
Place of birth - Born in other state (%) - Hispanic or Latino
Place of birth - Born in other state (%) - American Indian and Alaska Native
Place of birth - Born in other state (%) - Multirace
Place of birth - Born in other state (%) - Other Race
Place of birth - Native, outside of US (%)
Place of birth - Native, outside of US (%) - White
Place of birth - Native, outside of US (%) - Black or African American
Place of birth - Native, outside of US (%) - Asian
Place of birth - Native, outside of US (%) - Hispanic or Latino
Place of birth - Native, outside of US (%) - American Indian and Alaska Native
Place of birth - Native, outside of US (%) - Multirace
Place of birth - Native, outside of US (%) - Other Race
Place of birth - Foreign born (%)
Place of birth - Foreign born (%) - White
Place of birth - Foreign born (%) - Black or African American
Place of birth - Foreign born (%) - Asian
Place of birth - Foreign born (%) - Hispanic or Latino
Place of birth - Foreign born (%) - American Indian and Alaska Native
Place of birth - Foreign born (%) - Multirace
Place of birth - Foreign born (%) - Other Race
Residents speaking English at home (%)
Residents speaking English at home - Born in the United States (%)
Residents speaking English at home - Native, born elsewhere (%)
Residents speaking English at home - Foreign born (%)
Residents speaking Spanish at home (%)
Residents speaking Spanish at home - Born in the United States (%)
Residents speaking Spanish at home - Native, born elsewhere (%)
Residents speaking Spanish at home - Foreign born (%)
Residents speaking other language at home (%)
Residents speaking other language at home - Born in the United States (%)
Residents speaking other language at home - Native, born elsewhere (%)
Residents speaking other language at home - Foreign born (%)
Marital status - Never married (%)
Marital status - Now married (%)
Marital status - Separated (%)
Marital status - Widowed (%)
Marital status - Divorced (%)
Ancestries Reported - Arab (%)
Ancestries Reported - Czech (%)
Ancestries Reported - Danish (%)
Ancestries Reported - Dutch (%)
Ancestries Reported - English (%)
Ancestries Reported - French (%)
Ancestries Reported - French Canadian (%)
Ancestries Reported - German (%)
Ancestries Reported - Greek (%)
Ancestries Reported - Hungarian (%)
Ancestries Reported - Irish (%)
Ancestries Reported - Italian (%)
Ancestries Reported - Lithuanian (%)
Ancestries Reported - Norwegian (%)
Ancestries Reported - Polish (%)
Ancestries Reported - Portuguese (%)
Ancestries Reported - Russian (%)
Ancestries Reported - Scotch-Irish (%)
Ancestries Reported - Scottish (%)
Ancestries Reported - Slovak (%)
Ancestries Reported - Subsaharan African (%)
Ancestries Reported - Swedish (%)
Ancestries Reported - Swiss (%)
Ancestries Reported - Ukrainian (%)
Ancestries Reported - United States (%)
Ancestries Reported - Welsh (%)
Ancestries Reported - West Indian (%)
Ancestries Reported - Other (%)
Geographical mobility - Same house 1 year ago (%)
Geographical mobility - Same house 1 year ago (%) - White
Geographical mobility - Same house 1 year ago (%) - Black or African American
Geographical mobility - Same house 1 year ago (%) - Asian
Geographical mobility - Same house 1 year ago (%) - Hispanic or Latino
Geographical mobility - Same house 1 year ago (%) - American Indian and Alaska Native
Geographical mobility - Same house 1 year ago (%) - Multirace
Geographical mobility - Same house 1 year ago (%) - Other Race
Geographical mobility - Moved within same county (%)
Geographical mobility - Moved within same county (%) - White
Geographical mobility - Moved within same county (%) - Black or African American
Geographical mobility - Moved within same county (%) - Asian
Geographical mobility - Moved within same county (%) - Hispanic or Latino
Geographical mobility - Moved within same county (%) - American Indian and Alaska Native
Geographical mobility - Moved within same county (%) - Multirace
Geographical mobility - Moved within same county (%) - Other Race
Geographical mobility - Moved from different county within same state (%)
Geographical mobility - Moved from different county within same state (%) - White
Geographical mobility - Moved from different county within same state (%) - Black or African American
Geographical mobility - Moved from different county within same state (%) - Asian
Geographical mobility - Moved from different county within same state (%) - Hispanic or Latino
Geographical mobility - Moved from different county within same state (%) - American Indian and Alaska Native
Geographical mobility - Moved from different county within same state (%) - Multirace
Geographical mobility - Moved from different county within same state (%) - Other Race
Geographical mobility - Moved from different state (%)
Geographical mobility - Moved from different state (%) - White
Geographical mobility - Moved from different state (%) - Black or African American
Geographical mobility - Moved from different state (%) - Asian
Geographical mobility - Moved from different state (%) - Hispanic or Latino
Geographical mobility - Moved from different state (%) - American Indian and Alaska Native
Geographical mobility - Moved from different state (%) - Multirace
Geographical mobility - Moved from different state (%) - Other Race
Geographical mobility - Moved from abroad (%)
Geographical mobility - Moved from abroad (%) - White
Geographical mobility - Moved from abroad (%) - Black or African American
Geographical mobility - Moved from abroad (%) - Asian
Geographical mobility - Moved from abroad (%) - Hispanic or Latino
Geographical mobility - Moved from abroad (%) - American Indian and Alaska Native
Geographical mobility - Moved from abroad (%) - Multirace
Geographical mobility - Moved from abroad (%) - Other Race
Place of birth for the foreign-born population - Ireland (%)
Place of birth for the foreign-born population - Denmark (%)
Place of birth for the foreign-born population - Norway (%)
Place of birth for the foreign-born population - Sweden (%)
Place of birth for the foreign-born population - United Kingdom (%)
Place of birth for the foreign-born population - England (%)
Place of birth for the foreign-born population - Scotland (%)
Place of birth for the foreign-born population - Other Northern Europe (%)
Place of birth for the foreign-born population - Austria (%)
Place of birth for the foreign-born population - Belgium (%)
Place of birth for the foreign-born population - France (%)
Place of birth for the foreign-born population - Germany (%)
Place of birth for the foreign-born population - Netherlands (%)
Place of birth for the foreign-born population - Switzerland (%)
Place of birth for the foreign-born population - Other Western Europe (%)
Place of birth for the foreign-born population - Greece (%)
Place of birth for the foreign-born population - Italy (%)
Place of birth for the foreign-born population - Portugal (%)
Place of birth for the foreign-born population - Spain (%)
Place of birth for the foreign-born population - Other Southern Europe (%)
Place of birth for the foreign-born population - Albania (%)
Place of birth for the foreign-born population - Belarus (%)
Place of birth for the foreign-born population - Bosnia and Herzegovina (%)
Place of birth for the foreign-born population - Bulgaria (%)
Place of birth for the foreign-born population - Croatia (%)
Place of birth for the foreign-born population - Czechoslovakia (%)
Place of birth for the foreign-born population - Hungary (%)
Place of birth for the foreign-born population - Latvia (%)
Place of birth for the foreign-born population - Lithuania (%)
Place of birth for the foreign-born population - North Macedonia (Macedonia) (%)
Place of birth for the foreign-born population - Moldova (%)
Place of birth for the foreign-born population - Poland (%)
Place of birth for the foreign-born population - Romania (%)
Place of birth for the foreign-born population - Russia (%)
Place of birth for the foreign-born population - Serbia (%)
Place of birth for the foreign-born population - Ukraine (%)
Place of birth for the foreign-born population - Other Eastern Europe (%)
Place of birth for the foreign-born population - China (%)
Place of birth for the foreign-born population - Hong Kong (%)
Place of birth for the foreign-born population - Taiwan (%)
Place of birth for the foreign-born population - Japan (%)
Place of birth for the foreign-born population - Korea (%)
Place of birth for the foreign-born population - Other Eastern Asia (%)
Place of birth for the foreign-born population - Afghanistan (%)
Place of birth for the foreign-born population - Bangladesh (%)
Place of birth for the foreign-born population - India (%)
Place of birth for the foreign-born population - Iran (%)
Place of birth for the foreign-born population - Kazakhstan (%)
Place of birth for the foreign-born population - Nepal (%)
Place of birth for the foreign-born population - Pakistan (%)
Place of birth for the foreign-born population - Sri Lanka (%)
Place of birth for the foreign-born population - Uzbekistan (%)
Place of birth for the foreign-born population - Other South Central Asia (%)
Place of birth for the foreign-born population - Burma (%)
Place of birth for the foreign-born population - Cambodia (%)
Place of birth for the foreign-born population - Indonesia (%)
Place of birth for the foreign-born population - Laos (%)
Place of birth for the foreign-born population - Malaysia (%)
Place of birth for the foreign-born population - Philippines (%)
Place of birth for the foreign-born population - Singapore (%)
Place of birth for the foreign-born population - Thailand (%)
Place of birth for the foreign-born population - Vietnam (%)
Place of birth for the foreign-born population - Other South Eastern Asia (%)
Place of birth for the foreign-born population - Armenia (%)
Place of birth for the foreign-born population - Iraq (%)
Place of birth for the foreign-born population - Israel (%)
Place of birth for the foreign-born population - Jordan (%)
Place of birth for the foreign-born population - Kuwait (%)
Place of birth for the foreign-born population - Lebanon (%)
Place of birth for the foreign-born population - Saudi Arabia (%)
Place of birth for the foreign-born population - Syria (%)
Place of birth for the foreign-born population - Turkey (%)
Place of birth for the foreign-born population - Yemen (%)
Place of birth for the foreign-born population - Other Western Asia (%)
Place of birth for the foreign-born population - Eritrea (%)
Place of birth for the foreign-born population - Ethiopia (%)
Place of birth for the foreign-born population - Kenya (%)
Place of birth for the foreign-born population - Somalia (%)
Place of birth for the foreign-born population - Uganda (%)
Place of birth for the foreign-born population - Zimbabwe (%)
Place of birth for the foreign-born population - Other Eastern Africa (%)
Place of birth for the foreign-born population - Cameroon (%)
Place of birth for the foreign-born population - Congo (%)
Place of birth for the foreign-born population - Democratic Republic of Congo (Zaire) (%)
Place of birth for the foreign-born population - Other Middle Africa (%)
Place of birth for the foreign-born population - Egypt (%)
Place of birth for the foreign-born population - Morocco (%)
Place of birth for the foreign-born population - Sudan (%)
Place of birth for the foreign-born population - Other Northern Africa (%)
Place of birth for the foreign-born population - South Africa (%)
Place of birth for the foreign-born population - Other Southern Africa (%)
Place of birth for the foreign-born population - Cabo Verde (%)
Place of birth for the foreign-born population - Ghana (%)
Place of birth for the foreign-born population - Liberia (%)
Place of birth for the foreign-born population - Nigeria (%)
Place of birth for the foreign-born population - Senegal (%)
Place of birth for the foreign-born population - Sierra Leone (%)
Place of birth for the foreign-born population - Other Western Africa (%)
Place of birth for the foreign-born population - Australia (%)
Place of birth for the foreign-born population - New Zealand (%)
Place of birth for the foreign-born population - Fiji (%)
Place of birth for the foreign-born population - Micronesia (%)
Place of birth for the foreign-born population - Bahamas (%)
Place of birth for the foreign-born population - Barbados (%)
Place of birth for the foreign-born population - Cuba (%)
Place of birth for the foreign-born population - Dominica (%)
Place of birth for the foreign-born population - Dominican Republic (%)
Place of birth for the foreign-born population - Grenada (%)
Place of birth for the foreign-born population - Haiti (%)
Place of birth for the foreign-born population - Jamaica (%)
Place of birth for the foreign-born population - St. Vincent and the Grenadines (%)
Place of birth for the foreign-born population - Trinidad and Tobago (%)
Place of birth for the foreign-born population - West Indies (%)
Place of birth for the foreign-born population - Other Caribbean (%)
Place of birth for the foreign-born population - Belize (%)
Place of birth for the foreign-born population - Costa Rica (%)
Place of birth for the foreign-born population - El Salvador (%)
Place of birth for the foreign-born population - Guatemala (%)
Place of birth for the foreign-born population - Honduras (%)
Place of birth for the foreign-born population - Mexico (%)
Place of birth for the foreign-born population - Nicaragua (%)
Place of birth for the foreign-born population - Panama (%)
Place of birth for the foreign-born population - Other Central America (%)
Place of birth for the foreign-born population - Argentina (%)
Place of birth for the foreign-born population - Bolivia (%)
Place of birth for the foreign-born population - Brazil (%)
Place of birth for the foreign-born population - Chile (%)
Place of birth for the foreign-born population - Colombia (%)
Place of birth for the foreign-born population - Ecuador (%)
Place of birth for the foreign-born population - Guyana (%)
Place of birth for the foreign-born population - Peru (%)
Place of birth for the foreign-born population - Uruguay (%)
Place of birth for the foreign-born population - Venezuela (%)
Place of birth for the foreign-born population - Other South America (%)
Place of birth for the foreign-born population - Canada (%)
Place of birth for the foreign-born population - Other Northern America (%)
Place of birth for the foreign-born population - Other (%)
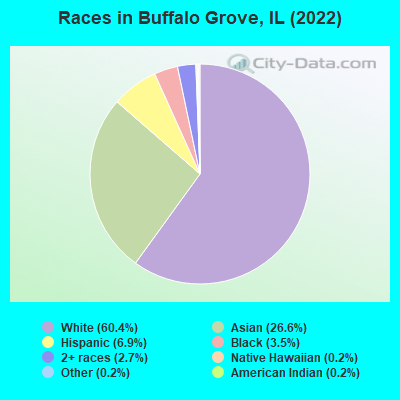
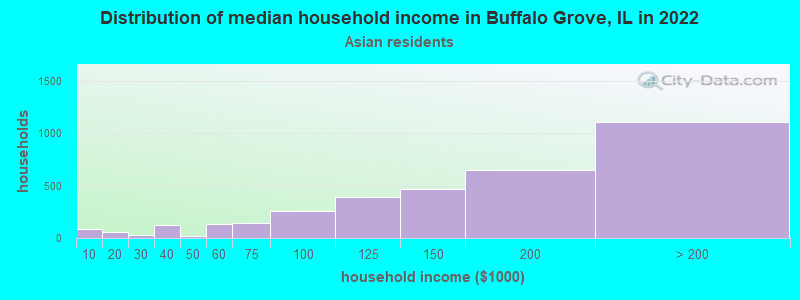
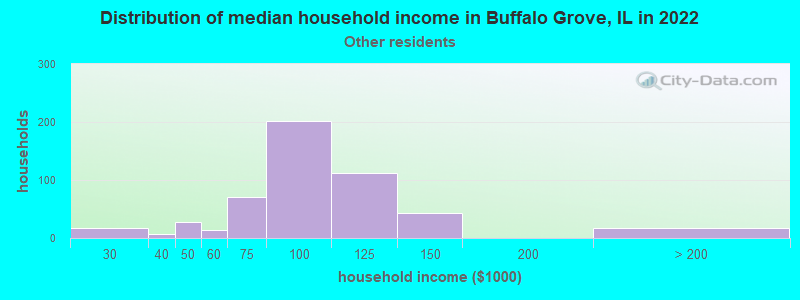
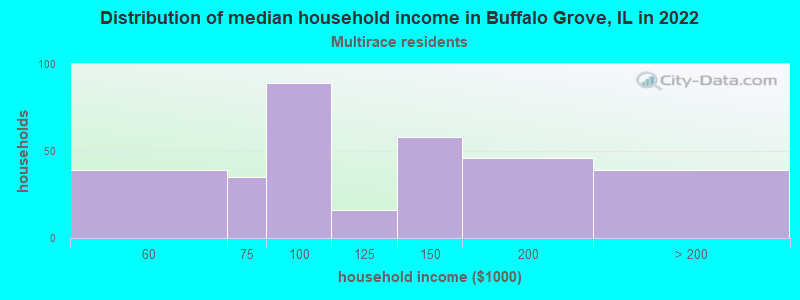
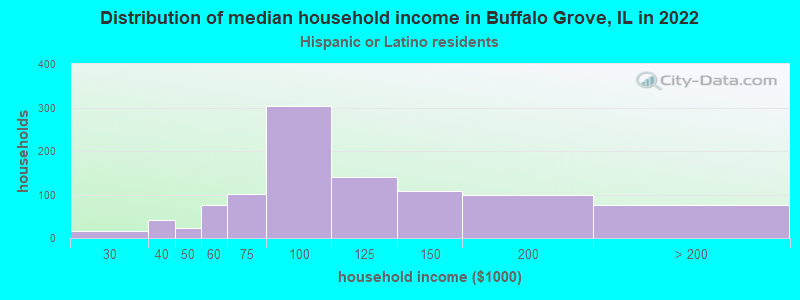
According to 2022 data, the most numerous races in Buffalo Grove, IL are White alone (25,336 residents), Hispanic (2,911 residents), and Black alone (1,463 residents). 54.8% of Buffalo Grove residents speak English at home. 36.4% of Buffalo Grove, IL residents are foreign-born (18.5% born in Asia, 13.5% born in Europe), which is 61.5% greater than the foreign-born rate of 14.0% across the entire state of Illinois.
Race distribution in Buffalo Grove
2000 2022
8,424,140 67.8% White alone 1,856,152 14.9% Black alone 1,530,262 12.3% Hispanic 419,916 3.4% Asian alone 153,996 1.2% Two or more races 13,479 0.1% Other race alone 18,232 0.1% American Indian alone 3,116 0.03% Native Hawaiian and Other
7,356,301 58.5% White alone 2,299,726 18.3% Hispanic 1,660,423 13.2% Black alone 747,296 5.9% Asian alone 458,599 3.6% Two or more races 45,386 0.4% Other race alone 10,405 0.08% American Indian alone 3,896 0.03% Native Hawaiian and Other
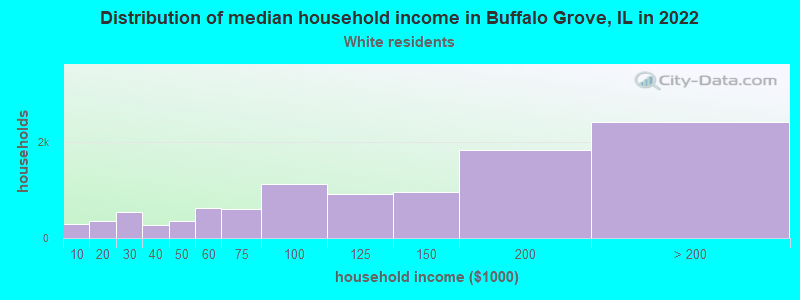
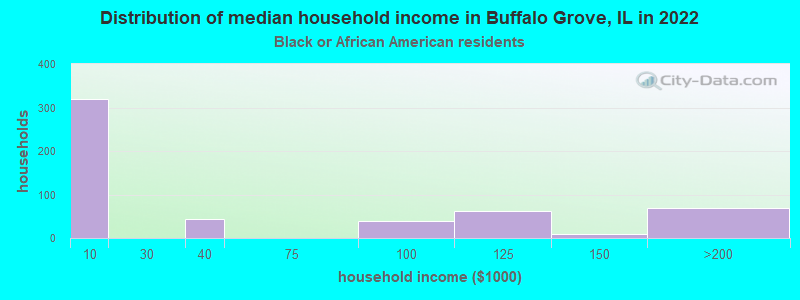
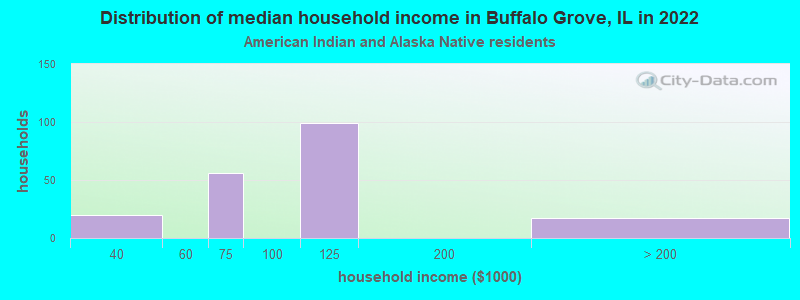
Income and house value in Buffalo Grove Median household income in 2022 $123,112 White non-Hispanic householders$2,429 Black householders$110,520 American Indian and Alaska Native householders$139,439 Asian householders$103,089 Some other race householders$97,191 Two or more races householders$102,156 Hispanic or Latino race householdersMedian 2022 house value $428,529 White Non-Hispanic householders$354,469 Black or African American householders$978,066 American Indian or Alaska Native householders $463,285 Asian householders$312,071 Some other race householders$332,087 Two or more races householders$376,851 Hispanic or Latino householders
Median age by race in Buffalo Grove
48.3 Median age for White residents48.0 48.5 24.6 Median age for Black or African American residents13.2 42.1 31.3 Median age for American Indian / Alaska Native residents28.7 29.6 38.0 Median age for Asian residents39.7 37.4 -687,999,999.3 Median age for Native Hawaiian / Pacific Islander residents-918,721,460.3 -610,229,276.3 33.9 Median age for Other race residents33.8 50.8 16.3 Median age for Two or more races residents13.7 21.4 47.8 Median age for White alone residents47.9 47.5 32.5 Median age for Hispanic or Latino residents31.8 35.1
Owner/renter occupied households by race in Buffalo Grove
House owners and renters - White residents 9,146 88.1% Owner occupied1,231 11.9% Renter occupiedHouse owners and renters - Black or African American residents 124 24.5% Owner occupied381 75.5% Renter occupiedHouse owners and renters - American Indian / Alaska Native residents 105 56.7% Owner occupied80 43.3% Renter occupiedHouse owners and renters - Asian residents 2,895 80.2% Owner occupied716 19.8% Renter occupiedHouse owners and renters - Native Hawaiian / Pacific Islander residents 28 100.0% Owner occupiedHouse owners and renters - Other race residents 390 78.2% Owner occupied109 21.8% Renter occupiedHouse owners and renters - Two or more races residents 241 71.4% Owner occupied97 28.6% Renter occupiedHouse owners and renters - White alone residents 9,357 87.8% Owner occupied1,297 12.2% Renter occupiedHouse owners and renters - Hispanic or Latino residents 800 81.7% Owner occupied179 18.3% Renter occupied
Language usage in Buffalo Grove
English speakers - Total 54.8% of residents of Buffalo Grove speak English at home.
6.1% of residents speak Spanish at home 1,663 68.5% Speak English very well763 31.5% Speak English less than very well39.8% of residents speak other language at home 10,982 69.4% Speak English very well4,844 30.6% Speak English less than very well
English speakers - Born in the United States 86.0% of residents of Buffalo Grove speak English at home.
2.0% of residents speak Spanish at home 100 86.2% Speak English very well16 13.8% Speak English less than very well13.0% of residents speak other language at home 645 84.9% Speak English very well115 15.1% Speak English less than very well
English speakers - Native, born elsewhere 49.8% of residents of Buffalo Grove speak English at home.
50.7% of residents speak other language at home 73 65.8% Speak English very well38 34.2% Speak English less than very well
English speakers - Foreign-born 9.8% of residents of Buffalo Grove speak English at home.
7.9% of residents speak Spanish at home 521 43.6% Speak English very well673 56.4% Speak English less than very well82.0% of residents speak other language at home 7,872 63.5% Speak English very well4,519 36.5% Speak English less than very well
White (Caucasian) - Speak only English Native:
91.4% (16,426)Foreign-born:
12.4% (624)
White (Caucasian) - Speak another language Native:
9.3% (1,677)Foreign-born:
87.4% (4,389)
Black or African American - Speak only English Native:
98.1% (1,210)Foreign-born:
91.3% (162)
Black or African American - Speak another language Native:
1.9% (23)Foreign-born:
21.4% (38)
American Indian / Alaska Native - Speak only English Native:
20.2% (64)Foreign-born:
1.9% (6)
American Indian / Alaska Native - Speak another language Native:
84.0% (266)Foreign-born:
99.3% (290)
Asian - Speak only English Native:
48.0% (1,331)Foreign-born:
7.7% (569)
Asian - Speak another language Native:
52.0% (1,441)Foreign-born:
92.9% (6,901)
Native Hawaiian / Pacific Islander - Speak another language Native:
69.9% (26)Foreign-born:
100.0% (91)
Other race - Speak only English Native:
20.5% (76)Foreign-born:
2.6% (13)
Other race - Speak another language Native:
79.1% (294)Foreign-born:
97.6% (461)
Two or more races - Speak only English Native:
78.9% (792)Foreign-born:
3.7% (20)
Two or more races - Speak another language Native:
18.6% (187)Foreign-born:
96.3% (526)
White alone - Speak only English Native:
89.4% (16,487)Foreign-born:
11.1% (681)
White alone - Speak another language Native:
10.8% (1,995)Foreign-born:
89.3% (5,466)
Hispanic or Latino - Speak only English Native:
32.2% (488)Foreign-born:
2.0% (24)
Hispanic or Latino - Speak another language Native:
67.7% (1,025)Foreign-born:
98.3% (1,199)
Foreign-born residents in Buffalo Grove 15,282 residents are foreign born (18.5% Asia , 13.5% Europe ).
This city:
36.4%Illinois:
14.1%
Marital status for residents in Buffalo Grove Marital status - White (Caucasian) population 15 years and over
Males 27.3% Never married63.6% Now married0.6% Separated2.4% Widowed6.0% DivorcedFemales 21.6% Never married58.0% Now married1.7% Separated7.0% Widowed11.6% DivorcedWomen who gave birth in the past 12 months Now married:
92.2% (170)Unmarried:
7.8% (14)
Women who did not give birth in the past 12 months Now married:
56.0% (2,682)Unmarried:
44.0% (2,104)
Marital status - Black or African American population 15 years and over
Males 54.8% Never married41.9% Now married0.3% Separated0.0% Widowed3.0% DivorcedFemales 72.0% Never married17.1% Now married0.0% Separated4.8% Widowed6.1% DivorcedWomen who did not give birth in the past 12 months Now married:
11.4% (72)Unmarried:
88.6% (555)
Marital status - American Indian / Alaska Native population 15 years and over
Males 73.8% Never married26.2% Now married0.0% Separated0.0% Widowed0.0% DivorcedFemales 57.5% Never married35.3% Now married0.0% Separated7.2% Widowed0.0% DivorcedWomen who gave birth in the past 12 months Now married:
0.0% (0)Unmarried:
100.0% (58)
Women who did not give birth in the past 12 months Now married:
0.0% (0)Unmarried:
100.0% (116)
Marital status - Asian population 15 years and over
Males 16.2% Never married83.3% Now married0.1% Separated0.4% Widowed0.0% DivorcedFemales 15.9% Never married78.2% Now married0.8% Separated2.7% Widowed2.3% DivorcedWomen who gave birth in the past 12 months Now married:
100.0% (157)Unmarried:
0.0% (0)
Women who did not give birth in the past 12 months Now married:
76.8% (2,124)Unmarried:
23.2% (642)
Marital status - Native Hawaiian / Pacific Islander population 15 years and over
Males 0.0% Never married100.0% Now married0.0% Separated0.0% Widowed0.0% DivorcedFemales 0.0% Never married100.0% Now married0.0% Separated0.0% Widowed0.0% DivorcedWomen who did not give birth in the past 12 months Now married:
100.0% (83)Unmarried:
0.0% (0)
Marital status - Other race population 15 years and over
Males 26.9% Never married50.6% Now married7.1% Separated0.0% Widowed15.4% DivorcedFemales 65.3% Never married21.2% Now married2.0% Separated3.7% Widowed7.9% DivorcedWomen who did not give birth in the past 12 months Now married:
44.9% (75)Unmarried:
55.1% (91)
Marital status - Two or more races population 15 years and over
Males 44.8% Never married50.0% Now married0.0% Separated0.0% Widowed5.2% DivorcedFemales 24.3% Never married58.3% Now married0.5% Separated0.0% Widowed17.0% DivorcedWomen who gave birth in the past 12 months Now married:
43.8% (10)Unmarried:
56.2% (12)
Women who did not give birth in the past 12 months Now married:
60.1% (272)Unmarried:
39.9% (180)
Marital status - White alone, not Hispanic / Latino population 15 years and over
Males 27.1% Never married63.9% Now married0.2% Separated2.6% Widowed6.2% DivorcedFemales 21.7% Never married57.9% Now married1.7% Separated7.3% Widowed11.4% DivorcedWomen who gave birth in the past 12 months Now married:
95.1% (187)Unmarried:
4.9% (10)
Women who did not give birth in the past 12 months Now married:
56.2% (2,884)Unmarried:
43.8% (2,251)
Marital status - Hispanic or Latino population 15 years and over
Males 39.7% Never married49.2% Now married6.2% Separated0.0% Widowed4.8% DivorcedFemales 36.1% Never married47.0% Now married1.4% Separated2.3% Widowed13.4% DivorcedWomen who gave birth in the past 12 months Now married:
42.9% (12)Unmarried:
57.1% (16)
Women who did not give birth in the past 12 months Now married:
52.8% (295)Unmarried:
47.2% (264)
Ancestries in Buffalo Grove
1,906 7.5% Ukrainian1,377 5.4% American1,207 4.7% Polish969 3.8% Russian857 3.4% German579 2.3% Bulgarian532 2.1% Italian490 1.9% Irish472 1.9% Eastern European255 1.0% Romanian246 1.0% European235 0.9% English109 0.4% Latvian106 0.4% Assyrian91 0.4% Jamaican66 0.3% Greek59 0.2% Haitian52 0.2% Serbian51 0.2% French49 0.2% British48 0.2% Scottish39 0.2% Swedish38 0.1% Soviet Union38 0.1% Belgian38 0.1% Czech38 0.1% French Canadian34 0.1% African34 0.1% Lithuanian33 0.1% Moroccan29 0.1% Scotch-Irish28 0.1% Slovene22 0.09% Egyptian21 0.08% Norwegian21 0.08% Brazilian21 0.08% Austrian19 0.07% Hungarian17 0.07% Scandinavian17 0.07% Belizean14 0.06% Arab14 0.06% Dutch14 0.06% Danish13 0.05% Iraqi10 0.04% Northern European9 0.04% Canadian9 0.04% Iranian7 0.03% Armenian6 0.02% Yugoslavian5 0.02% Slovak3 0.01% Lebanese
Geographical mobility in Buffalo Grove Same house 1 year ago 21,632 90.6% White (Caucasian)1,315 89.8% Black or African American390 63.7% American Indian / Alaska Native9,316 84.7% Asian59 63.9% Native Hawaiian / Pacific Islander854 96.8% Other race1,670 88.4% Two or more races22,810 90.6% White alone, not Hispanic / Latino2,662 92.2% Hispanic or LatinoMoved within same county 944 4.0% White / Caucasian16 1.1% Black or African American61 10.0% American Indian / Alaska Native408 3.7% Asian5 0.5% Other race11 0.6% Two or more races1,023 4.1% White alone, not Hispanic / Latino55 1.9% Hispanic or LatinoMoved within same state 572 2.4% White / Caucasian176 12.0% Black or African American171 27.9% American Indian / Alaska Native532 4.8% Asian36 38.5% Native Hawaiian / Pacific Islander46 5.2% Other race86 4.6% Two or more races580 2.3% White alone, not Hispanic / Latino147 5.1% Hispanic or LatinoMoved from different state 213 0.9% White / Caucasian15 1.1% Black or African American355 3.2% Asian62 3.3% Two or more races219 0.9% White alone, not Hispanic / Latino47 1.6% Hispanic or LatinoMoved from abroad 457 1.9% White19 1.3% Black or African American318 2.9% Asian57 3.0% Two or more races499 2.0% White alone, not Hispanic / Latino
Children Nativity (place of birth) in Buffalo Grove
Children under 6 years - Living with two parents Both parents native 824 100.0% NativeBoth parents foreign-born 1,041 92.7% Native82 7.3% Foreign-bornOne native, one foreign-born parent 246 100.0% NativeChildren under 6 years - Living with one parent Native parent 144 100.0% NativeForeign-born parent 92 36.6% Native159 63.4% Foreign-bornChildren 6 to 17 years - Living with two parents Both parents native 1,819 100.0% NativeBoth parents foreign-born 2,278 75.5% Native740 24.5% Foreign-bornOne native, one foreign-born parent 602 97.8% Native13 2.2% Foreign-bornChildren 6 to 17 years - Living with one parent Native parent 1,074 100.0% NativeForeign-born parent 549 52.0% Native506 48.0% Foreign-born
Place of birth for residents in Buffalo Grove 7,881 Asia5,775 Europe5,322 Eastern Europe4,495 South Central Asia2,517 Eastern Asia1,478 Americas1,449 Latin America997 Central America968 China523 South Eastern Asia345 South America315 Western Asia175 Southern Europe147 Africa138 Northern Europe138 Western Europe106 Caribbean46 Middle Africa44 Northern Africa28 Northern America27 Eastern Africa27 Southern Africa4,142 India2,385 Ukraine1,288 Korea908 China830 Mexico821 Belarus593 Russia521 Poland428 Bulgaria410 Philippines237 Japan152 Italy143 Romania137 Colombia125 Peru95 El Salvador92 Israel85 Nepal84 Germany84 Jamaica79 Uzbekistan63 Iran61 Lithuania59 Pakistan58 Georgia58 Brazil51 Latvia49 Moldova47 France46 Cameroon42 Sri Lanka39 Azerbaijan38 Hong Kong38 Malaysia35 Belize32 Croatia30 Guatemala28 Canada28 Egypt28 Iraq27 South Africa27 Thailand27 Turkey26 England25 Vietnam25 Ireland23 Greece23 United Kingdom22 Armenia20 Taiwan19 Saudi Arabia15 Morocco15 Venezuela14 Uganda12 Sweden12 Tanzania12 Cuba12 Scotland11 Singapore8 Norway8 Haiti8 Burma (Myanmar)8 Uruguay7 Lebanon7 Syria7 Denmark5 Kazakhstan5 Netherlands4 Panama
Grandparents responsible for own grandchildren in Buffalo Grove
Grandparents (30 to 59 years) White / Caucasian 21 25.8% Responsible for grandchildren60 74.2% Not responsible for grandchildrenWhite alone, not Hispanic / Latino 28 87.1% Responsible for grandchildren4 12.9% Not responsible for grandchildrenHispanic or Latino 87 100.0% Not responsible for grandchildrenGrandparents (60 years and over) White / Caucasian 35 15.9% Responsible for grandchildren188 84.1% Not responsible for grandchildrenWhite alone, not Hispanic / Latino 43 19.9% Responsible for grandchildren174 80.1% Not responsible for grandchildrenHispanic or Latino 51 100.0% Not responsible for grandchildren