Races in Burlington, Kentucky (KY) Detailed Stats
Data:
Races - White alone (%)
Races - White alone (% change since 2000)
Races - Black alone (%)
Races - Black alone (% change since 2000)
Races - American Indian alone (%)
Races - American Indian alone (% change since 2000)
Races - Asian alone (%)
Races - Asian alone (% change since 2000)
Races - Hispanic (%)
Races - Hispanic (% change since 2000)
Races - Native Hawaiian and Other Pacific Islander alone (%)
Races - Native Hawaiian and Other Pacific Islander alone (% change since 2000)
Races - Two or more races(%)
Races - Two or more races(% change since 2000)
Races - Other race alone (%)
Races - Other race alone (% change since 2000)
Racial diversity
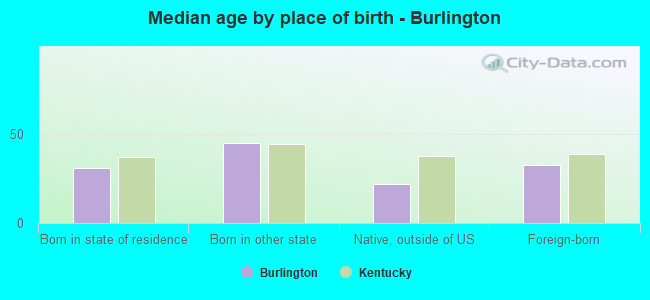
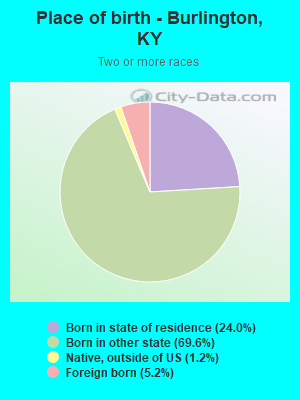
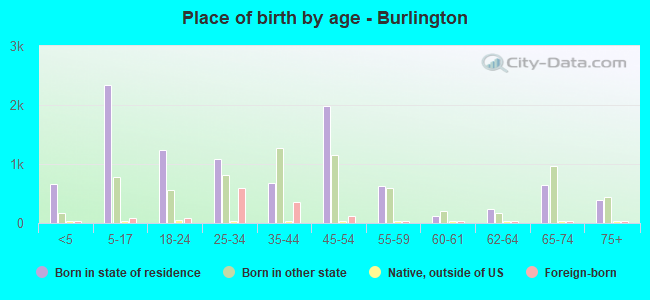
Place of birth - Born in state of residence (%)
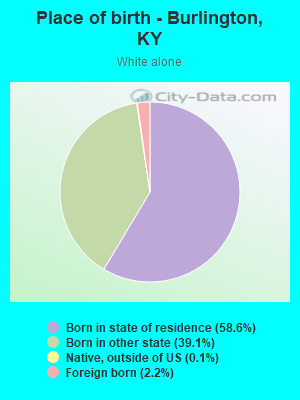
Place of birth - Born in state of residence (%) - White
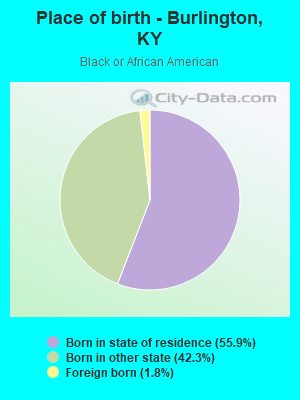
Place of birth - Born in state of residence (%) - Black or African American
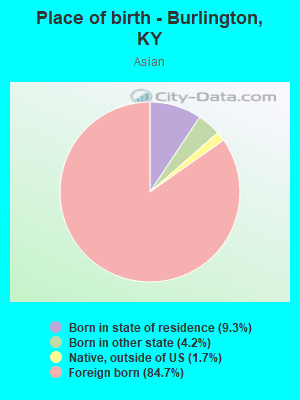
Place of birth - Born in state of residence (%) - Asian
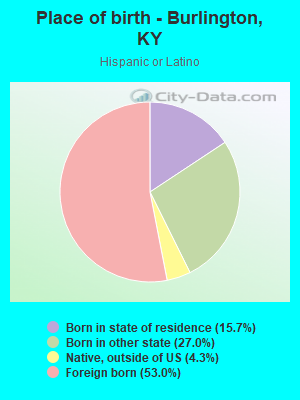
Place of birth - Born in state of residence (%) - Hispanic or Latino
Place of birth - Born in state of residence (%) - American Indian and Alaska Native
Place of birth - Born in state of residence (%) - Multirace
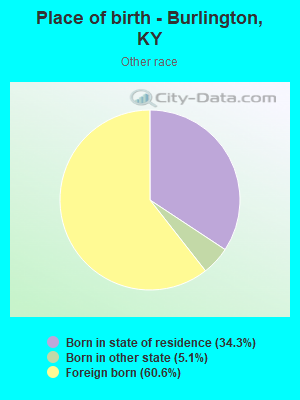
Place of birth - Born in state of residence (%) - Other Race
Place of birth - Born in other state (%)
Place of birth - Born in other state (%) - White
Place of birth - Born in other state (%) - Black or African American
Place of birth - Born in other state (%) - Asian
Place of birth - Born in other state (%) - Hispanic or Latino
Place of birth - Born in other state (%) - American Indian and Alaska Native
Place of birth - Born in other state (%) - Multirace
Place of birth - Born in other state (%) - Other Race
Place of birth - Native, outside of US (%)
Place of birth - Native, outside of US (%) - White
Place of birth - Native, outside of US (%) - Black or African American
Place of birth - Native, outside of US (%) - Asian
Place of birth - Native, outside of US (%) - Hispanic or Latino
Place of birth - Native, outside of US (%) - American Indian and Alaska Native
Place of birth - Native, outside of US (%) - Multirace
Place of birth - Native, outside of US (%) - Other Race
Place of birth - Foreign born (%)
Place of birth - Foreign born (%) - White
Place of birth - Foreign born (%) - Black or African American
Place of birth - Foreign born (%) - Asian
Place of birth - Foreign born (%) - Hispanic or Latino
Place of birth - Foreign born (%) - American Indian and Alaska Native
Place of birth - Foreign born (%) - Multirace
Place of birth - Foreign born (%) - Other Race
Residents speaking English at home (%)
Residents speaking English at home - Born in the United States (%)
Residents speaking English at home - Native, born elsewhere (%)
Residents speaking English at home - Foreign born (%)
Residents speaking Spanish at home (%)
Residents speaking Spanish at home - Born in the United States (%)
Residents speaking Spanish at home - Native, born elsewhere (%)
Residents speaking Spanish at home - Foreign born (%)
Residents speaking other language at home (%)
Residents speaking other language at home - Born in the United States (%)
Residents speaking other language at home - Native, born elsewhere (%)
Residents speaking other language at home - Foreign born (%)
Marital status - Never married (%)
Marital status - Now married (%)
Marital status - Separated (%)
Marital status - Widowed (%)
Marital status - Divorced (%)
Ancestries Reported - Arab (%)
Ancestries Reported - Czech (%)
Ancestries Reported - Danish (%)
Ancestries Reported - Dutch (%)
Ancestries Reported - English (%)
Ancestries Reported - French (%)
Ancestries Reported - French Canadian (%)
Ancestries Reported - German (%)
Ancestries Reported - Greek (%)
Ancestries Reported - Hungarian (%)
Ancestries Reported - Irish (%)
Ancestries Reported - Italian (%)
Ancestries Reported - Lithuanian (%)
Ancestries Reported - Norwegian (%)
Ancestries Reported - Polish (%)
Ancestries Reported - Portuguese (%)
Ancestries Reported - Russian (%)
Ancestries Reported - Scotch-Irish (%)
Ancestries Reported - Scottish (%)
Ancestries Reported - Slovak (%)
Ancestries Reported - Subsaharan African (%)
Ancestries Reported - Swedish (%)
Ancestries Reported - Swiss (%)
Ancestries Reported - Ukrainian (%)
Ancestries Reported - United States (%)
Ancestries Reported - Welsh (%)
Ancestries Reported - West Indian (%)
Ancestries Reported - Other (%)
Geographical mobility - Same house 1 year ago (%)
Geographical mobility - Same house 1 year ago (%) - White
Geographical mobility - Same house 1 year ago (%) - Black or African American
Geographical mobility - Same house 1 year ago (%) - Asian
Geographical mobility - Same house 1 year ago (%) - Hispanic or Latino
Geographical mobility - Same house 1 year ago (%) - American Indian and Alaska Native
Geographical mobility - Same house 1 year ago (%) - Multirace
Geographical mobility - Same house 1 year ago (%) - Other Race
Geographical mobility - Moved within same county (%)
Geographical mobility - Moved within same county (%) - White
Geographical mobility - Moved within same county (%) - Black or African American
Geographical mobility - Moved within same county (%) - Asian
Geographical mobility - Moved within same county (%) - Hispanic or Latino
Geographical mobility - Moved within same county (%) - American Indian and Alaska Native
Geographical mobility - Moved within same county (%) - Multirace
Geographical mobility - Moved within same county (%) - Other Race
Geographical mobility - Moved from different county within same state (%)
Geographical mobility - Moved from different county within same state (%) - White
Geographical mobility - Moved from different county within same state (%) - Black or African American
Geographical mobility - Moved from different county within same state (%) - Asian
Geographical mobility - Moved from different county within same state (%) - Hispanic or Latino
Geographical mobility - Moved from different county within same state (%) - American Indian and Alaska Native
Geographical mobility - Moved from different county within same state (%) - Multirace
Geographical mobility - Moved from different county within same state (%) - Other Race
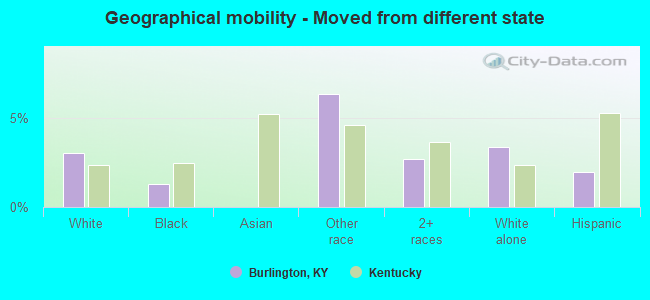
Geographical mobility - Moved from different state (%)
Geographical mobility - Moved from different state (%) - White
Geographical mobility - Moved from different state (%) - Black or African American
Geographical mobility - Moved from different state (%) - Asian
Geographical mobility - Moved from different state (%) - Hispanic or Latino
Geographical mobility - Moved from different state (%) - American Indian and Alaska Native
Geographical mobility - Moved from different state (%) - Multirace
Geographical mobility - Moved from different state (%) - Other Race
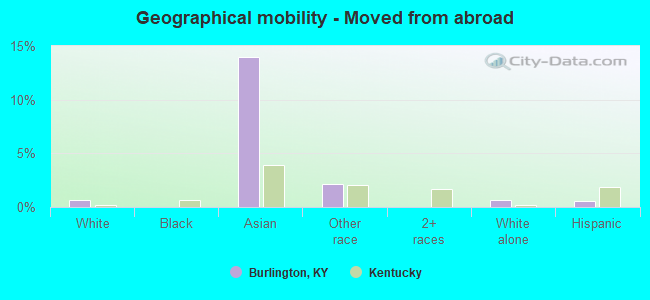
Geographical mobility - Moved from abroad (%)
Geographical mobility - Moved from abroad (%) - White
Geographical mobility - Moved from abroad (%) - Black or African American
Geographical mobility - Moved from abroad (%) - Asian
Geographical mobility - Moved from abroad (%) - Hispanic or Latino
Geographical mobility - Moved from abroad (%) - American Indian and Alaska Native
Geographical mobility - Moved from abroad (%) - Multirace
Geographical mobility - Moved from abroad (%) - Other Race
Place of birth for the foreign-born population - Ireland (%)
Place of birth for the foreign-born population - Denmark (%)
Place of birth for the foreign-born population - Norway (%)
Place of birth for the foreign-born population - Sweden (%)
Place of birth for the foreign-born population - United Kingdom (%)
Place of birth for the foreign-born population - England (%)
Place of birth for the foreign-born population - Scotland (%)
Place of birth for the foreign-born population - Other Northern Europe (%)
Place of birth for the foreign-born population - Austria (%)
Place of birth for the foreign-born population - Belgium (%)
Place of birth for the foreign-born population - France (%)
Place of birth for the foreign-born population - Germany (%)
Place of birth for the foreign-born population - Netherlands (%)
Place of birth for the foreign-born population - Switzerland (%)
Place of birth for the foreign-born population - Other Western Europe (%)
Place of birth for the foreign-born population - Greece (%)
Place of birth for the foreign-born population - Italy (%)
Place of birth for the foreign-born population - Portugal (%)
Place of birth for the foreign-born population - Spain (%)
Place of birth for the foreign-born population - Other Southern Europe (%)
Place of birth for the foreign-born population - Albania (%)
Place of birth for the foreign-born population - Belarus (%)
Place of birth for the foreign-born population - Bosnia and Herzegovina (%)
Place of birth for the foreign-born population - Bulgaria (%)
Place of birth for the foreign-born population - Croatia (%)
Place of birth for the foreign-born population - Czechoslovakia (%)
Place of birth for the foreign-born population - Hungary (%)
Place of birth for the foreign-born population - Latvia (%)
Place of birth for the foreign-born population - Lithuania (%)
Place of birth for the foreign-born population - North Macedonia (Macedonia) (%)
Place of birth for the foreign-born population - Moldova (%)
Place of birth for the foreign-born population - Poland (%)
Place of birth for the foreign-born population - Romania (%)
Place of birth for the foreign-born population - Russia (%)
Place of birth for the foreign-born population - Serbia (%)
Place of birth for the foreign-born population - Ukraine (%)
Place of birth for the foreign-born population - Other Eastern Europe (%)
Place of birth for the foreign-born population - China (%)
Place of birth for the foreign-born population - Hong Kong (%)
Place of birth for the foreign-born population - Taiwan (%)
Place of birth for the foreign-born population - Japan (%)
Place of birth for the foreign-born population - Korea (%)
Place of birth for the foreign-born population - Other Eastern Asia (%)
Place of birth for the foreign-born population - Afghanistan (%)
Place of birth for the foreign-born population - Bangladesh (%)
Place of birth for the foreign-born population - India (%)
Place of birth for the foreign-born population - Iran (%)
Place of birth for the foreign-born population - Kazakhstan (%)
Place of birth for the foreign-born population - Nepal (%)
Place of birth for the foreign-born population - Pakistan (%)
Place of birth for the foreign-born population - Sri Lanka (%)
Place of birth for the foreign-born population - Uzbekistan (%)
Place of birth for the foreign-born population - Other South Central Asia (%)
Place of birth for the foreign-born population - Burma (%)
Place of birth for the foreign-born population - Cambodia (%)
Place of birth for the foreign-born population - Indonesia (%)
Place of birth for the foreign-born population - Laos (%)
Place of birth for the foreign-born population - Malaysia (%)
Place of birth for the foreign-born population - Philippines (%)
Place of birth for the foreign-born population - Singapore (%)
Place of birth for the foreign-born population - Thailand (%)
Place of birth for the foreign-born population - Vietnam (%)
Place of birth for the foreign-born population - Other South Eastern Asia (%)
Place of birth for the foreign-born population - Armenia (%)
Place of birth for the foreign-born population - Iraq (%)
Place of birth for the foreign-born population - Israel (%)
Place of birth for the foreign-born population - Jordan (%)
Place of birth for the foreign-born population - Kuwait (%)
Place of birth for the foreign-born population - Lebanon (%)
Place of birth for the foreign-born population - Saudi Arabia (%)
Place of birth for the foreign-born population - Syria (%)
Place of birth for the foreign-born population - Turkey (%)
Place of birth for the foreign-born population - Yemen (%)
Place of birth for the foreign-born population - Other Western Asia (%)
Place of birth for the foreign-born population - Eritrea (%)
Place of birth for the foreign-born population - Ethiopia (%)
Place of birth for the foreign-born population - Kenya (%)
Place of birth for the foreign-born population - Somalia (%)
Place of birth for the foreign-born population - Uganda (%)
Place of birth for the foreign-born population - Zimbabwe (%)
Place of birth for the foreign-born population - Other Eastern Africa (%)
Place of birth for the foreign-born population - Cameroon (%)
Place of birth for the foreign-born population - Congo (%)
Place of birth for the foreign-born population - Democratic Republic of Congo (Zaire) (%)
Place of birth for the foreign-born population - Other Middle Africa (%)
Place of birth for the foreign-born population - Egypt (%)
Place of birth for the foreign-born population - Morocco (%)
Place of birth for the foreign-born population - Sudan (%)
Place of birth for the foreign-born population - Other Northern Africa (%)
Place of birth for the foreign-born population - South Africa (%)
Place of birth for the foreign-born population - Other Southern Africa (%)
Place of birth for the foreign-born population - Cabo Verde (%)
Place of birth for the foreign-born population - Ghana (%)
Place of birth for the foreign-born population - Liberia (%)
Place of birth for the foreign-born population - Nigeria (%)
Place of birth for the foreign-born population - Senegal (%)
Place of birth for the foreign-born population - Sierra Leone (%)
Place of birth for the foreign-born population - Other Western Africa (%)
Place of birth for the foreign-born population - Australia (%)
Place of birth for the foreign-born population - New Zealand (%)
Place of birth for the foreign-born population - Fiji (%)
Place of birth for the foreign-born population - Micronesia (%)
Place of birth for the foreign-born population - Bahamas (%)
Place of birth for the foreign-born population - Barbados (%)
Place of birth for the foreign-born population - Cuba (%)
Place of birth for the foreign-born population - Dominica (%)
Place of birth for the foreign-born population - Dominican Republic (%)
Place of birth for the foreign-born population - Grenada (%)
Place of birth for the foreign-born population - Haiti (%)
Place of birth for the foreign-born population - Jamaica (%)
Place of birth for the foreign-born population - St. Vincent and the Grenadines (%)
Place of birth for the foreign-born population - Trinidad and Tobago (%)
Place of birth for the foreign-born population - West Indies (%)
Place of birth for the foreign-born population - Other Caribbean (%)
Place of birth for the foreign-born population - Belize (%)
Place of birth for the foreign-born population - Costa Rica (%)
Place of birth for the foreign-born population - El Salvador (%)
Place of birth for the foreign-born population - Guatemala (%)
Place of birth for the foreign-born population - Honduras (%)
Place of birth for the foreign-born population - Mexico (%)
Place of birth for the foreign-born population - Nicaragua (%)
Place of birth for the foreign-born population - Panama (%)
Place of birth for the foreign-born population - Other Central America (%)
Place of birth for the foreign-born population - Argentina (%)
Place of birth for the foreign-born population - Bolivia (%)
Place of birth for the foreign-born population - Brazil (%)
Place of birth for the foreign-born population - Chile (%)
Place of birth for the foreign-born population - Colombia (%)
Place of birth for the foreign-born population - Ecuador (%)
Place of birth for the foreign-born population - Guyana (%)
Place of birth for the foreign-born population - Peru (%)
Place of birth for the foreign-born population - Uruguay (%)
Place of birth for the foreign-born population - Venezuela (%)
Place of birth for the foreign-born population - Other South America (%)
Place of birth for the foreign-born population - Canada (%)
Place of birth for the foreign-born population - Other Northern America (%)
Place of birth for the foreign-born population - Other (%)
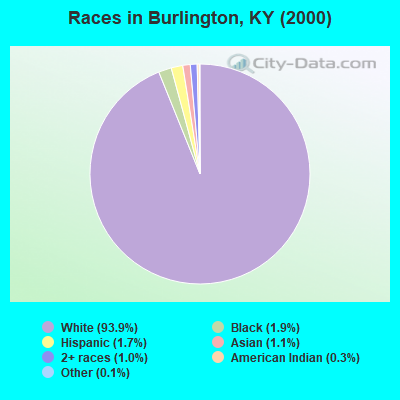
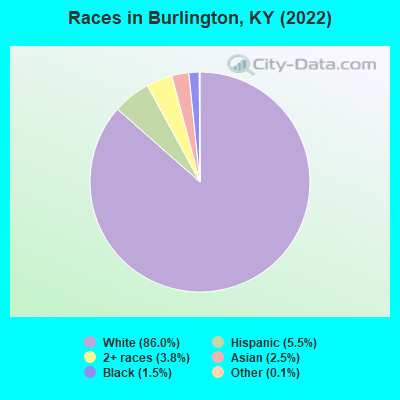
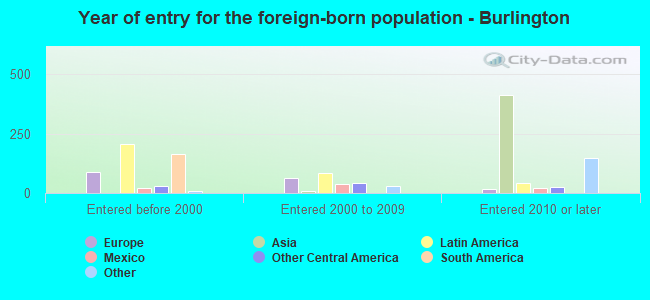
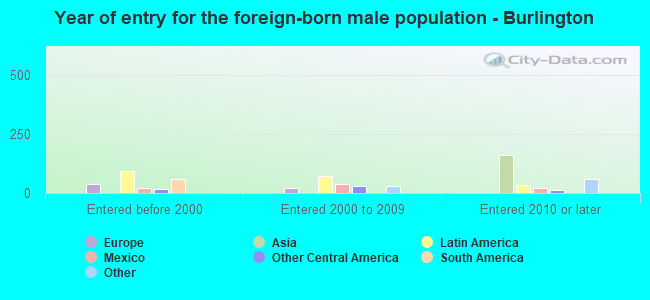
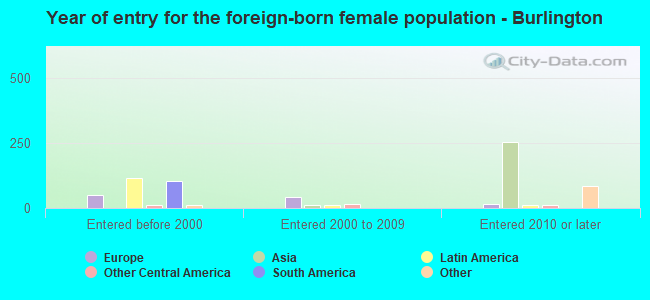
According to 2022 data, the most numerous races in Burlington, KY are White alone (16,055 residents), Black alone (280 residents), and Hispanic (1,030 residents). 91.1% of Burlington residents speak English at home. 6.1% of Burlington, KY residents are foreign-born (2.3% born in Asia, 1.9% born in Latin America, 1.1% born in Europe, 0.7% born in Africa), which is 34.8% greater than the foreign-born rate of 4.0% across the entire state of Kentucky.
Race distribution in Burlington
2000 2022
3,608,013 89.3% White alone 293,639 7.3% Black alone 59,939 1.5% Hispanic 37,750 0.9% Two or more races 29,368 0.7% Asian alone 7,939 0.2% American Indian alone 3,846 0.10% Other race alone 1,275 0.03% Native Hawaiian and Other
3,710,998 82.2% White alone 343,194 7.6% Black alone 187,483 4.2% Hispanic 187,394 4.2% Two or more races 62,240 1.4% Asian alone 13,529 0.3% Other race alone 4,302 0.10% American Indian alone 3,170 0.07% Native Hawaiian and Other
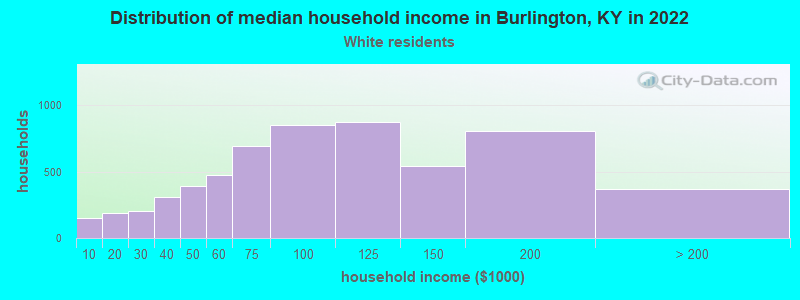
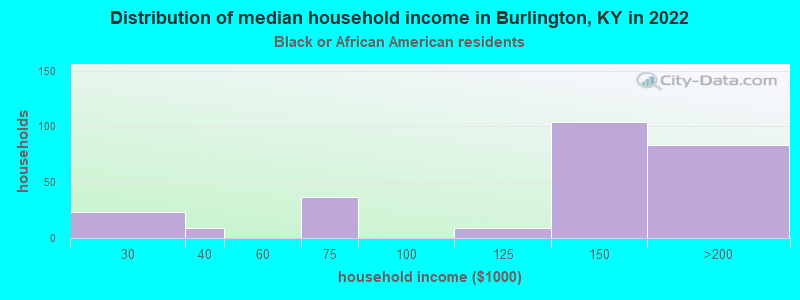
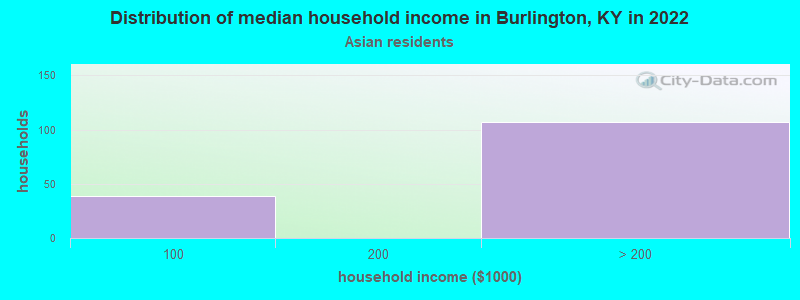
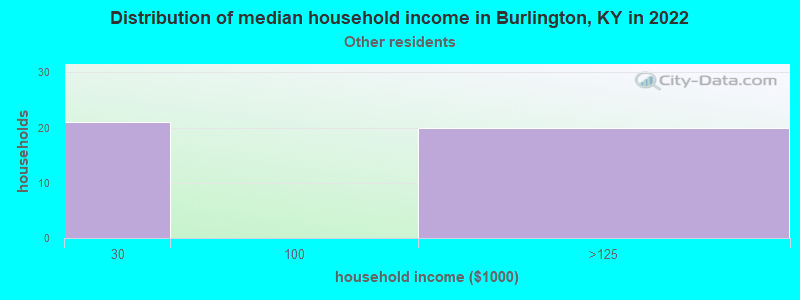
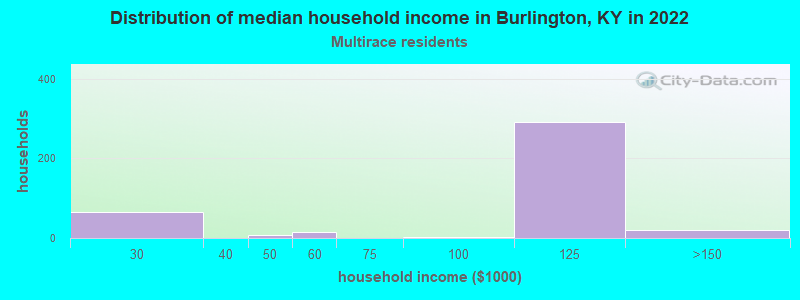
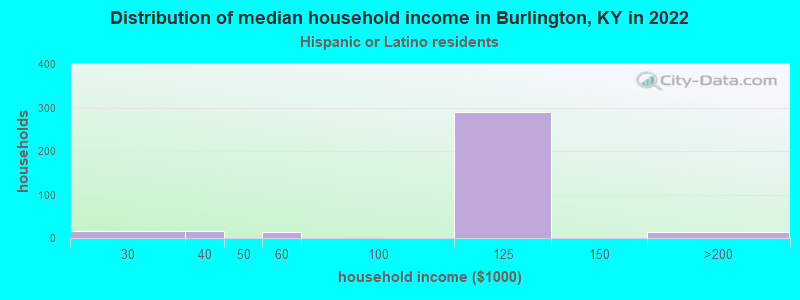
Income and house value in Burlington Median household income in 2022 $91,657 White non-Hispanic householders$150,933 Black householdersover $200,000 Asian householders$147,124 Two or more races householders$101,003 Hispanic or Latino race householdersMedian 2022 house value $249,886 White Non-Hispanic householders$196,992 Black or African American householders$246,191 Some other race householders$267,388 Two or more races householders$188,241 Hispanic or Latino householders
Median age by race in Burlington
39.2 Median age for White residents36.4 42.4 48.6 Median age for Black or African American residents67.2 44.5 -521,556,256.1 Median age for American Indian / Alaska Native residents-607,449,856.1 -630,065,358.8 32.5 Median age for Asian residents26.2 34.5 -914,965,985.5 Median age for Native Hawaiian / Pacific Islander residents-1,069,860,278.4 -853,801,168.7 19.5 Median age for Other race residents25.2 8.7 40.1 Median age for Two or more races residents59.8 6.8 39.7 Median age for White alone residents36.3 42.7 34.5 Median age for Hispanic or Latino residents49.7 27.9
Owner/renter occupied households by race in Burlington
House owners and renters - White residents 5,083 85.3% Owner occupied876 14.7% Renter occupiedHouse owners and renters - Black or African American residents 154 80.9% Owner occupied36 19.1% Renter occupiedHouse owners and renters - Asian residents 192 100.0% Renter occupiedHouse owners and renters - Other race residents 19 40.7% Owner occupied28 59.3% Renter occupiedHouse owners and renters - Two or more races residents 62 15.6% Owner occupied335 84.4% Renter occupiedHouse owners and renters - White alone residents 4,990 85.3% Owner occupied860 14.7% Renter occupiedHouse owners and renters - Hispanic or Latino residents 150 44.9% Owner occupied184 55.1% Renter occupied
Language usage in Burlington
English speakers - Total 91.1% of residents of Burlington speak English at home.
4.7% of residents speak Spanish at home 570 67.7% Speak English very well272 32.3% Speak English less than very well4.3% of residents speak other language at home 629 82.7% Speak English very well132 17.3% Speak English less than very well
English speakers - Born in the United States 96.8% of residents of Burlington speak English at home.
1.8% of residents speak Spanish at home 114 91.9% Speak English very well10 8.1% Speak English less than very well
English speakers - Native, born elsewhere 29.1% of residents of Burlington speak English at home.
55.2% of residents speak Spanish at home 45 60.8% Speak English very well29 39.2% Speak English less than very well
English speakers - Foreign-born 18.2% of residents of Burlington speak English at home.
40.4% of residents speak Spanish at home 380 77.2% Speak English very well112 22.8% Speak English less than very well48.6% of residents speak other language at home 454 76.8% Speak English very well137 23.2% Speak English less than very well
White (Caucasian) - Speak only English Native:
98.4% (14,915)Foreign-born:
36.8% (180)
White (Caucasian) - Speak another language Native:
1.6% (242)Foreign-born:
61.2% (299)
Asian - Speak only English Native:
100.0% (20)Foreign-born:
5.0% (22)
Other race - Speak only English Native:
45.4% (110)Foreign-born:
18.8% (27)
Other race - Speak another language Native:
52.3% (127)Foreign-born:
82.2% (118)
Two or more races - Speak only English Native:
65.7% (625)Foreign-born:
16.3% (10)
Two or more races - Speak another language Native:
34.9% (332)Foreign-born:
84.4% (50)
White alone - Speak only English Native:
98.8% (14,806)Foreign-born:
49.9% (180)
White alone - Speak another language Native:
1.3% (191)Foreign-born:
49.0% (176)
Hispanic or Latino - Speak only English Native:
37.5% (175)Foreign-born:
9.3% (48)
Hispanic or Latino - Speak another language Native:
58.0% (271)Foreign-born:
91.6% (472)
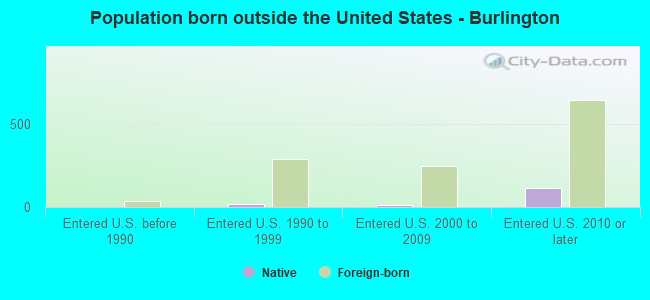
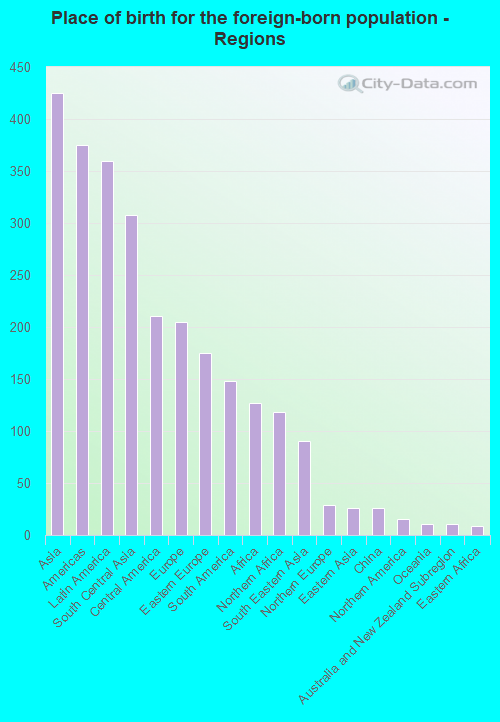
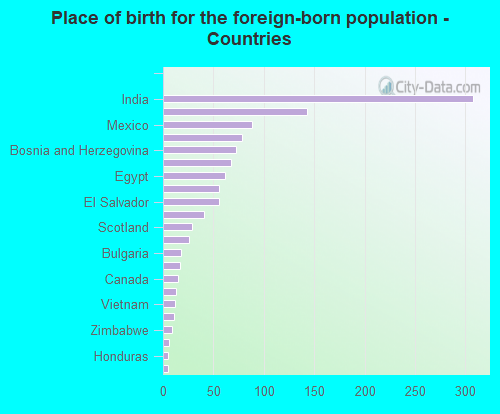
Foreign-born residents in Burlington 1,144 residents are foreign born (2.3% Asia , 1.9% Latin America , 1.1% Europe , 0.7% Africa ).
This city:
6.1%Kentucky:
4.1%
Marital status for residents in Burlington Marital status - White (Caucasian) population 15 years and over
Males 35.9% Never married52.5% Now married3.2% Separated1.8% Widowed6.5% DivorcedFemales 29.5% Never married50.2% Now married1.0% Separated6.8% Widowed12.6% DivorcedWomen who gave birth in the past 12 months Now married:
79.8% (127)Unmarried:
20.2% (32)
Women who did not give birth in the past 12 months Now married:
45.4% (1,745)Unmarried:
54.6% (2,095)
Marital status - Black or African American population 15 years and over
Males 10.8% Never married72.4% Now married0.0% Separated0.0% Widowed16.8% DivorcedFemales 35.6% Never married12.3% Now married0.0% Separated0.0% Widowed52.1% DivorcedWomen who did not give birth in the past 12 months Now married:
12.3% (9)Unmarried:
87.7% (65)
Marital status - Asian population 15 years and over
Males 40.9% Never married59.1% Now married0.0% Separated0.0% Widowed0.0% DivorcedFemales 5.9% Never married94.1% Now married0.0% Separated0.0% Widowed0.0% DivorcedWomen who gave birth in the past 12 months Now married:
100.0% (67)Unmarried:
0.0% (0)
Women who did not give birth in the past 12 months Now married:
91.4% (133)Unmarried:
8.6% (13)
Marital status - Other race population 15 years and over
Males 74.8% Never married25.2% Now married0.0% Separated0.0% Widowed0.0% DivorcedFemales 39.6% Never married20.8% Now married0.0% Separated0.0% Widowed39.6% DivorcedWomen who did not give birth in the past 12 months Now married:
20.8% (14)Unmarried:
79.2% (55)
Marital status - Two or more races population 15 years and over
Males 35.5% Never married59.4% Now married0.8% Separated0.0% Widowed4.2% DivorcedFemales 0.0% Never married60.0% Now married0.0% Separated40.0% Widowed0.0% DivorcedWomen who did not give birth in the past 12 months Now married:
100.0% (10)Unmarried:
0.0% (0)
Marital status - White alone, not Hispanic / Latino population 15 years and over
Males 35.7% Never married52.7% Now married3.2% Separated1.8% Widowed6.6% DivorcedFemales 28.6% Never married50.5% Now married1.0% Separated7.0% Widowed13.0% DivorcedWomen who gave birth in the past 12 months Now married:
79.8% (129)Unmarried:
20.2% (33)
Women who did not give birth in the past 12 months Now married:
46.4% (1,728)Unmarried:
53.6% (1,994)
Marital status - Hispanic or Latino population 15 years and over
Males 40.0% Never married58.1% Now married1.0% Separated0.0% Widowed1.0% DivorcedFemales 53.5% Never married39.1% Now married0.0% Separated0.0% Widowed7.4% DivorcedWomen who did not give birth in the past 12 months Now married:
23.8% (59)Unmarried:
76.2% (188)
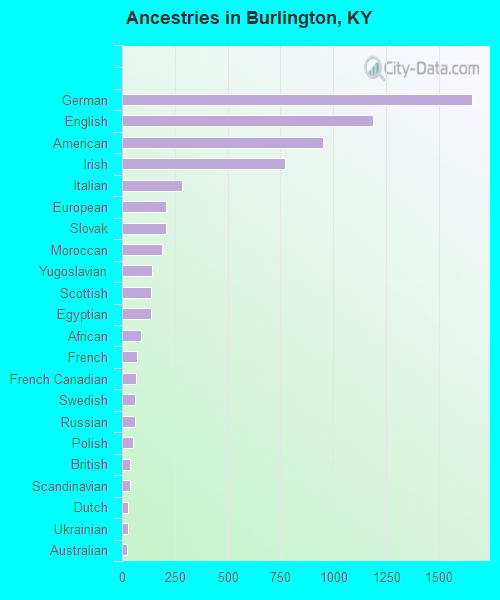
Ancestries in Burlington
1,654 20.9% German1,189 15.0% English951 12.0% American769 9.7% Irish282 3.6% Italian209 2.6% European208 2.6% Slovak187 2.4% Moroccan144 1.8% Yugoslavian138 1.7% Scottish135 1.7% Egyptian89 1.1% African70 0.9% French66 0.8% French Canadian62 0.8% Swedish60 0.8% Russian54 0.7% Polish39 0.5% British39 0.5% Scandinavian30 0.4% Dutch29 0.4% Ukrainian23 0.3% Australian15 0.2% Bulgarian10 0.1% Welsh9 0.1% Scotch-Irish9 0.1% Zimbabwean
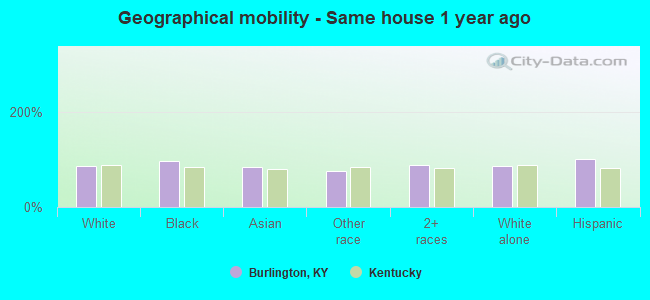
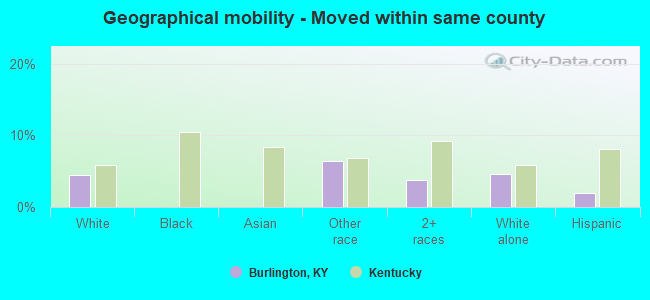
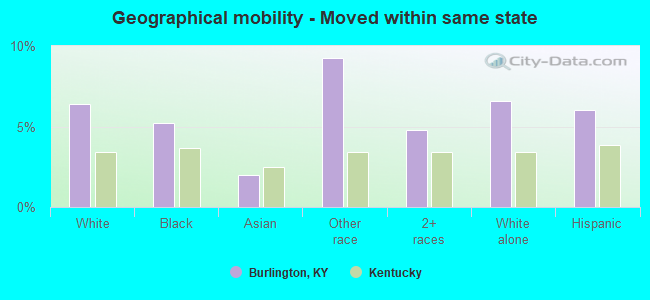
Geographical mobility in Burlington Same house 1 year ago 13,946 85.7% White (Caucasian)303 95.7% Black or African American341 84.4% Asian291 75.1% Other race775 87.8% Two or more races13,587 85.2% White alone, not Hispanic / Latino1,051 100.0% Hispanic or LatinoMoved within same county 723 4.4% White / Caucasian25 6.4% Other race33 3.8% Two or more races733 4.6% White alone, not Hispanic / Latino20 1.9% Hispanic or LatinoMoved within same state 1,042 6.4% White / Caucasian16 5.2% Black or African American8 2.0% Asian36 9.3% Other race42 4.8% Two or more races1,051 6.6% White alone, not Hispanic / Latino63 6.1% Hispanic or LatinoMoved from different state 491 3.0% White / Caucasian4 1.3% Black or African American24 6.3% Other race24 2.7% Two or more races534 3.3% White alone, not Hispanic / Latino20 1.9% Hispanic or LatinoMoved from abroad 111 0.7% White56 14.0% Asian8 2.1% Other race111 0.7% White alone, not Hispanic / Latino5 0.5% Hispanic or Latino
Children Nativity (place of birth) in Burlington
Children under 6 years - Living with two parents Both parents native 386 100.0% NativeBoth parents foreign-born 84 100.0% NativeOne native, one foreign-born parent 17 100.0% NativeChildren under 6 years - Living with one parent Native parent 482 100.0% NativeChildren 6 to 17 years - Living with two parents Both parents native 1,791 98.9% Native19 1.1% Foreign-bornBoth parents foreign-born 79 64.4% Native44 35.6% Foreign-bornOne native, one foreign-born parent 20 100.0% NativeChildren 6 to 17 years - Living with one parent Native parent 814 97.4% Native22 2.6% Foreign-bornForeign-born parent 10 43.2% Native13 56.8% Foreign-born
Grandparents responsible for own grandchildren in Burlington
Grandparents (30 to 59 years) White / Caucasian 362 83.8% Responsible for grandchildren70 16.2% Not responsible for grandchildrenTwo or more races 4 100.0% Responsible for grandchildrenWhite alone, not Hispanic / Latino 362 83.8% Responsible for grandchildren70 16.2% Not responsible for grandchildrenGrandparents (60 years and over) White / Caucasian 245 70.4% Responsible for grandchildren103 29.6% Not responsible for grandchildrenWhite alone, not Hispanic / Latino 289 72.8% Responsible for grandchildren108 27.2% Not responsible for grandchildren