Races in Butler, Pennsylvania (PA) Detailed Stats
Data:
Races - White alone (%)
Races - White alone (% change since 2000)
Races - Black alone (%)
Races - Black alone (% change since 2000)
Races - American Indian alone (%)
Races - American Indian alone (% change since 2000)
Races - Asian alone (%)
Races - Asian alone (% change since 2000)
Races - Hispanic (%)
Races - Hispanic (% change since 2000)
Races - Native Hawaiian and Other Pacific Islander alone (%)
Races - Native Hawaiian and Other Pacific Islander alone (% change since 2000)
Races - Two or more races(%)
Races - Two or more races(% change since 2000)
Races - Other race alone (%)
Races - Other race alone (% change since 2000)
Racial diversity
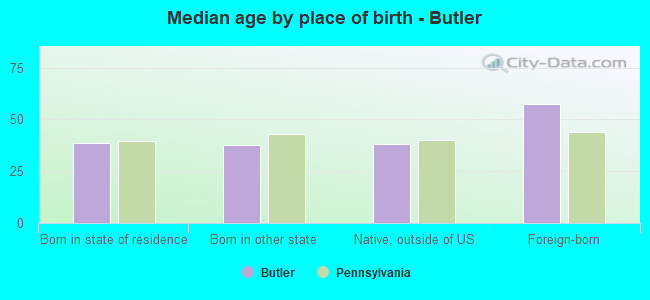
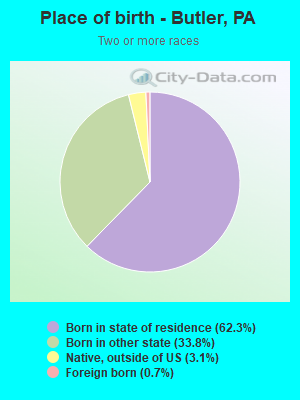
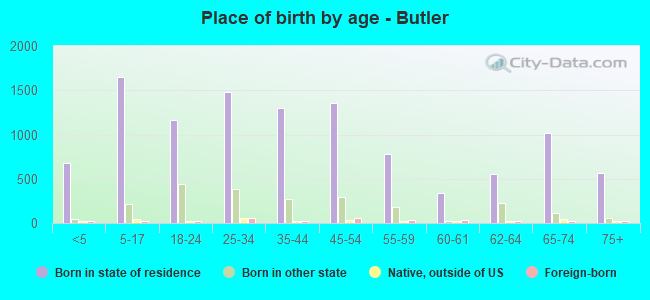
Place of birth - Born in state of residence (%)
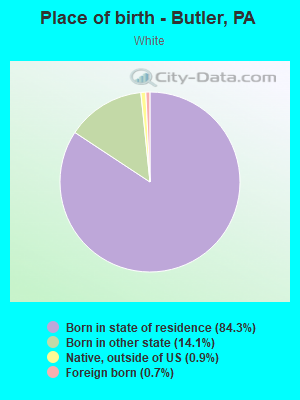
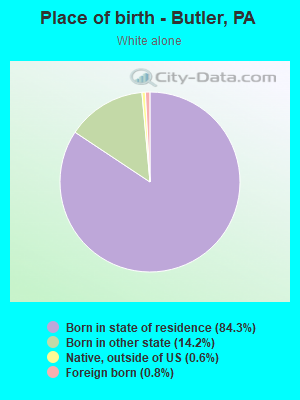
Place of birth - Born in state of residence (%) - White
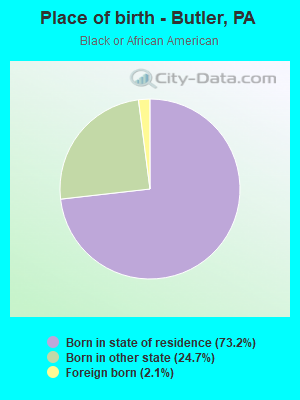
Place of birth - Born in state of residence (%) - Black or African American
Place of birth - Born in state of residence (%) - Asian
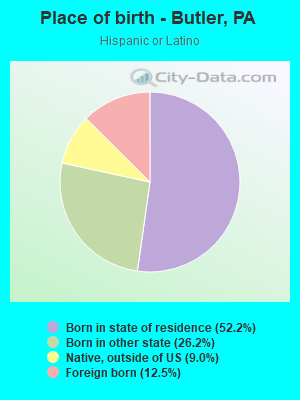
Place of birth - Born in state of residence (%) - Hispanic or Latino
Place of birth - Born in state of residence (%) - American Indian and Alaska Native
Place of birth - Born in state of residence (%) - Multirace
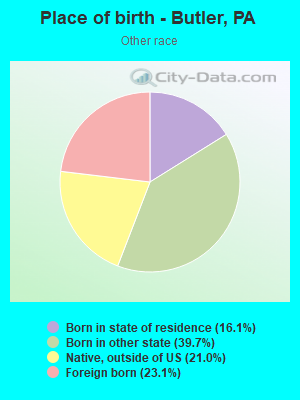
Place of birth - Born in state of residence (%) - Other Race
Place of birth - Born in other state (%)
Place of birth - Born in other state (%) - White
Place of birth - Born in other state (%) - Black or African American
Place of birth - Born in other state (%) - Asian
Place of birth - Born in other state (%) - Hispanic or Latino
Place of birth - Born in other state (%) - American Indian and Alaska Native
Place of birth - Born in other state (%) - Multirace
Place of birth - Born in other state (%) - Other Race
Place of birth - Native, outside of US (%)
Place of birth - Native, outside of US (%) - White
Place of birth - Native, outside of US (%) - Black or African American
Place of birth - Native, outside of US (%) - Asian
Place of birth - Native, outside of US (%) - Hispanic or Latino
Place of birth - Native, outside of US (%) - American Indian and Alaska Native
Place of birth - Native, outside of US (%) - Multirace
Place of birth - Native, outside of US (%) - Other Race
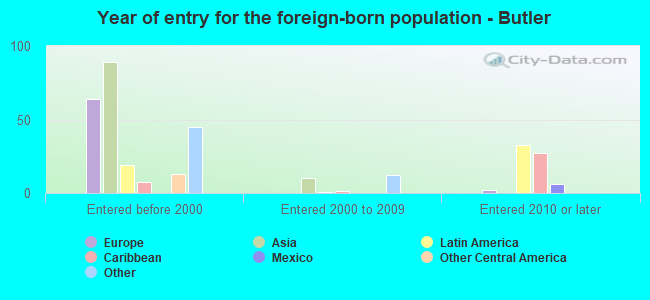
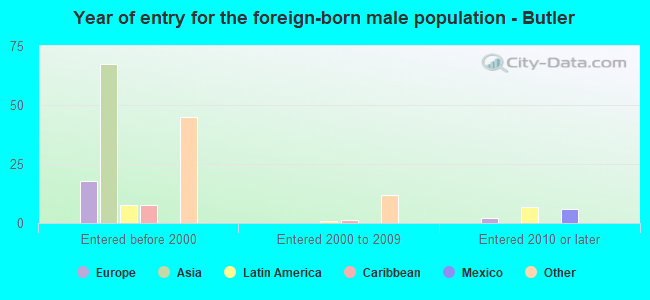
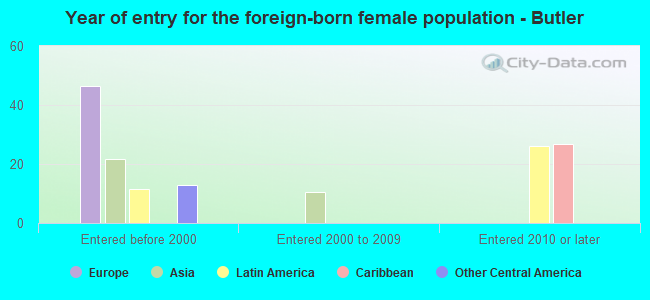
Place of birth - Foreign born (%)
Place of birth - Foreign born (%) - White
Place of birth - Foreign born (%) - Black or African American
Place of birth - Foreign born (%) - Asian
Place of birth - Foreign born (%) - Hispanic or Latino
Place of birth - Foreign born (%) - American Indian and Alaska Native
Place of birth - Foreign born (%) - Multirace
Place of birth - Foreign born (%) - Other Race
Residents speaking English at home (%)
Residents speaking English at home - Born in the United States (%)
Residents speaking English at home - Native, born elsewhere (%)
Residents speaking English at home - Foreign born (%)
Residents speaking Spanish at home (%)
Residents speaking Spanish at home - Born in the United States (%)
Residents speaking Spanish at home - Native, born elsewhere (%)
Residents speaking Spanish at home - Foreign born (%)
Residents speaking other language at home (%)
Residents speaking other language at home - Born in the United States (%)
Residents speaking other language at home - Native, born elsewhere (%)
Residents speaking other language at home - Foreign born (%)
Marital status - Never married (%)
Marital status - Now married (%)
Marital status - Separated (%)
Marital status - Widowed (%)
Marital status - Divorced (%)
Ancestries Reported - Arab (%)
Ancestries Reported - Czech (%)
Ancestries Reported - Danish (%)
Ancestries Reported - Dutch (%)
Ancestries Reported - English (%)
Ancestries Reported - French (%)
Ancestries Reported - French Canadian (%)
Ancestries Reported - German (%)
Ancestries Reported - Greek (%)
Ancestries Reported - Hungarian (%)
Ancestries Reported - Irish (%)
Ancestries Reported - Italian (%)
Ancestries Reported - Lithuanian (%)
Ancestries Reported - Norwegian (%)
Ancestries Reported - Polish (%)
Ancestries Reported - Portuguese (%)
Ancestries Reported - Russian (%)
Ancestries Reported - Scotch-Irish (%)
Ancestries Reported - Scottish (%)
Ancestries Reported - Slovak (%)
Ancestries Reported - Subsaharan African (%)
Ancestries Reported - Swedish (%)
Ancestries Reported - Swiss (%)
Ancestries Reported - Ukrainian (%)
Ancestries Reported - United States (%)
Ancestries Reported - Welsh (%)
Ancestries Reported - West Indian (%)
Ancestries Reported - Other (%)
Geographical mobility - Same house 1 year ago (%)
Geographical mobility - Same house 1 year ago (%) - White
Geographical mobility - Same house 1 year ago (%) - Black or African American
Geographical mobility - Same house 1 year ago (%) - Asian
Geographical mobility - Same house 1 year ago (%) - Hispanic or Latino
Geographical mobility - Same house 1 year ago (%) - American Indian and Alaska Native
Geographical mobility - Same house 1 year ago (%) - Multirace
Geographical mobility - Same house 1 year ago (%) - Other Race
Geographical mobility - Moved within same county (%)
Geographical mobility - Moved within same county (%) - White
Geographical mobility - Moved within same county (%) - Black or African American
Geographical mobility - Moved within same county (%) - Asian
Geographical mobility - Moved within same county (%) - Hispanic or Latino
Geographical mobility - Moved within same county (%) - American Indian and Alaska Native
Geographical mobility - Moved within same county (%) - Multirace
Geographical mobility - Moved within same county (%) - Other Race
Geographical mobility - Moved from different county within same state (%)
Geographical mobility - Moved from different county within same state (%) - White
Geographical mobility - Moved from different county within same state (%) - Black or African American
Geographical mobility - Moved from different county within same state (%) - Asian
Geographical mobility - Moved from different county within same state (%) - Hispanic or Latino
Geographical mobility - Moved from different county within same state (%) - American Indian and Alaska Native
Geographical mobility - Moved from different county within same state (%) - Multirace
Geographical mobility - Moved from different county within same state (%) - Other Race
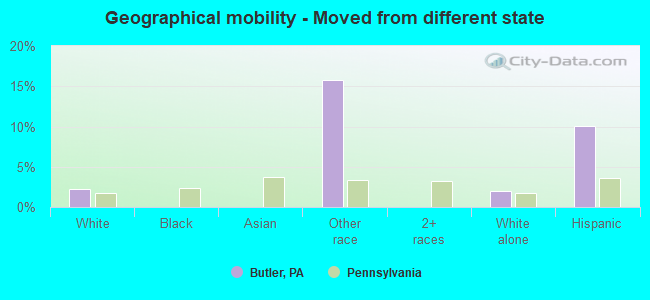
Geographical mobility - Moved from different state (%)
Geographical mobility - Moved from different state (%) - White
Geographical mobility - Moved from different state (%) - Black or African American
Geographical mobility - Moved from different state (%) - Asian
Geographical mobility - Moved from different state (%) - Hispanic or Latino
Geographical mobility - Moved from different state (%) - American Indian and Alaska Native
Geographical mobility - Moved from different state (%) - Multirace
Geographical mobility - Moved from different state (%) - Other Race
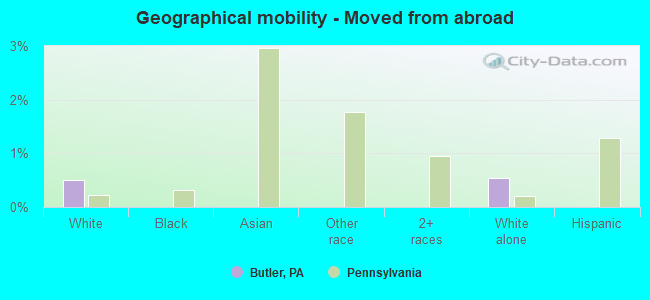
Geographical mobility - Moved from abroad (%)
Geographical mobility - Moved from abroad (%) - White
Geographical mobility - Moved from abroad (%) - Black or African American
Geographical mobility - Moved from abroad (%) - Asian
Geographical mobility - Moved from abroad (%) - Hispanic or Latino
Geographical mobility - Moved from abroad (%) - American Indian and Alaska Native
Geographical mobility - Moved from abroad (%) - Multirace
Geographical mobility - Moved from abroad (%) - Other Race
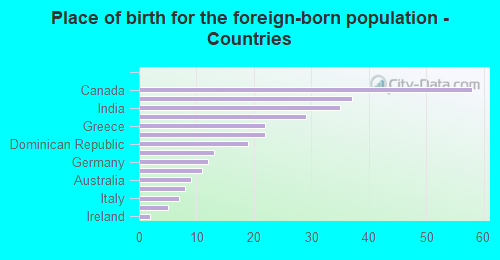
Place of birth for the foreign-born population - Ireland (%)
Place of birth for the foreign-born population - Denmark (%)
Place of birth for the foreign-born population - Norway (%)
Place of birth for the foreign-born population - Sweden (%)
Place of birth for the foreign-born population - United Kingdom (%)
Place of birth for the foreign-born population - England (%)
Place of birth for the foreign-born population - Scotland (%)
Place of birth for the foreign-born population - Other Northern Europe (%)
Place of birth for the foreign-born population - Austria (%)
Place of birth for the foreign-born population - Belgium (%)
Place of birth for the foreign-born population - France (%)
Place of birth for the foreign-born population - Germany (%)
Place of birth for the foreign-born population - Netherlands (%)
Place of birth for the foreign-born population - Switzerland (%)
Place of birth for the foreign-born population - Other Western Europe (%)
Place of birth for the foreign-born population - Greece (%)
Place of birth for the foreign-born population - Italy (%)
Place of birth for the foreign-born population - Portugal (%)
Place of birth for the foreign-born population - Spain (%)
Place of birth for the foreign-born population - Other Southern Europe (%)
Place of birth for the foreign-born population - Albania (%)
Place of birth for the foreign-born population - Belarus (%)
Place of birth for the foreign-born population - Bosnia and Herzegovina (%)
Place of birth for the foreign-born population - Bulgaria (%)
Place of birth for the foreign-born population - Croatia (%)
Place of birth for the foreign-born population - Czechoslovakia (%)
Place of birth for the foreign-born population - Hungary (%)
Place of birth for the foreign-born population - Latvia (%)
Place of birth for the foreign-born population - Lithuania (%)
Place of birth for the foreign-born population - North Macedonia (Macedonia) (%)
Place of birth for the foreign-born population - Moldova (%)
Place of birth for the foreign-born population - Poland (%)
Place of birth for the foreign-born population - Romania (%)
Place of birth for the foreign-born population - Russia (%)
Place of birth for the foreign-born population - Serbia (%)
Place of birth for the foreign-born population - Ukraine (%)
Place of birth for the foreign-born population - Other Eastern Europe (%)
Place of birth for the foreign-born population - China (%)
Place of birth for the foreign-born population - Hong Kong (%)
Place of birth for the foreign-born population - Taiwan (%)
Place of birth for the foreign-born population - Japan (%)
Place of birth for the foreign-born population - Korea (%)
Place of birth for the foreign-born population - Other Eastern Asia (%)
Place of birth for the foreign-born population - Afghanistan (%)
Place of birth for the foreign-born population - Bangladesh (%)
Place of birth for the foreign-born population - India (%)
Place of birth for the foreign-born population - Iran (%)
Place of birth for the foreign-born population - Kazakhstan (%)
Place of birth for the foreign-born population - Nepal (%)
Place of birth for the foreign-born population - Pakistan (%)
Place of birth for the foreign-born population - Sri Lanka (%)
Place of birth for the foreign-born population - Uzbekistan (%)
Place of birth for the foreign-born population - Other South Central Asia (%)
Place of birth for the foreign-born population - Burma (%)
Place of birth for the foreign-born population - Cambodia (%)
Place of birth for the foreign-born population - Indonesia (%)
Place of birth for the foreign-born population - Laos (%)
Place of birth for the foreign-born population - Malaysia (%)
Place of birth for the foreign-born population - Philippines (%)
Place of birth for the foreign-born population - Singapore (%)
Place of birth for the foreign-born population - Thailand (%)
Place of birth for the foreign-born population - Vietnam (%)
Place of birth for the foreign-born population - Other South Eastern Asia (%)
Place of birth for the foreign-born population - Armenia (%)
Place of birth for the foreign-born population - Iraq (%)
Place of birth for the foreign-born population - Israel (%)
Place of birth for the foreign-born population - Jordan (%)
Place of birth for the foreign-born population - Kuwait (%)
Place of birth for the foreign-born population - Lebanon (%)
Place of birth for the foreign-born population - Saudi Arabia (%)
Place of birth for the foreign-born population - Syria (%)
Place of birth for the foreign-born population - Turkey (%)
Place of birth for the foreign-born population - Yemen (%)
Place of birth for the foreign-born population - Other Western Asia (%)
Place of birth for the foreign-born population - Eritrea (%)
Place of birth for the foreign-born population - Ethiopia (%)
Place of birth for the foreign-born population - Kenya (%)
Place of birth for the foreign-born population - Somalia (%)
Place of birth for the foreign-born population - Uganda (%)
Place of birth for the foreign-born population - Zimbabwe (%)
Place of birth for the foreign-born population - Other Eastern Africa (%)
Place of birth for the foreign-born population - Cameroon (%)
Place of birth for the foreign-born population - Congo (%)
Place of birth for the foreign-born population - Democratic Republic of Congo (Zaire) (%)
Place of birth for the foreign-born population - Other Middle Africa (%)
Place of birth for the foreign-born population - Egypt (%)
Place of birth for the foreign-born population - Morocco (%)
Place of birth for the foreign-born population - Sudan (%)
Place of birth for the foreign-born population - Other Northern Africa (%)
Place of birth for the foreign-born population - South Africa (%)
Place of birth for the foreign-born population - Other Southern Africa (%)
Place of birth for the foreign-born population - Cabo Verde (%)
Place of birth for the foreign-born population - Ghana (%)
Place of birth for the foreign-born population - Liberia (%)
Place of birth for the foreign-born population - Nigeria (%)
Place of birth for the foreign-born population - Senegal (%)
Place of birth for the foreign-born population - Sierra Leone (%)
Place of birth for the foreign-born population - Other Western Africa (%)
Place of birth for the foreign-born population - Australia (%)
Place of birth for the foreign-born population - New Zealand (%)
Place of birth for the foreign-born population - Fiji (%)
Place of birth for the foreign-born population - Micronesia (%)
Place of birth for the foreign-born population - Bahamas (%)
Place of birth for the foreign-born population - Barbados (%)
Place of birth for the foreign-born population - Cuba (%)
Place of birth for the foreign-born population - Dominica (%)
Place of birth for the foreign-born population - Dominican Republic (%)
Place of birth for the foreign-born population - Grenada (%)
Place of birth for the foreign-born population - Haiti (%)
Place of birth for the foreign-born population - Jamaica (%)
Place of birth for the foreign-born population - St. Vincent and the Grenadines (%)
Place of birth for the foreign-born population - Trinidad and Tobago (%)
Place of birth for the foreign-born population - West Indies (%)
Place of birth for the foreign-born population - Other Caribbean (%)
Place of birth for the foreign-born population - Belize (%)
Place of birth for the foreign-born population - Costa Rica (%)
Place of birth for the foreign-born population - El Salvador (%)
Place of birth for the foreign-born population - Guatemala (%)
Place of birth for the foreign-born population - Honduras (%)
Place of birth for the foreign-born population - Mexico (%)
Place of birth for the foreign-born population - Nicaragua (%)
Place of birth for the foreign-born population - Panama (%)
Place of birth for the foreign-born population - Other Central America (%)
Place of birth for the foreign-born population - Argentina (%)
Place of birth for the foreign-born population - Bolivia (%)
Place of birth for the foreign-born population - Brazil (%)
Place of birth for the foreign-born population - Chile (%)
Place of birth for the foreign-born population - Colombia (%)
Place of birth for the foreign-born population - Ecuador (%)
Place of birth for the foreign-born population - Guyana (%)
Place of birth for the foreign-born population - Peru (%)
Place of birth for the foreign-born population - Uruguay (%)
Place of birth for the foreign-born population - Venezuela (%)
Place of birth for the foreign-born population - Other South America (%)
Place of birth for the foreign-born population - Canada (%)
Place of birth for the foreign-born population - Other Northern America (%)
Place of birth for the foreign-born population - Other (%)
Latest news about races in Butler, PA collected exclusively by city-data.com from local newspapers, TV, and radio stations
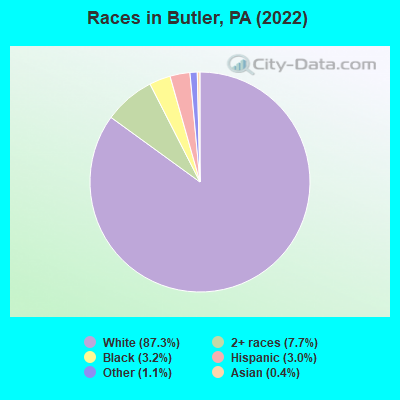
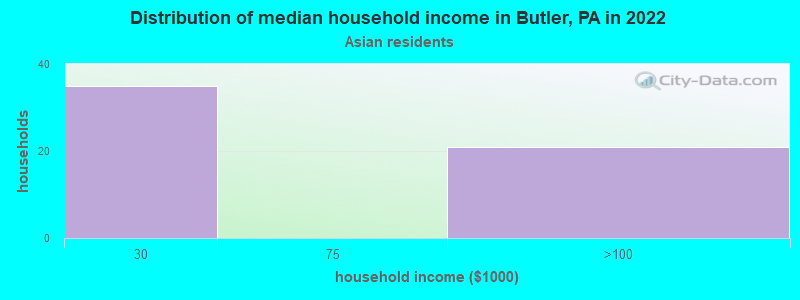
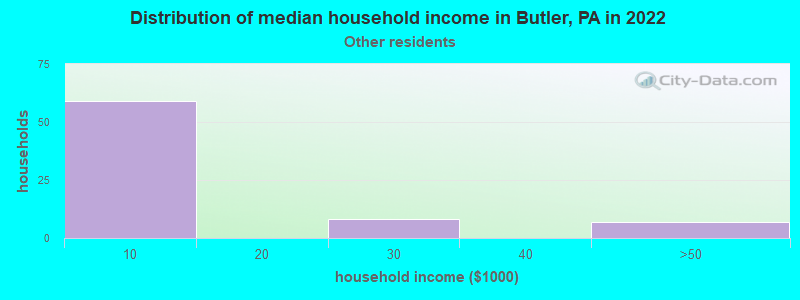
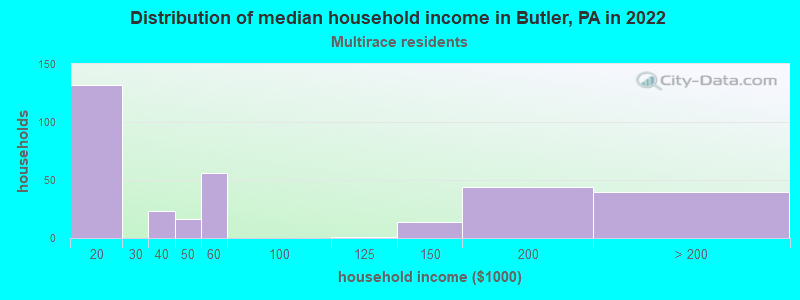
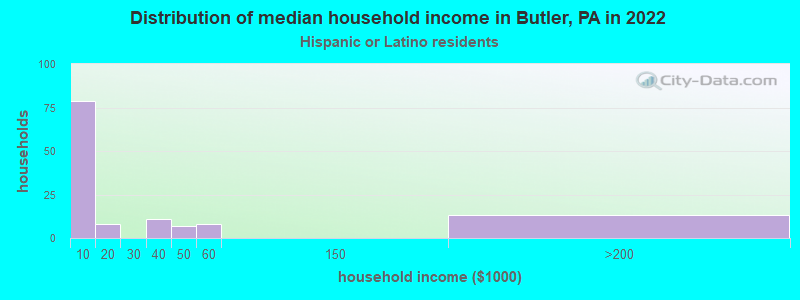
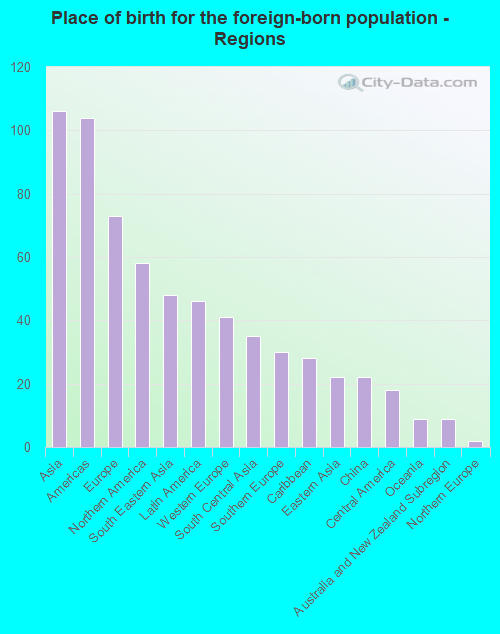
According to 2022 data, the most numerous races in Butler, PA are White alone (11,853 residents), Black alone (432 residents), and Hispanic (414 residents). 97.8% of Butler residents speak English at home. 2.2% of Butler, PA residents are foreign-born (0.8% born in Asia, 0.5% born in Europe, 0.4% born in North America, 0.3% born in Latin America), which is 223.2% less than the foreign-born rate of 7.0% across the entire state of Pennsylvania.
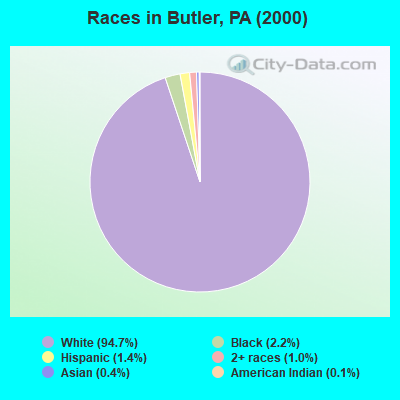
Race distribution in Butler
2000 2022
10,322,455 84.1% White alone 1,202,437 9.8% Black alone 394,088 3.2% Hispanic 218,296 1.8% Asian alone 113,097 0.9% Two or more races 13,086 0.1% Other race alone 14,904 0.1% American Indian alone 2,691 0.02% Native Hawaiian and Other
9,487,228 73.1% White alone 1,311,581 10.1% Black alone 1,115,997 8.6% Hispanic 493,942 3.8% Two or more races 487,124 3.8% Asian alone 63,582 0.5% Other race alone 10,130 0.08% American Indian alone 2,424 0.02% Native Hawaiian and Other
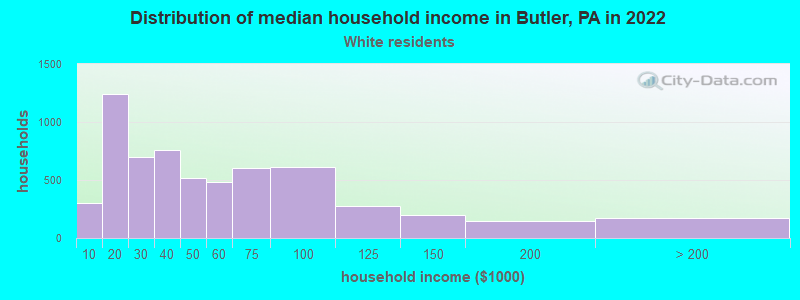
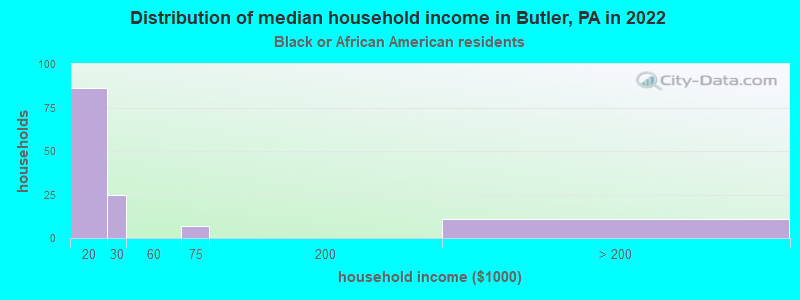
Income and house value in Butler Median household income in 2022 $39,856 White non-Hispanic householders$15,875 Black householders$2,689 Some other race householders$73,619 Two or more races householders$2,415 Hispanic or Latino race householdersMedian 2022 house value $115,921 White Non-Hispanic householders$80,292 Black or African American householders$191,782 American Indian or Alaska Native householders $681,893 Asian householders$93,760 Some other race householders$127,854 Two or more races householders$383,564 Hispanic or Latino householders
Median age by race in Butler
40.1 Median age for White residents41.3 39.9 28.2 Median age for Black or African American residents33.3 27.5 -574,045,801.0 Median age for American Indian / Alaska Native residents-616,175,782.5 -577,519,379.3 47.4 Median age for Asian residents-655,737,704.3 -805,781,390.3 -666,666,666.0 Median age for Native Hawaiian / Pacific Islander residents-666,666,666.0 -666,666,666.0 29.6 Median age for Other race residents29.2 42.7 20.8 Median age for Two or more races residents23.7 19.5 41.4 Median age for White alone residents41.6 41.4 24.3 Median age for Hispanic or Latino residents19.2 3.7
Owner/renter occupied households by race in Butler
House owners and renters - White residents 2,380 39.6% Owner occupied3,633 60.4% Renter occupiedHouse owners and renters - Black or African American residents 23 15.4% Owner occupied124 84.6% Renter occupiedHouse owners and renters - Asian residents 60 100.0% Renter occupiedHouse owners and renters - Other race residents 30 44.5% Owner occupied38 55.5% Renter occupiedHouse owners and renters - Two or more races residents 154 50.0% Owner occupied154 50.0% Renter occupiedHouse owners and renters - White alone residents 2,382 39.8% Owner occupied3,606 60.2% Renter occupiedHouse owners and renters - Hispanic or Latino residents 30 25.9% Owner occupied85 74.1% Renter occupied
Language usage in Butler
English speakers - Total 97.8% of residents of Butler speak English at home.
0.6% of residents speak Spanish at home 43 55.8% Speak English very well34 44.2% Speak English less than very well1.7% of residents speak other language at home 107 49.5% Speak English very well109 50.5% Speak English less than very well
All residents speak only English at home
English speakers - Native, born elsewhere 73.2% of residents of Butler speak English at home.
15.6% of residents speak Spanish at home 32 100.0% Speak English very well
English speakers - Foreign-born 46.0% of residents of Butler speak English at home.
13.8% of residents speak Spanish at home 1 3.0% Speak English very well32 97.0% Speak English less than very well43.5% of residents speak other language at home 11 10.6% Speak English very well93 89.4% Speak English less than very well
White (Caucasian) - Speak only English Native:
98.6% (11,173)Foreign-born:
70.6% (63)
White (Caucasian) - Speak another language Native:
1.3% (146)Foreign-born:
27.9% (25)
Black or African American - Speak only English Native:
99.6% (302)Foreign-born:
97.5% (8)
Black or African American - Speak another language Native:
0.6% (2)Foreign-born:
10.2% (1)
Other race - Speak only English Native:
99.9% (218)Foreign-born:
26.4% (18)
Other race - Speak another language Native:
3.1% (7)Foreign-born:
73.5% (49)
Two or more races - Speak another language Native:
1.0% (10)Foreign-born:
100.0% (8)
White alone - Speak only English Native:
99.0% (11,123)Foreign-born:
69.3% (67)
White alone - Speak another language Native:
0.9% (105)Foreign-born:
20.3% (20)
Hispanic or Latino - Speak only English Native:
76.8% (207)Foreign-born:
37.4% (20)
Hispanic or Latino - Speak another language Native:
23.2% (63)Foreign-born:
64.9% (34)
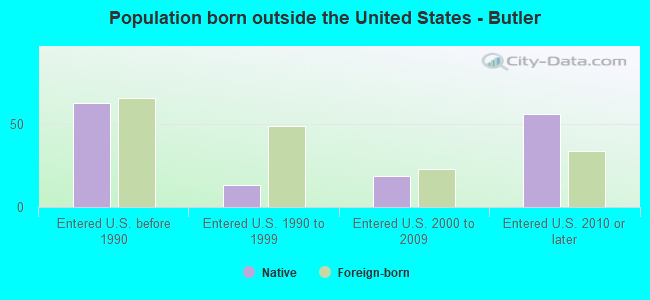
Foreign-born residents in Butler 294 residents are foreign born (0.8% Asia , 0.5% Europe , 0.4% North America , 0.3% Latin America ).
This city:
2.2%Pennsylvania:
7.3%
Marital status for residents in Butler Marital status - White (Caucasian) population 15 years and over
Males 46.3% Never married33.5% Now married2.8% Separated1.6% Widowed15.8% DivorcedFemales 38.9% Never married30.8% Now married1.2% Separated10.4% Widowed18.6% DivorcedWomen who gave birth in the past 12 months Now married:
65.5% (56)Unmarried:
34.5% (30)
Women who did not give birth in the past 12 months Now married:
29.5% (757)Unmarried:
70.5% (1,808)
Marital status - Black or African American population 15 years and over
Males 57.7% Never married16.0% Now married4.5% Separated5.1% Widowed16.7% DivorcedFemales 65.1% Never married13.8% Now married0.0% Separated21.1% Widowed0.0% DivorcedWomen who did not give birth in the past 12 months Now married:
21.1% (14)Unmarried:
78.9% (54)
Marital status - Asian population 15 years and over
Males 100.0% Never married0.0% Now married0.0% Separated0.0% Widowed0.0% DivorcedFemales 0.0% Never married100.0% Now married0.0% Separated0.0% Widowed0.0% DivorcedWomen who did not give birth in the past 12 months Now married:
100.0% (16)Unmarried:
0.0% (0)
Marital status - Other race population 15 years and over
Males 85.7% Never married14.3% Now married0.0% Separated0.0% Widowed0.0% DivorcedFemales 40.9% Never married59.1% Now married0.0% Separated0.0% Widowed0.0% DivorcedWomen who did not give birth in the past 12 months Now married:
59.1% (16)Unmarried:
40.9% (11)
Marital status - Two or more races population 15 years and over
Males 90.3% Never married9.7% Now married0.0% Separated0.0% Widowed0.0% DivorcedFemales 48.9% Never married32.0% Now married0.0% Separated4.0% Widowed15.1% DivorcedWomen who gave birth in the past 12 months Now married:
100.0% (1)Unmarried:
0.0% (0)
Women who did not give birth in the past 12 months Now married:
39.4% (100)Unmarried:
60.6% (153)
Marital status - White alone, not Hispanic / Latino population 15 years and over
Males 46.3% Never married33.4% Now married2.8% Separated1.7% Widowed15.9% DivorcedFemales 38.5% Never married31.0% Now married1.2% Separated10.5% Widowed18.8% DivorcedWomen who gave birth in the past 12 months Now married:
65.5% (57)Unmarried:
34.5% (30)
Women who did not give birth in the past 12 months Now married:
29.9% (764)Unmarried:
70.1% (1,789)
Marital status - Hispanic or Latino population 15 years and over
Males 92.0% Never married8.0% Now married0.0% Separated0.0% Widowed0.0% DivorcedFemales 74.5% Never married25.5% Now married0.0% Separated0.0% Widowed0.0% DivorcedWomen who did not give birth in the past 12 months Now married:
25.5% (14)Unmarried:
74.5% (40)
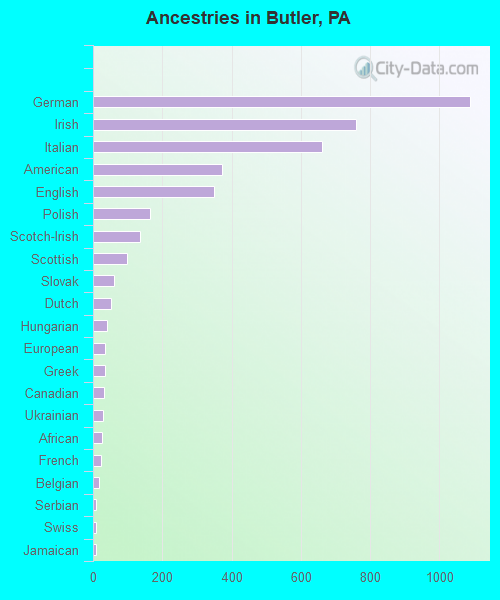
Ancestries in Butler
1,089 23.5% German758 16.3% Irish661 14.2% Italian372 8.0% American349 7.5% English166 3.6% Polish137 3.0% Scotch-Irish99 2.1% Scottish62 1.3% Slovak51 1.1% Dutch41 0.9% Hungarian35 0.8% European34 0.7% Greek32 0.7% Canadian29 0.6% Ukrainian25 0.5% African24 0.5% French17 0.4% Belgian10 0.2% Serbian10 0.2% Swiss10 0.2% Jamaican8 0.2% Russian3 0.06% French Canadian3 0.06% Norwegian
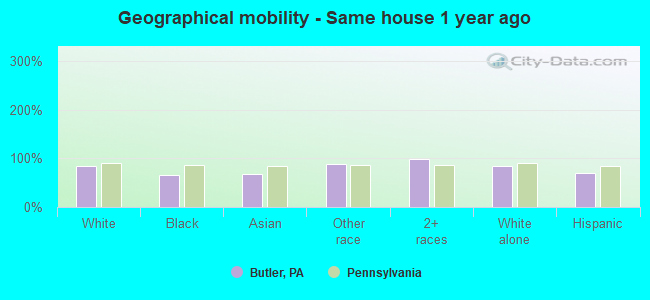
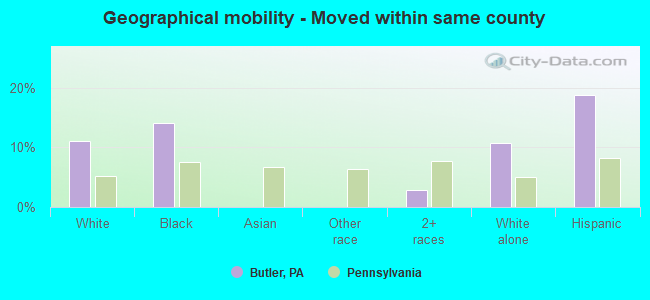
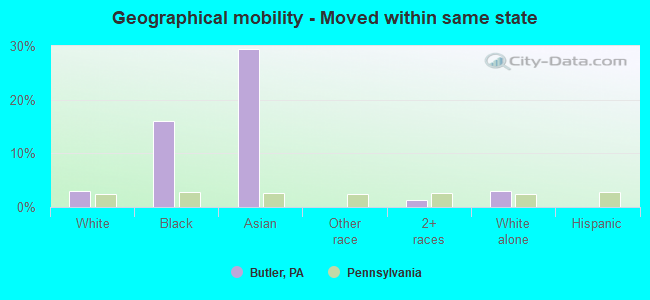
Geographical mobility in Butler Same house 1 year ago 9,992 83.4% White (Caucasian)229 66.3% Black or African American47 68.1% Asian254 87.6% Other race1,073 98.4% Two or more races9,906 83.9% White alone, not Hispanic / Latino285 70.7% Hispanic or LatinoMoved within same county 1,323 11.0% White / Caucasian49 14.1% Black or African American32 2.9% Two or more races1,274 10.8% White alone, not Hispanic / Latino76 18.8% Hispanic or LatinoMoved within same state 351 2.9% White / Caucasian55 16.0% Black or African American21 29.5% Asian15 1.3% Two or more races347 2.9% White alone, not Hispanic / LatinoMoved from different state 262 2.2% White / Caucasian46 15.8% Other race232 2.0% White alone, not Hispanic / Latino41 10.1% Hispanic or LatinoMoved from abroad 60 0.5% White64 0.5% White alone, not Hispanic / Latino
Children Nativity (place of birth) in Butler
Children under 6 years - Living with two parents Both parents native 385 100.0% NativeOne native, one foreign-born parent 29 100.0% NativeChildren under 6 years - Living with one parent Native parent 343 100.0% NativeForeign-born parent 79 100.0% NativeChildren 6 to 17 years - Living with two parents Both parents native 962 100.0% NativeOne native, one foreign-born parent 108 100.0% NativeChildren 6 to 17 years - Living with one parent Native parent 578 100.0% NativeForeign-born parent 28 52.6% Native26 47.4% Foreign-born
Grandparents responsible for own grandchildren in Butler
Grandparents (30 to 59 years) White / Caucasian 39 26.1% Responsible for grandchildren109 73.9% Not responsible for grandchildrenWhite alone, not Hispanic / Latino 41 26.3% Responsible for grandchildren115 73.7% Not responsible for grandchildrenGrandparents (60 years and over) White / Caucasian 37 60.3% Responsible for grandchildren24 39.7% Not responsible for grandchildrenWhite alone, not Hispanic / Latino 37 59.5% Responsible for grandchildren25 40.5% Not responsible for grandchildren