Races in Byram, Connecticut (CT) Detailed Stats
Data:
Races - White alone (%)
Races - White alone (% change since 2000)
Races - Black alone (%)
Races - Black alone (% change since 2000)
Races - American Indian alone (%)
Races - American Indian alone (% change since 2000)
Races - Asian alone (%)
Races - Asian alone (% change since 2000)
Races - Hispanic (%)
Races - Hispanic (% change since 2000)
Races - Native Hawaiian and Other Pacific Islander alone (%)
Races - Native Hawaiian and Other Pacific Islander alone (% change since 2000)
Races - Two or more races(%)
Races - Two or more races(% change since 2000)
Races - Other race alone (%)
Races - Other race alone (% change since 2000)
Racial diversity
Place of birth - Born in state of residence (%)
Place of birth - Born in state of residence (%) - White
Place of birth - Born in state of residence (%) - Black or African American
Place of birth - Born in state of residence (%) - Asian
Place of birth - Born in state of residence (%) - Hispanic or Latino
Place of birth - Born in state of residence (%) - American Indian and Alaska Native
Place of birth - Born in state of residence (%) - Multirace
Place of birth - Born in state of residence (%) - Other Race
Place of birth - Born in other state (%)
Place of birth - Born in other state (%) - White
Place of birth - Born in other state (%) - Black or African American
Place of birth - Born in other state (%) - Asian
Place of birth - Born in other state (%) - Hispanic or Latino
Place of birth - Born in other state (%) - American Indian and Alaska Native
Place of birth - Born in other state (%) - Multirace
Place of birth - Born in other state (%) - Other Race
Place of birth - Native, outside of US (%)
Place of birth - Native, outside of US (%) - White
Place of birth - Native, outside of US (%) - Black or African American
Place of birth - Native, outside of US (%) - Asian
Place of birth - Native, outside of US (%) - Hispanic or Latino
Place of birth - Native, outside of US (%) - American Indian and Alaska Native
Place of birth - Native, outside of US (%) - Multirace
Place of birth - Native, outside of US (%) - Other Race
Place of birth - Foreign born (%)
Place of birth - Foreign born (%) - White
Place of birth - Foreign born (%) - Black or African American
Place of birth - Foreign born (%) - Asian
Place of birth - Foreign born (%) - Hispanic or Latino
Place of birth - Foreign born (%) - American Indian and Alaska Native
Place of birth - Foreign born (%) - Multirace
Place of birth - Foreign born (%) - Other Race
Residents speaking English at home (%)
Residents speaking English at home - Born in the United States (%)
Residents speaking English at home - Native, born elsewhere (%)
Residents speaking English at home - Foreign born (%)
Residents speaking Spanish at home (%)
Residents speaking Spanish at home - Born in the United States (%)
Residents speaking Spanish at home - Native, born elsewhere (%)
Residents speaking Spanish at home - Foreign born (%)
Residents speaking other language at home (%)
Residents speaking other language at home - Born in the United States (%)
Residents speaking other language at home - Native, born elsewhere (%)
Residents speaking other language at home - Foreign born (%)
Marital status - Never married (%)
Marital status - Now married (%)
Marital status - Separated (%)
Marital status - Widowed (%)
Marital status - Divorced (%)
Ancestries Reported - Arab (%)
Ancestries Reported - Czech (%)
Ancestries Reported - Danish (%)
Ancestries Reported - Dutch (%)
Ancestries Reported - English (%)
Ancestries Reported - French (%)
Ancestries Reported - French Canadian (%)
Ancestries Reported - German (%)
Ancestries Reported - Greek (%)
Ancestries Reported - Hungarian (%)
Ancestries Reported - Irish (%)
Ancestries Reported - Italian (%)
Ancestries Reported - Lithuanian (%)
Ancestries Reported - Norwegian (%)
Ancestries Reported - Polish (%)
Ancestries Reported - Portuguese (%)
Ancestries Reported - Russian (%)
Ancestries Reported - Scotch-Irish (%)
Ancestries Reported - Scottish (%)
Ancestries Reported - Slovak (%)
Ancestries Reported - Subsaharan African (%)
Ancestries Reported - Swedish (%)
Ancestries Reported - Swiss (%)
Ancestries Reported - Ukrainian (%)
Ancestries Reported - United States (%)
Ancestries Reported - Welsh (%)
Ancestries Reported - West Indian (%)
Ancestries Reported - Other (%)
Geographical mobility - Same house 1 year ago (%)
Geographical mobility - Same house 1 year ago (%) - White
Geographical mobility - Same house 1 year ago (%) - Black or African American
Geographical mobility - Same house 1 year ago (%) - Asian
Geographical mobility - Same house 1 year ago (%) - Hispanic or Latino
Geographical mobility - Same house 1 year ago (%) - American Indian and Alaska Native
Geographical mobility - Same house 1 year ago (%) - Multirace
Geographical mobility - Same house 1 year ago (%) - Other Race
Geographical mobility - Moved within same county (%)
Geographical mobility - Moved within same county (%) - White
Geographical mobility - Moved within same county (%) - Black or African American
Geographical mobility - Moved within same county (%) - Asian
Geographical mobility - Moved within same county (%) - Hispanic or Latino
Geographical mobility - Moved within same county (%) - American Indian and Alaska Native
Geographical mobility - Moved within same county (%) - Multirace
Geographical mobility - Moved within same county (%) - Other Race
Geographical mobility - Moved from different county within same state (%)
Geographical mobility - Moved from different county within same state (%) - White
Geographical mobility - Moved from different county within same state (%) - Black or African American
Geographical mobility - Moved from different county within same state (%) - Asian
Geographical mobility - Moved from different county within same state (%) - Hispanic or Latino
Geographical mobility - Moved from different county within same state (%) - American Indian and Alaska Native
Geographical mobility - Moved from different county within same state (%) - Multirace
Geographical mobility - Moved from different county within same state (%) - Other Race
Geographical mobility - Moved from different state (%)
Geographical mobility - Moved from different state (%) - White
Geographical mobility - Moved from different state (%) - Black or African American
Geographical mobility - Moved from different state (%) - Asian
Geographical mobility - Moved from different state (%) - Hispanic or Latino
Geographical mobility - Moved from different state (%) - American Indian and Alaska Native
Geographical mobility - Moved from different state (%) - Multirace
Geographical mobility - Moved from different state (%) - Other Race
Geographical mobility - Moved from abroad (%)
Geographical mobility - Moved from abroad (%) - White
Geographical mobility - Moved from abroad (%) - Black or African American
Geographical mobility - Moved from abroad (%) - Asian
Geographical mobility - Moved from abroad (%) - Hispanic or Latino
Geographical mobility - Moved from abroad (%) - American Indian and Alaska Native
Geographical mobility - Moved from abroad (%) - Multirace
Geographical mobility - Moved from abroad (%) - Other Race
Place of birth for the foreign-born population - Ireland (%)
Place of birth for the foreign-born population - Denmark (%)
Place of birth for the foreign-born population - Norway (%)
Place of birth for the foreign-born population - Sweden (%)
Place of birth for the foreign-born population - United Kingdom (%)
Place of birth for the foreign-born population - England (%)
Place of birth for the foreign-born population - Scotland (%)
Place of birth for the foreign-born population - Other Northern Europe (%)
Place of birth for the foreign-born population - Austria (%)
Place of birth for the foreign-born population - Belgium (%)
Place of birth for the foreign-born population - France (%)
Place of birth for the foreign-born population - Germany (%)
Place of birth for the foreign-born population - Netherlands (%)
Place of birth for the foreign-born population - Switzerland (%)
Place of birth for the foreign-born population - Other Western Europe (%)
Place of birth for the foreign-born population - Greece (%)
Place of birth for the foreign-born population - Italy (%)
Place of birth for the foreign-born population - Portugal (%)
Place of birth for the foreign-born population - Spain (%)
Place of birth for the foreign-born population - Other Southern Europe (%)
Place of birth for the foreign-born population - Albania (%)
Place of birth for the foreign-born population - Belarus (%)
Place of birth for the foreign-born population - Bosnia and Herzegovina (%)
Place of birth for the foreign-born population - Bulgaria (%)
Place of birth for the foreign-born population - Croatia (%)
Place of birth for the foreign-born population - Czechoslovakia (%)
Place of birth for the foreign-born population - Hungary (%)
Place of birth for the foreign-born population - Latvia (%)
Place of birth for the foreign-born population - Lithuania (%)
Place of birth for the foreign-born population - North Macedonia (Macedonia) (%)
Place of birth for the foreign-born population - Moldova (%)
Place of birth for the foreign-born population - Poland (%)
Place of birth for the foreign-born population - Romania (%)
Place of birth for the foreign-born population - Russia (%)
Place of birth for the foreign-born population - Serbia (%)
Place of birth for the foreign-born population - Ukraine (%)
Place of birth for the foreign-born population - Other Eastern Europe (%)
Place of birth for the foreign-born population - China (%)
Place of birth for the foreign-born population - Hong Kong (%)
Place of birth for the foreign-born population - Taiwan (%)
Place of birth for the foreign-born population - Japan (%)
Place of birth for the foreign-born population - Korea (%)
Place of birth for the foreign-born population - Other Eastern Asia (%)
Place of birth for the foreign-born population - Afghanistan (%)
Place of birth for the foreign-born population - Bangladesh (%)
Place of birth for the foreign-born population - India (%)
Place of birth for the foreign-born population - Iran (%)
Place of birth for the foreign-born population - Kazakhstan (%)
Place of birth for the foreign-born population - Nepal (%)
Place of birth for the foreign-born population - Pakistan (%)
Place of birth for the foreign-born population - Sri Lanka (%)
Place of birth for the foreign-born population - Uzbekistan (%)
Place of birth for the foreign-born population - Other South Central Asia (%)
Place of birth for the foreign-born population - Burma (%)
Place of birth for the foreign-born population - Cambodia (%)
Place of birth for the foreign-born population - Indonesia (%)
Place of birth for the foreign-born population - Laos (%)
Place of birth for the foreign-born population - Malaysia (%)
Place of birth for the foreign-born population - Philippines (%)
Place of birth for the foreign-born population - Singapore (%)
Place of birth for the foreign-born population - Thailand (%)
Place of birth for the foreign-born population - Vietnam (%)
Place of birth for the foreign-born population - Other South Eastern Asia (%)
Place of birth for the foreign-born population - Armenia (%)
Place of birth for the foreign-born population - Iraq (%)
Place of birth for the foreign-born population - Israel (%)
Place of birth for the foreign-born population - Jordan (%)
Place of birth for the foreign-born population - Kuwait (%)
Place of birth for the foreign-born population - Lebanon (%)
Place of birth for the foreign-born population - Saudi Arabia (%)
Place of birth for the foreign-born population - Syria (%)
Place of birth for the foreign-born population - Turkey (%)
Place of birth for the foreign-born population - Yemen (%)
Place of birth for the foreign-born population - Other Western Asia (%)
Place of birth for the foreign-born population - Eritrea (%)
Place of birth for the foreign-born population - Ethiopia (%)
Place of birth for the foreign-born population - Kenya (%)
Place of birth for the foreign-born population - Somalia (%)
Place of birth for the foreign-born population - Uganda (%)
Place of birth for the foreign-born population - Zimbabwe (%)
Place of birth for the foreign-born population - Other Eastern Africa (%)
Place of birth for the foreign-born population - Cameroon (%)
Place of birth for the foreign-born population - Congo (%)
Place of birth for the foreign-born population - Democratic Republic of Congo (Zaire) (%)
Place of birth for the foreign-born population - Other Middle Africa (%)
Place of birth for the foreign-born population - Egypt (%)
Place of birth for the foreign-born population - Morocco (%)
Place of birth for the foreign-born population - Sudan (%)
Place of birth for the foreign-born population - Other Northern Africa (%)
Place of birth for the foreign-born population - South Africa (%)
Place of birth for the foreign-born population - Other Southern Africa (%)
Place of birth for the foreign-born population - Cabo Verde (%)
Place of birth for the foreign-born population - Ghana (%)
Place of birth for the foreign-born population - Liberia (%)
Place of birth for the foreign-born population - Nigeria (%)
Place of birth for the foreign-born population - Senegal (%)
Place of birth for the foreign-born population - Sierra Leone (%)
Place of birth for the foreign-born population - Other Western Africa (%)
Place of birth for the foreign-born population - Australia (%)
Place of birth for the foreign-born population - New Zealand (%)
Place of birth for the foreign-born population - Fiji (%)
Place of birth for the foreign-born population - Micronesia (%)
Place of birth for the foreign-born population - Bahamas (%)
Place of birth for the foreign-born population - Barbados (%)
Place of birth for the foreign-born population - Cuba (%)
Place of birth for the foreign-born population - Dominica (%)
Place of birth for the foreign-born population - Dominican Republic (%)
Place of birth for the foreign-born population - Grenada (%)
Place of birth for the foreign-born population - Haiti (%)
Place of birth for the foreign-born population - Jamaica (%)
Place of birth for the foreign-born population - St. Vincent and the Grenadines (%)
Place of birth for the foreign-born population - Trinidad and Tobago (%)
Place of birth for the foreign-born population - West Indies (%)
Place of birth for the foreign-born population - Other Caribbean (%)
Place of birth for the foreign-born population - Belize (%)
Place of birth for the foreign-born population - Costa Rica (%)
Place of birth for the foreign-born population - El Salvador (%)
Place of birth for the foreign-born population - Guatemala (%)
Place of birth for the foreign-born population - Honduras (%)
Place of birth for the foreign-born population - Mexico (%)
Place of birth for the foreign-born population - Nicaragua (%)
Place of birth for the foreign-born population - Panama (%)
Place of birth for the foreign-born population - Other Central America (%)
Place of birth for the foreign-born population - Argentina (%)
Place of birth for the foreign-born population - Bolivia (%)
Place of birth for the foreign-born population - Brazil (%)
Place of birth for the foreign-born population - Chile (%)
Place of birth for the foreign-born population - Colombia (%)
Place of birth for the foreign-born population - Ecuador (%)
Place of birth for the foreign-born population - Guyana (%)
Place of birth for the foreign-born population - Peru (%)
Place of birth for the foreign-born population - Uruguay (%)
Place of birth for the foreign-born population - Venezuela (%)
Place of birth for the foreign-born population - Other South America (%)
Place of birth for the foreign-born population - Canada (%)
Place of birth for the foreign-born population - Other Northern America (%)
Place of birth for the foreign-born population - Other (%)
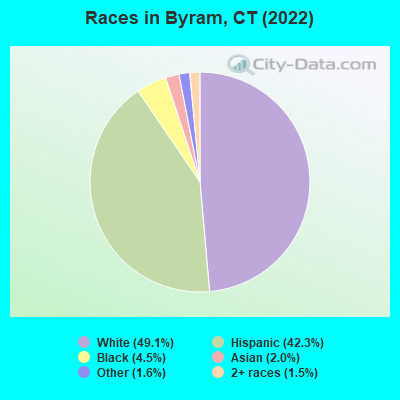
According to 2022 data, the most numerous races in Byram, CT are White alone (2,607 residents), Hispanic (2,246 residents), and Black alone (237 residents). 52.8% of Byram residents speak English at home.
Race distribution in Byram 2,607 49.1% White alone 2,246 42.3% Hispanic 237 4.5% Black alone 108 2.0% Asian alone 83 1.6% Other race alone 77 1.5% Two or more races
2000 2022
2,638,845 77.5% White alone 320,323 9.4% Hispanic 295,571 8.7% Black alone 81,564 2.4% Asian alone 52,896 1.6% Two or more races 8,141 0.2% Other race alone 7,267 0.2% American Indian alone 958 0.03% Native Hawaiian and Other
2,246,913 62.0% White alone 658,978 18.2% Hispanic 353,973 9.8% Black alone 172,929 4.8% Asian alone 159,631 4.4% Two or more races 29,761 0.8% Other race alone 3,428 0.09% American Indian alone 592 0.02% Native Hawaiian and Other
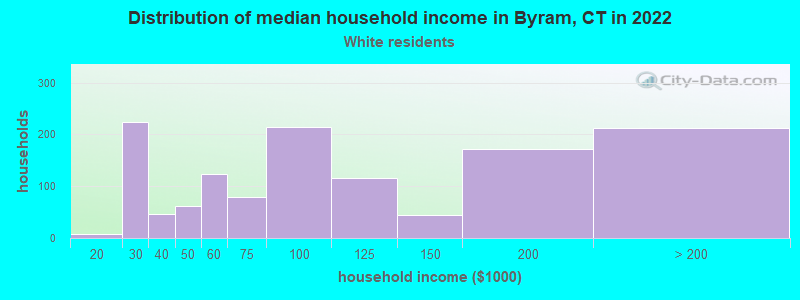
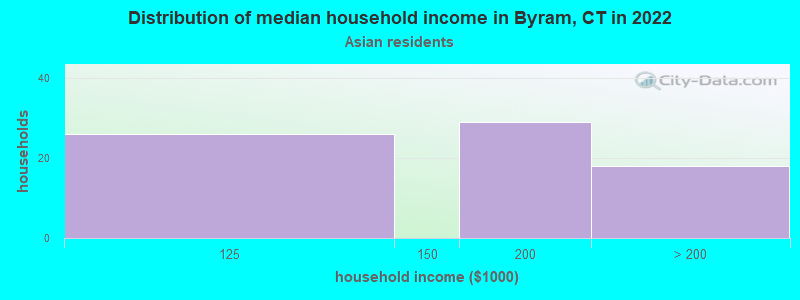
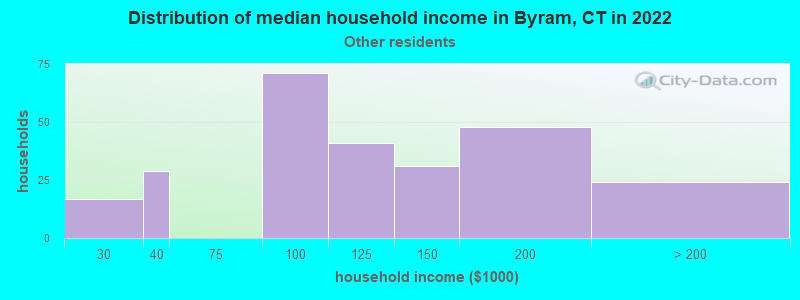
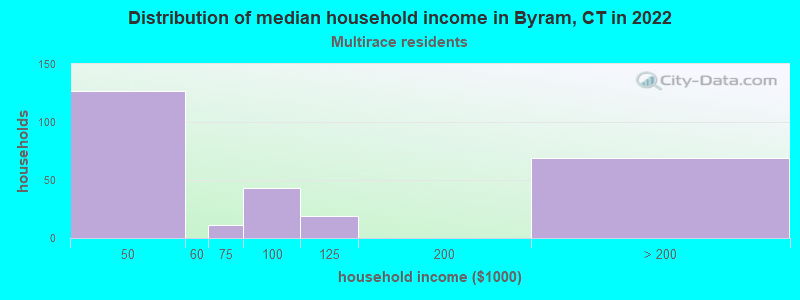
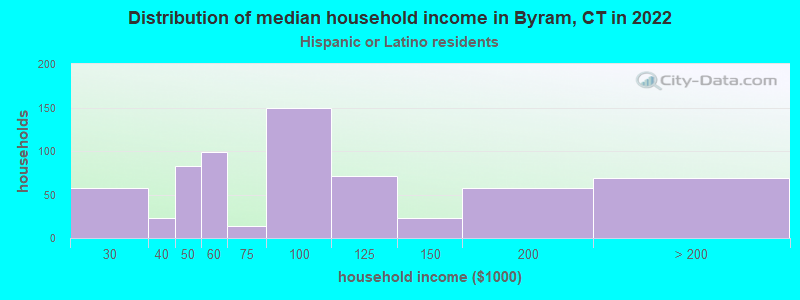
Income and house value in Byram Median household income in 2022 $90,661 White non-Hispanic householders$165,687 Asian householders$119,328 Some other race householders$84,360 Hispanic or Latino race householders
Median age by race in Byram
38.8 Median age for White residents34.7 42.4 18.1 Median age for Black or African American residents6.0 44.0 -742,173,111.6 Median age for American Indian / Alaska Native residents-701,030,927.1 -704,477,611.2 68.1 Median age for Asian residents76.3 56.3 -641,269,840.6 Median age for Native Hawaiian / Pacific Islander residents-414,239,481.8 -691,588,784.4 31.9 Median age for Other race residents34.8 28.9 33.5 Median age for Two or more races residents22.3 45.3 41.3 Median age for White alone residents33.9 48.6 32.0 Median age for Hispanic or Latino residents34.1 30.1
Owner/renter occupied households by race in Byram
House owners and renters - White residents 529 40.7% Owner occupied770 59.3% Renter occupiedHouse owners and renters - Black or African American residents 31 100.0% Renter occupiedHouse owners and renters - Asian residents 53 73.2% Owner occupied19 26.8% Renter occupiedHouse owners and renters - Other race residents 26 11.6% Owner occupied195 88.4% Renter occupiedHouse owners and renters - Two or more races residents 81 33.5% Owner occupied161 66.5% Renter occupiedHouse owners and renters - White alone residents 524 47.3% Owner occupied584 52.7% Renter occupiedHouse owners and renters - Hispanic or Latino residents 96 16.0% Owner occupied503 84.0% Renter occupied
Language usage in Byram
English speakers - Total 52.8% of residents of Byram speak English at home.
38.2% of residents speak Spanish at home 962 50.2% Speak English very well956 49.8% Speak English less than very well10.4% of residents speak other language at home 407 77.7% Speak English very well117 22.3% Speak English less than very well
English speakers - Born in the United States 80.7% of residents of Byram speak English at home.
18.0% of residents speak Spanish at home 187 61.7% Speak English very well116 38.3% Speak English less than very well3.3% of residents speak other language at home 56 100.0% Speak English very well
English speakers - Native, born elsewhere 52.6% of residents of Byram speak English at home.
34.2% of residents speak Spanish at home 15 57.7% Speak English very well11 42.3% Speak English less than very well18.4% of residents speak other language at home 14 100.0% Speak English very well
English speakers - Foreign-born 9.3% of residents of Byram speak English at home.
70.2% of residents speak Spanish at home 494 36.8% Speak English very well848 63.2% Speak English less than very well22.5% of residents speak other language at home 314 72.9% Speak English very well117 27.1% Speak English less than very well
White (Caucasian) - Speak only English Native:
88.7% (2,213)Foreign-born:
7.1% (43)
White (Caucasian) - Speak another language Native:
9.9% (247)Foreign-born:
88.7% (546)
Black or African American - Speak only English Native:
76.3% (63)Foreign-born:
100.0% (118)
Asian - Speak only English Native:
100.0% (14)Foreign-born:
13.4% (13)
Other race - Speak another language Native:
89.3% (227)Foreign-born:
100.0% (610)
Two or more races - Speak another language Native:
55.4% (186)Foreign-born:
100.0% (568)
White alone - Speak only English Native:
95.6% (2,104)Foreign-born:
14.2% (45)
White alone - Speak another language Native:
4.4% (98)Foreign-born:
85.2% (269)
Hispanic or Latino - Speak another language Native:
70.4% (565)Foreign-born:
100.0% (1,339)
Foreign-born residents in Byram
Marital status for residents in Byram Marital status - White (Caucasian) population 15 years and over
Males 39.8% Never married43.0% Now married1.5% Separated3.6% Widowed12.0% DivorcedFemales 36.0% Never married35.6% Now married0.0% Separated14.2% Widowed14.2% DivorcedWomen who gave birth in the past 12 months Now married:
60.0% (44)Unmarried:
40.0% (29)
Women who did not give birth in the past 12 months Now married:
23.5% (159)Unmarried:
76.5% (516)
Marital status - Black or African American population 15 years and over
Males 37.7% Never married62.3% Now married0.0% Separated0.0% Widowed0.0% DivorcedFemales 28.8% Never married32.7% Now married0.0% Separated38.5% Widowed0.0% DivorcedWomen who gave birth in the past 12 months Now married:
100.0% (33)Unmarried:
0.0% (0)
Women who did not give birth in the past 12 months Now married:
0.0% (0)Unmarried:
100.0% (29)
Marital status - Asian population 15 years and over
Males 0.0% Never married100.0% Now married0.0% Separated0.0% Widowed0.0% DivorcedFemales 0.0% Never married100.0% Now married0.0% Separated0.0% Widowed0.0% DivorcedWomen who did not give birth in the past 12 months Now married:
100.0% (19)Unmarried:
0.0% (0)
Marital status - Other race population 15 years and over
Males 46.2% Never married53.8% Now married0.0% Separated0.0% Widowed0.0% DivorcedFemales 29.8% Never married58.2% Now married6.2% Separated0.0% Widowed5.8% DivorcedWomen who gave birth in the past 12 months Now married:
52.5% (38)Unmarried:
47.5% (34)
Women who did not give birth in the past 12 months Now married:
65.3% (162)Unmarried:
34.7% (86)
Marital status - Two or more races population 15 years and over
Males 51.9% Never married48.1% Now married0.0% Separated0.0% Widowed0.0% DivorcedFemales 25.8% Never married48.4% Now married0.0% Separated5.9% Widowed19.9% DivorcedWomen who did not give birth in the past 12 months Now married:
48.0% (130)Unmarried:
52.0% (141)
Marital status - White alone, not Hispanic / Latino population 15 years and over
Males 40.9% Never married45.8% Now married1.9% Separated4.4% Widowed7.0% DivorcedFemales 27.7% Never married43.5% Now married0.0% Separated18.3% Widowed10.5% DivorcedWomen who gave birth in the past 12 months Now married:
100.0% (46)Unmarried:
0.0% (0)
Women who did not give birth in the past 12 months Now married:
27.8% (119)Unmarried:
72.2% (310)
Marital status - Hispanic or Latino population 15 years and over
Males 45.1% Never married42.7% Now married0.0% Separated0.0% Widowed12.1% DivorcedFemales 40.1% Never married35.8% Now married1.9% Separated3.3% Widowed18.9% DivorcedWomen who gave birth in the past 12 months Now married:
17.8% (14)Unmarried:
82.2% (63)
Women who did not give birth in the past 12 months Now married:
41.4% (273)Unmarried:
58.6% (387)
Ancestries in Byram
241 9.0% American156 5.8% Italian147 5.5% Irish80 3.0% Brazilian67 2.5% English45 1.7% Ukrainian44 1.6% Jamaican38 1.4% Polish32 1.2% Welsh29 1.1% German28 1.0% Slovak27 1.0% Portuguese22 0.8% Scottish20 0.7% Eastern European19 0.7% Serbian18 0.7% Lebanese18 0.7% European11 0.4% French Canadian11 0.4% Scotch-Irish9 0.3% Russian7 0.3% Australian
Children Nativity (place of birth) in Byram
Children under 6 years - Living with two parents Both parents native 97 100.0% NativeBoth parents foreign-born 95 97.6% Native2 2.4% Foreign-bornOne native, one foreign-born parent 37 100.0% NativeChildren under 6 years - Living with one parent Native parent 47 100.0% NativeForeign-born parent 55 100.0% NativeChildren 6 to 17 years - Living with two parents Both parents native 116 93.7% Native8 6.3% Foreign-bornBoth parents foreign-born 246 84.8% Native44 15.2% Foreign-bornChildren 6 to 17 years - Living with one parent Native parent 210 100.0% NativeForeign-born parent 281 50.8% Native272 49.2% Foreign-born
Grandparents responsible for own grandchildren in Byram
Grandparents (30 to 59 years) White / Caucasian 17 100.0% Responsible for grandchildrenHispanic or Latino 23 100.0% Responsible for grandchildren
Grandparents (60 years and over) White / Caucasian 21 100.0% Not responsible for grandchildrenHispanic or Latino 24 100.0% Not responsible for grandchildren