Races in Cache, Oklahoma (OK) Detailed Stats Ancestries, Foreign-born residents, place of birth
Data:
Races - White alone (%)
Races - White alone (% change since 2000)
Races - Black alone (%)
Races - Black alone (% change since 2000)
Races - American Indian alone (%)
Races - American Indian alone (% change since 2000)
Races - Asian alone (%)
Races - Asian alone (% change since 2000)
Races - Hispanic (%)
Races - Hispanic (% change since 2000)
Races - Native Hawaiian and Other Pacific Islander alone (%)
Races - Native Hawaiian and Other Pacific Islander alone (% change since 2000)
Races - Two or more races(%)
Races - Two or more races(% change since 2000)
Races - Other race alone (%)
Races - Other race alone (% change since 2000)
Racial diversity
Place of birth - Born in state of residence (%)
Place of birth - Born in state of residence (%) - White
Place of birth - Born in state of residence (%) - Black or African American
Place of birth - Born in state of residence (%) - Asian
Place of birth - Born in state of residence (%) - Hispanic or Latino
Place of birth - Born in state of residence (%) - American Indian and Alaska Native
Place of birth - Born in state of residence (%) - Multirace
Place of birth - Born in state of residence (%) - Other Race
Place of birth - Born in other state (%)
Place of birth - Born in other state (%) - White
Place of birth - Born in other state (%) - Black or African American
Place of birth - Born in other state (%) - Asian
Place of birth - Born in other state (%) - Hispanic or Latino
Place of birth - Born in other state (%) - American Indian and Alaska Native
Place of birth - Born in other state (%) - Multirace
Place of birth - Born in other state (%) - Other Race
Place of birth - Native, outside of US (%)
Place of birth - Native, outside of US (%) - White
Place of birth - Native, outside of US (%) - Black or African American
Place of birth - Native, outside of US (%) - Asian
Place of birth - Native, outside of US (%) - Hispanic or Latino
Place of birth - Native, outside of US (%) - American Indian and Alaska Native
Place of birth - Native, outside of US (%) - Multirace
Place of birth - Native, outside of US (%) - Other Race
Place of birth - Foreign born (%)
Place of birth - Foreign born (%) - White
Place of birth - Foreign born (%) - Black or African American
Place of birth - Foreign born (%) - Asian
Place of birth - Foreign born (%) - Hispanic or Latino
Place of birth - Foreign born (%) - American Indian and Alaska Native
Place of birth - Foreign born (%) - Multirace
Place of birth - Foreign born (%) - Other Race
Residents speaking English at home (%)
Residents speaking English at home - Born in the United States (%)
Residents speaking English at home - Native, born elsewhere (%)
Residents speaking English at home - Foreign born (%)
Residents speaking Spanish at home (%)
Residents speaking Spanish at home - Born in the United States (%)
Residents speaking Spanish at home - Native, born elsewhere (%)
Residents speaking Spanish at home - Foreign born (%)
Residents speaking other language at home (%)
Residents speaking other language at home - Born in the United States (%)
Residents speaking other language at home - Native, born elsewhere (%)
Residents speaking other language at home - Foreign born (%)
Marital status - Never married (%)
Marital status - Now married (%)
Marital status - Separated (%)
Marital status - Widowed (%)
Marital status - Divorced (%)
Ancestries Reported - Arab (%)
Ancestries Reported - Czech (%)
Ancestries Reported - Danish (%)
Ancestries Reported - Dutch (%)
Ancestries Reported - English (%)
Ancestries Reported - French (%)
Ancestries Reported - French Canadian (%)
Ancestries Reported - German (%)
Ancestries Reported - Greek (%)
Ancestries Reported - Hungarian (%)
Ancestries Reported - Irish (%)
Ancestries Reported - Italian (%)
Ancestries Reported - Lithuanian (%)
Ancestries Reported - Norwegian (%)
Ancestries Reported - Polish (%)
Ancestries Reported - Portuguese (%)
Ancestries Reported - Russian (%)
Ancestries Reported - Scotch-Irish (%)
Ancestries Reported - Scottish (%)
Ancestries Reported - Slovak (%)
Ancestries Reported - Subsaharan African (%)
Ancestries Reported - Swedish (%)
Ancestries Reported - Swiss (%)
Ancestries Reported - Ukrainian (%)
Ancestries Reported - United States (%)
Ancestries Reported - Welsh (%)
Ancestries Reported - West Indian (%)
Ancestries Reported - Other (%)
Geographical mobility - Same house 1 year ago (%)
Geographical mobility - Same house 1 year ago (%) - White
Geographical mobility - Same house 1 year ago (%) - Black or African American
Geographical mobility - Same house 1 year ago (%) - Asian
Geographical mobility - Same house 1 year ago (%) - Hispanic or Latino
Geographical mobility - Same house 1 year ago (%) - American Indian and Alaska Native
Geographical mobility - Same house 1 year ago (%) - Multirace
Geographical mobility - Same house 1 year ago (%) - Other Race
Geographical mobility - Moved within same county (%)
Geographical mobility - Moved within same county (%) - White
Geographical mobility - Moved within same county (%) - Black or African American
Geographical mobility - Moved within same county (%) - Asian
Geographical mobility - Moved within same county (%) - Hispanic or Latino
Geographical mobility - Moved within same county (%) - American Indian and Alaska Native
Geographical mobility - Moved within same county (%) - Multirace
Geographical mobility - Moved within same county (%) - Other Race
Geographical mobility - Moved from different county within same state (%)
Geographical mobility - Moved from different county within same state (%) - White
Geographical mobility - Moved from different county within same state (%) - Black or African American
Geographical mobility - Moved from different county within same state (%) - Asian
Geographical mobility - Moved from different county within same state (%) - Hispanic or Latino
Geographical mobility - Moved from different county within same state (%) - American Indian and Alaska Native
Geographical mobility - Moved from different county within same state (%) - Multirace
Geographical mobility - Moved from different county within same state (%) - Other Race
Geographical mobility - Moved from different state (%)
Geographical mobility - Moved from different state (%) - White
Geographical mobility - Moved from different state (%) - Black or African American
Geographical mobility - Moved from different state (%) - Asian
Geographical mobility - Moved from different state (%) - Hispanic or Latino
Geographical mobility - Moved from different state (%) - American Indian and Alaska Native
Geographical mobility - Moved from different state (%) - Multirace
Geographical mobility - Moved from different state (%) - Other Race
Geographical mobility - Moved from abroad (%)
Geographical mobility - Moved from abroad (%) - White
Geographical mobility - Moved from abroad (%) - Black or African American
Geographical mobility - Moved from abroad (%) - Asian
Geographical mobility - Moved from abroad (%) - Hispanic or Latino
Geographical mobility - Moved from abroad (%) - American Indian and Alaska Native
Geographical mobility - Moved from abroad (%) - Multirace
Geographical mobility - Moved from abroad (%) - Other Race
Place of birth for the foreign-born population - Ireland (%)
Place of birth for the foreign-born population - Denmark (%)
Place of birth for the foreign-born population - Norway (%)
Place of birth for the foreign-born population - Sweden (%)
Place of birth for the foreign-born population - United Kingdom (%)
Place of birth for the foreign-born population - England (%)
Place of birth for the foreign-born population - Scotland (%)
Place of birth for the foreign-born population - Other Northern Europe (%)
Place of birth for the foreign-born population - Austria (%)
Place of birth for the foreign-born population - Belgium (%)
Place of birth for the foreign-born population - France (%)
Place of birth for the foreign-born population - Germany (%)
Place of birth for the foreign-born population - Netherlands (%)
Place of birth for the foreign-born population - Switzerland (%)
Place of birth for the foreign-born population - Other Western Europe (%)
Place of birth for the foreign-born population - Greece (%)
Place of birth for the foreign-born population - Italy (%)
Place of birth for the foreign-born population - Portugal (%)
Place of birth for the foreign-born population - Spain (%)
Place of birth for the foreign-born population - Other Southern Europe (%)
Place of birth for the foreign-born population - Albania (%)
Place of birth for the foreign-born population - Belarus (%)
Place of birth for the foreign-born population - Bosnia and Herzegovina (%)
Place of birth for the foreign-born population - Bulgaria (%)
Place of birth for the foreign-born population - Croatia (%)
Place of birth for the foreign-born population - Czechoslovakia (%)
Place of birth for the foreign-born population - Hungary (%)
Place of birth for the foreign-born population - Latvia (%)
Place of birth for the foreign-born population - Lithuania (%)
Place of birth for the foreign-born population - North Macedonia (Macedonia) (%)
Place of birth for the foreign-born population - Moldova (%)
Place of birth for the foreign-born population - Poland (%)
Place of birth for the foreign-born population - Romania (%)
Place of birth for the foreign-born population - Russia (%)
Place of birth for the foreign-born population - Serbia (%)
Place of birth for the foreign-born population - Ukraine (%)
Place of birth for the foreign-born population - Other Eastern Europe (%)
Place of birth for the foreign-born population - China (%)
Place of birth for the foreign-born population - Hong Kong (%)
Place of birth for the foreign-born population - Taiwan (%)
Place of birth for the foreign-born population - Japan (%)
Place of birth for the foreign-born population - Korea (%)
Place of birth for the foreign-born population - Other Eastern Asia (%)
Place of birth for the foreign-born population - Afghanistan (%)
Place of birth for the foreign-born population - Bangladesh (%)
Place of birth for the foreign-born population - India (%)
Place of birth for the foreign-born population - Iran (%)
Place of birth for the foreign-born population - Kazakhstan (%)
Place of birth for the foreign-born population - Nepal (%)
Place of birth for the foreign-born population - Pakistan (%)
Place of birth for the foreign-born population - Sri Lanka (%)
Place of birth for the foreign-born population - Uzbekistan (%)
Place of birth for the foreign-born population - Other South Central Asia (%)
Place of birth for the foreign-born population - Burma (%)
Place of birth for the foreign-born population - Cambodia (%)
Place of birth for the foreign-born population - Indonesia (%)
Place of birth for the foreign-born population - Laos (%)
Place of birth for the foreign-born population - Malaysia (%)
Place of birth for the foreign-born population - Philippines (%)
Place of birth for the foreign-born population - Singapore (%)
Place of birth for the foreign-born population - Thailand (%)
Place of birth for the foreign-born population - Vietnam (%)
Place of birth for the foreign-born population - Other South Eastern Asia (%)
Place of birth for the foreign-born population - Armenia (%)
Place of birth for the foreign-born population - Iraq (%)
Place of birth for the foreign-born population - Israel (%)
Place of birth for the foreign-born population - Jordan (%)
Place of birth for the foreign-born population - Kuwait (%)
Place of birth for the foreign-born population - Lebanon (%)
Place of birth for the foreign-born population - Saudi Arabia (%)
Place of birth for the foreign-born population - Syria (%)
Place of birth for the foreign-born population - Turkey (%)
Place of birth for the foreign-born population - Yemen (%)
Place of birth for the foreign-born population - Other Western Asia (%)
Place of birth for the foreign-born population - Eritrea (%)
Place of birth for the foreign-born population - Ethiopia (%)
Place of birth for the foreign-born population - Kenya (%)
Place of birth for the foreign-born population - Somalia (%)
Place of birth for the foreign-born population - Uganda (%)
Place of birth for the foreign-born population - Zimbabwe (%)
Place of birth for the foreign-born population - Other Eastern Africa (%)
Place of birth for the foreign-born population - Cameroon (%)
Place of birth for the foreign-born population - Congo (%)
Place of birth for the foreign-born population - Democratic Republic of Congo (Zaire) (%)
Place of birth for the foreign-born population - Other Middle Africa (%)
Place of birth for the foreign-born population - Egypt (%)
Place of birth for the foreign-born population - Morocco (%)
Place of birth for the foreign-born population - Sudan (%)
Place of birth for the foreign-born population - Other Northern Africa (%)
Place of birth for the foreign-born population - South Africa (%)
Place of birth for the foreign-born population - Other Southern Africa (%)
Place of birth for the foreign-born population - Cabo Verde (%)
Place of birth for the foreign-born population - Ghana (%)
Place of birth for the foreign-born population - Liberia (%)
Place of birth for the foreign-born population - Nigeria (%)
Place of birth for the foreign-born population - Senegal (%)
Place of birth for the foreign-born population - Sierra Leone (%)
Place of birth for the foreign-born population - Other Western Africa (%)
Place of birth for the foreign-born population - Australia (%)
Place of birth for the foreign-born population - New Zealand (%)
Place of birth for the foreign-born population - Fiji (%)
Place of birth for the foreign-born population - Micronesia (%)
Place of birth for the foreign-born population - Bahamas (%)
Place of birth for the foreign-born population - Barbados (%)
Place of birth for the foreign-born population - Cuba (%)
Place of birth for the foreign-born population - Dominica (%)
Place of birth for the foreign-born population - Dominican Republic (%)
Place of birth for the foreign-born population - Grenada (%)
Place of birth for the foreign-born population - Haiti (%)
Place of birth for the foreign-born population - Jamaica (%)
Place of birth for the foreign-born population - St. Vincent and the Grenadines (%)
Place of birth for the foreign-born population - Trinidad and Tobago (%)
Place of birth for the foreign-born population - West Indies (%)
Place of birth for the foreign-born population - Other Caribbean (%)
Place of birth for the foreign-born population - Belize (%)
Place of birth for the foreign-born population - Costa Rica (%)
Place of birth for the foreign-born population - El Salvador (%)
Place of birth for the foreign-born population - Guatemala (%)
Place of birth for the foreign-born population - Honduras (%)
Place of birth for the foreign-born population - Mexico (%)
Place of birth for the foreign-born population - Nicaragua (%)
Place of birth for the foreign-born population - Panama (%)
Place of birth for the foreign-born population - Other Central America (%)
Place of birth for the foreign-born population - Argentina (%)
Place of birth for the foreign-born population - Bolivia (%)
Place of birth for the foreign-born population - Brazil (%)
Place of birth for the foreign-born population - Chile (%)
Place of birth for the foreign-born population - Colombia (%)
Place of birth for the foreign-born population - Ecuador (%)
Place of birth for the foreign-born population - Guyana (%)
Place of birth for the foreign-born population - Peru (%)
Place of birth for the foreign-born population - Uruguay (%)
Place of birth for the foreign-born population - Venezuela (%)
Place of birth for the foreign-born population - Other South America (%)
Place of birth for the foreign-born population - Canada (%)
Place of birth for the foreign-born population - Other Northern America (%)
Place of birth for the foreign-born population - Other (%)
Latest news about races in Cache, OK collected exclusively by city-data.com from local newspapers, TV, and radio stations
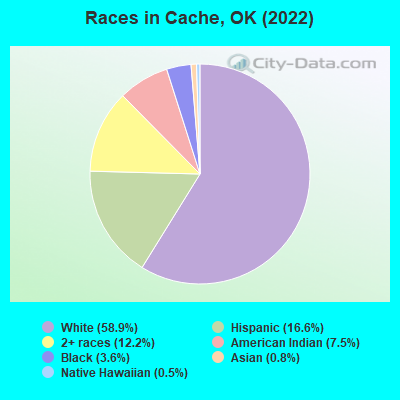
According to 2022 data, the most numerous races in Cache, OK are White alone (1,769 residents), Hispanic (499 residents), and Two or more races (366 residents). 93.9% of Cache residents speak English at home. 2.7% of Cache, OK residents are foreign-born (1.4% born in Latin America, 0.8% born in Europe, 0.6% born in Asia), which is 119.9% less than the foreign-born rate of 6.0% across the entire state of Oklahoma.
Race distribution in Cache
2000
2022
2,556,368 74.1% White alone
266,158 7.7% American Indian alone
257,981 7.5% Black alone
179,304 5.2% Hispanic
140,249 4.1% Two or more races
46,172 1.3% Asian alone
2,322 0.07% Other race alone
2,100 0.06% Native Hawaiian and Other Pacific Islander alone
2,517,403 62.6% White alone
486,692 12.1% Hispanic
364,453 9.1% Two or more races
273,650 6.8% American Indian alone
268,543 6.7% Black alone
92,672 2.3% Asian alone
10,786 0.3% Other race alone
5,601 0.1% Native Hawaiian and Other Pacific Islander alone
Income and house value in Cache Median household income in 2022 $59,607 White non-Hispanic householders
$33,003 American Indian and Alaska Native householders
$80,709 Two or more races householders
$54,795 Hispanic or Latino race householders
Median 2022 house value $157,741 White Non-Hispanic householders
$204,352 Black or African American householders
$142,531 American Indian or Alaska Native householders
$110,394 Asian householders
$183,990 Some other race householders
$159,458 Two or more races householders
$200,426 Hispanic or Latino householders
Median age by race in Cache
40.5 Median age for White residents39.4 Males41.9 Females43.0 Median age for Black or African American residents41.5 Males36.4 Females36.4 Median age for American Indian / Alaska Native residents38.9 Males43.4 Females39.0 Median age for Asian residents-442,798,353.5 Males-682,437,275.3 Females-757,396,448.9 Median age for Native Hawaiian / Pacific Islander residents-662,710,187.3 Males-767,251,461.2 Females28.8 Median age for Other race residents-623,323,012.8 Males30.1 Females23.6 Median age for Two or more races residents23.1 Males23.7 Females39.5 Median age for White alone residents36.6 Males42.1 Females37.5 Median age for Hispanic or Latino residents41.6 Males34.2 Females
Owner/renter occupied households by race in Cache
House owners and renters - White residents 633 73.3% Owner occupied230 26.7% Renter occupiedHouse owners and renters - Black or African American residents 54 100.0% Owner occupiedHouse owners and renters - American Indian / Alaska Native residents 64 54.5% Owner occupied53 45.5% Renter occupiedHouse owners and renters - Asian residents 4 100.0% Owner occupiedHouse owners and renters - Native Hawaiian / Pacific Islander residents 5 24.3% Owner occupied17 75.7% Renter occupiedHouse owners and renters - Other race residents 5 100.0% Owner occupiedHouse owners and renters - Two or more races residents 119 80.7% Owner occupied28 19.3% Renter occupiedHouse owners and renters - White alone residents 600 73.2% Owner occupied219 26.8% Renter occupiedHouse owners and renters - Hispanic or Latino residents 93 88.6% Owner occupied12 11.4% Renter occupied
Language usage in Cache
English speakers - Total 93.9% of residents of Cache speak English at home.
6.1% of residents speak Spanish at home 160 93.0% Speak English very well12 7.0% Speak English less than very well1.3% of residents speak other language at home 36 100.0% Speak English very well
English speakers - Born in the United States 85.6% of residents of Cache speak English at home.
12.9% of residents speak Spanish at home 134 92.4% Speak English very well11 7.6% Speak English less than very well1.8% of residents speak other language at home 20 100.0% Speak English very well
English speakers - Native, born elsewhere 91.9% of residents of Cache speak English at home.
8.1% of residents speak Spanish at home 8 100.0% Speak English very well
All residents speak only English at home
White (Caucasian) - Speak only English Native:
94.8% (1,712)Foreign-born:
84.4% (28)
Black or African American - Speak only English Native:
100.0% (92)Foreign-born:
100.0% (8)
Asian - Speak only English Native:
100.0% (8)Foreign-born:
100.0% (12)
Other race - Speak only English Native:
15.9% (7)Foreign-born:
100.0% (18)
White alone - Speak only English Native:
98.6% (1,613)Foreign-born:
79.6% (20)
Hispanic or Latino - Speak only English Native:
57.4% (250)Foreign-born:
100.0% (19)
Foreign-born residents in Cache 82 residents are foreign born (1.4% Latin America , 0.8% Europe , 0.6% Asia ).
This city:
2.7%Oklahoma:
6.1%
Marital status for residents in Cache Marital status - White (Caucasian) population 15 years and over
Males 20.0% Never married62.8% Now married0.7% Separated1.6% Widowed15.0% DivorcedFemales 20.4% Never married48.3% Now married8.5% Separated7.5% Widowed15.3% DivorcedWomen who gave birth in the past 12 months Now married:
73.9% (16)Unmarried:
26.1% (6)
Women who did not give birth in the past 12 months Now married:
51.7% (237)Unmarried:
48.3% (222)
Marital status - Black or African American population 15 years and over
Males 5.1% Never married72.2% Now married0.0% Separated22.8% Widowed0.0% DivorcedFemales 0.0% Never married80.6% Now married0.0% Separated0.0% Widowed19.4% DivorcedWomen who did not give birth in the past 12 months Now married:
80.6% (24)Unmarried:
19.4% (6)
Marital status - American Indian / Alaska Native population 15 years and over
Males 29.7% Never married22.8% Now married31.0% Separated6.9% Widowed9.7% DivorcedFemales 13.9% Never married28.7% Now married5.0% Separated14.9% Widowed37.6% DivorcedWomen who did not give birth in the past 12 months Now married:
43.5% (18)Unmarried:
56.5% (23)
Marital status - Asian population 15 years and over
Males 0.0% Never married100.0% Now married0.0% Separated0.0% Widowed0.0% DivorcedFemales 0.0% Never married100.0% Now married0.0% Separated0.0% Widowed0.0% DivorcedWomen who did not give birth in the past 12 months Now married:
100.0% (18)Unmarried:
0.0% (0)
Marital status - Native Hawaiian / Pacific Islander population 15 years and over
Males 100.0% Never married0.0% Now married0.0% Separated0.0% Widowed0.0% DivorcedFemales 100.0% Never married0.0% Now married0.0% Separated0.0% Widowed0.0% DivorcedWomen who did not give birth in the past 12 months Now married:
0.0% (0)Unmarried:
100.0% (4)
Marital status - Other race population 15 years and over
Males 0.0% Never married16.7% Now married83.3% Separated0.0% Widowed0.0% DivorcedFemales 53.3% Never married33.3% Now married0.0% Separated13.3% Widowed0.0% DivorcedWomen who gave birth in the past 12 months Now married:
0.0% (0)Unmarried:
100.0% (13)
Women who did not give birth in the past 12 months Now married:
53.6% (17)Unmarried:
46.4% (15)
Marital status - Two or more races population 15 years and over
Males 53.2% Never married46.8% Now married0.0% Separated0.0% Widowed0.0% DivorcedFemales 44.4% Never married48.1% Now married0.0% Separated0.0% Widowed7.5% DivorcedWomen who did not give birth in the past 12 months Now married:
40.8% (72)Unmarried:
59.2% (104)
Marital status - White alone, not Hispanic / Latino population 15 years and over
Males 19.0% Never married66.9% Now married0.8% Separated2.0% Widowed11.3% DivorcedFemales 19.7% Never married47.5% Now married8.4% Separated8.0% Widowed16.4% DivorcedWomen who gave birth in the past 12 months Now married:
73.9% (17)Unmarried:
26.1% (6)
Women who did not give birth in the past 12 months Now married:
52.5% (235)Unmarried:
47.5% (213)
Marital status - Hispanic or Latino population 15 years and over
Males 17.4% Never married47.0% Now married18.2% Separated0.0% Widowed17.4% DivorcedFemales 35.4% Never married50.4% Now married4.7% Separated4.7% Widowed4.7% DivorcedWomen who gave birth in the past 12 months Now married:
0.0% (0)Unmarried:
100.0% (12)
Women who did not give birth in the past 12 months Now married:
52.8% (43)Unmarried:
47.2% (38)
Ancestries in Cache
195 11.8% American
172 10.4% English
134 8.1% Irish
112 6.8% German
60 3.6% European
60 3.6% Jamaican
15 0.9% Dutch
12 0.7% Norwegian
9 0.5% Nigerian
6 0.4% French
5 0.3% Italian
5 0.3% Scandinavian
4 0.2% Australian
2 0.1% British
Children Nativity (place of birth) in Cache
Children under 6 years - Living with two parents Both parents native 150 100.0% NativeOne native, one foreign-born parent 15 100.0% NativeChildren under 6 years - Living with one parent Native parent 40 100.0% Native
Children 6 to 17 years - Living with two parents Both parents native 228 100.0% NativeBoth parents foreign-born 11 100.0% NativeOne native, one foreign-born parent 19 100.0% NativeChildren 6 to 17 years - Living with one parent Native parent 222 100.0% Native
Grandparents responsible for own grandchildren in Cache
Grandparents (30 to 59 years) White / Caucasian 43 68.3% Responsible for grandchildren20 31.7% Not responsible for grandchildrenAmerican Indian / Alaska Native 4 33.2% Responsible for grandchildren8 66.8% Not responsible for grandchildrenWhite alone, not Hispanic / Latino 37 60.0% Responsible for grandchildren25 40.0% Not responsible for grandchildrenHispanic or Latino 10 100.0% Responsible for grandchildrenGrandparents (60 years and over) White / Caucasian 19 29.7% Responsible for grandchildren46 70.3% Not responsible for grandchildrenAmerican Indian / Alaska Native 18 78.3% Responsible for grandchildren5 21.7% Not responsible for grandchildrenWhite alone, not Hispanic / Latino 19 56.3% Responsible for grandchildren15 43.7% Not responsible for grandchildrenHispanic or Latino 36 100.0% Not responsible for grandchildren