Races in Camp Hill, Pennsylvania (PA) Detailed Stats
Data:
Races - White alone (%)
Races - White alone (% change since 2000)
Races - Black alone (%)
Races - Black alone (% change since 2000)
Races - American Indian alone (%)
Races - American Indian alone (% change since 2000)
Races - Asian alone (%)
Races - Asian alone (% change since 2000)
Races - Hispanic (%)
Races - Hispanic (% change since 2000)
Races - Native Hawaiian and Other Pacific Islander alone (%)
Races - Native Hawaiian and Other Pacific Islander alone (% change since 2000)
Races - Two or more races(%)
Races - Two or more races(% change since 2000)
Races - Other race alone (%)
Races - Other race alone (% change since 2000)
Racial diversity
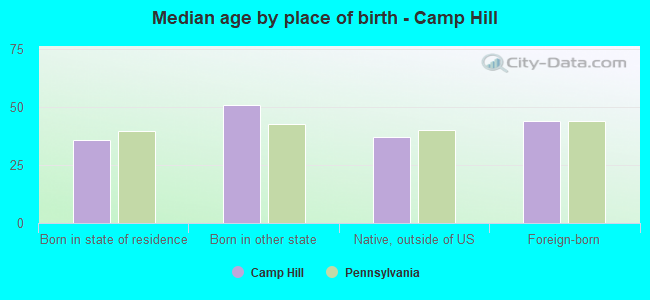
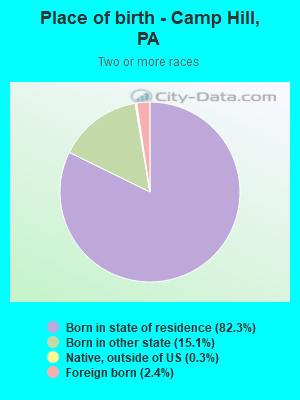
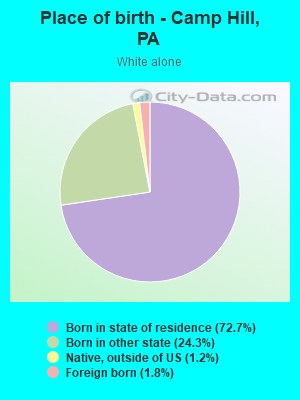
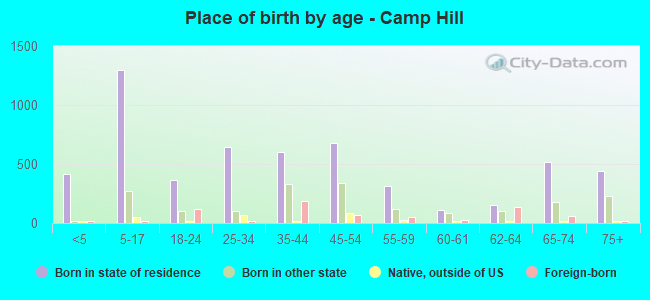
Place of birth - Born in state of residence (%)
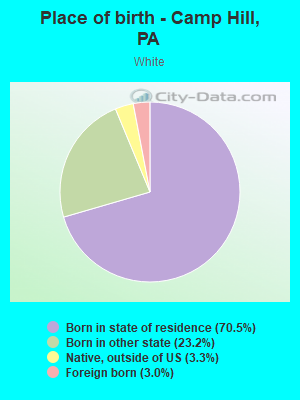
Place of birth - Born in state of residence (%) - White
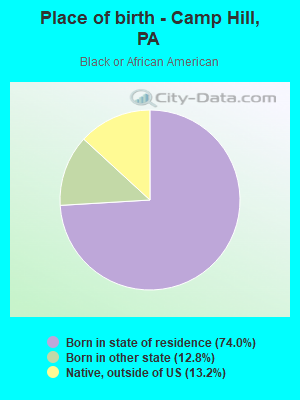
Place of birth - Born in state of residence (%) - Black or African American
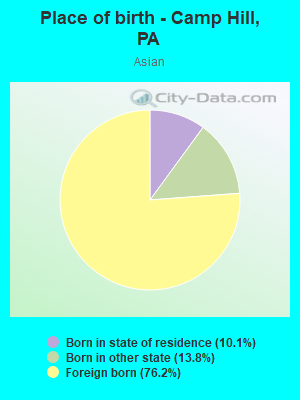
Place of birth - Born in state of residence (%) - Asian
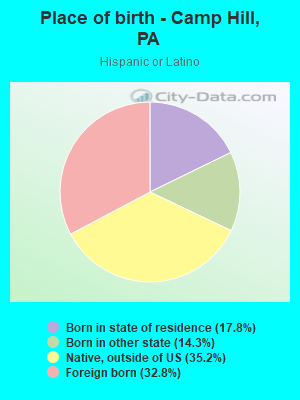
Place of birth - Born in state of residence (%) - Hispanic or Latino
Place of birth - Born in state of residence (%) - American Indian and Alaska Native
Place of birth - Born in state of residence (%) - Multirace
Place of birth - Born in state of residence (%) - Other Race
Place of birth - Born in other state (%)
Place of birth - Born in other state (%) - White
Place of birth - Born in other state (%) - Black or African American
Place of birth - Born in other state (%) - Asian
Place of birth - Born in other state (%) - Hispanic or Latino
Place of birth - Born in other state (%) - American Indian and Alaska Native
Place of birth - Born in other state (%) - Multirace
Place of birth - Born in other state (%) - Other Race
Place of birth - Native, outside of US (%)
Place of birth - Native, outside of US (%) - White
Place of birth - Native, outside of US (%) - Black or African American
Place of birth - Native, outside of US (%) - Asian
Place of birth - Native, outside of US (%) - Hispanic or Latino
Place of birth - Native, outside of US (%) - American Indian and Alaska Native
Place of birth - Native, outside of US (%) - Multirace
Place of birth - Native, outside of US (%) - Other Race
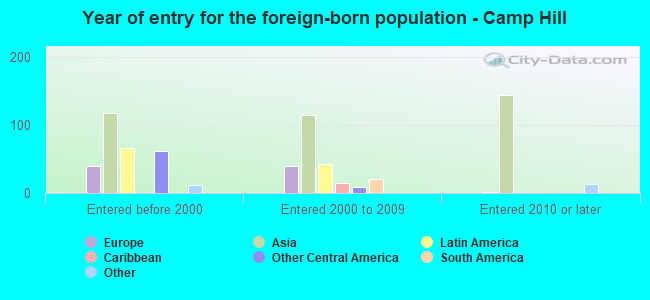
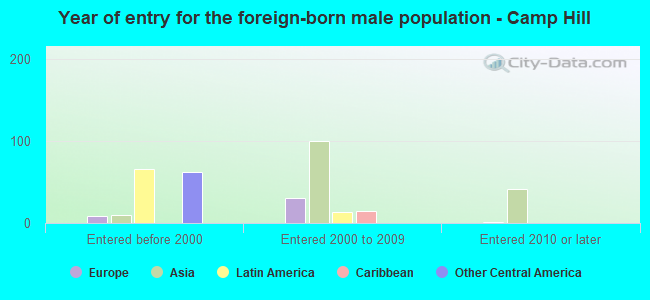
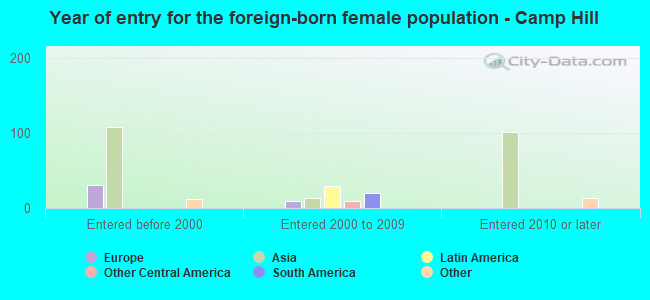
Place of birth - Foreign born (%)
Place of birth - Foreign born (%) - White
Place of birth - Foreign born (%) - Black or African American
Place of birth - Foreign born (%) - Asian
Place of birth - Foreign born (%) - Hispanic or Latino
Place of birth - Foreign born (%) - American Indian and Alaska Native
Place of birth - Foreign born (%) - Multirace
Place of birth - Foreign born (%) - Other Race
Residents speaking English at home (%)
Residents speaking English at home - Born in the United States (%)
Residents speaking English at home - Native, born elsewhere (%)
Residents speaking English at home - Foreign born (%)
Residents speaking Spanish at home (%)
Residents speaking Spanish at home - Born in the United States (%)
Residents speaking Spanish at home - Native, born elsewhere (%)
Residents speaking Spanish at home - Foreign born (%)
Residents speaking other language at home (%)
Residents speaking other language at home - Born in the United States (%)
Residents speaking other language at home - Native, born elsewhere (%)
Residents speaking other language at home - Foreign born (%)
Marital status - Never married (%)
Marital status - Now married (%)
Marital status - Separated (%)
Marital status - Widowed (%)
Marital status - Divorced (%)
Ancestries Reported - Arab (%)
Ancestries Reported - Czech (%)
Ancestries Reported - Danish (%)
Ancestries Reported - Dutch (%)
Ancestries Reported - English (%)
Ancestries Reported - French (%)
Ancestries Reported - French Canadian (%)
Ancestries Reported - German (%)
Ancestries Reported - Greek (%)
Ancestries Reported - Hungarian (%)
Ancestries Reported - Irish (%)
Ancestries Reported - Italian (%)
Ancestries Reported - Lithuanian (%)
Ancestries Reported - Norwegian (%)
Ancestries Reported - Polish (%)
Ancestries Reported - Portuguese (%)
Ancestries Reported - Russian (%)
Ancestries Reported - Scotch-Irish (%)
Ancestries Reported - Scottish (%)
Ancestries Reported - Slovak (%)
Ancestries Reported - Subsaharan African (%)
Ancestries Reported - Swedish (%)
Ancestries Reported - Swiss (%)
Ancestries Reported - Ukrainian (%)
Ancestries Reported - United States (%)
Ancestries Reported - Welsh (%)
Ancestries Reported - West Indian (%)
Ancestries Reported - Other (%)
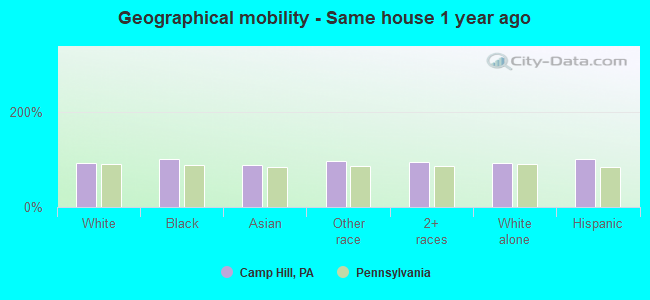
Geographical mobility - Same house 1 year ago (%)
Geographical mobility - Same house 1 year ago (%) - White
Geographical mobility - Same house 1 year ago (%) - Black or African American
Geographical mobility - Same house 1 year ago (%) - Asian
Geographical mobility - Same house 1 year ago (%) - Hispanic or Latino
Geographical mobility - Same house 1 year ago (%) - American Indian and Alaska Native
Geographical mobility - Same house 1 year ago (%) - Multirace
Geographical mobility - Same house 1 year ago (%) - Other Race
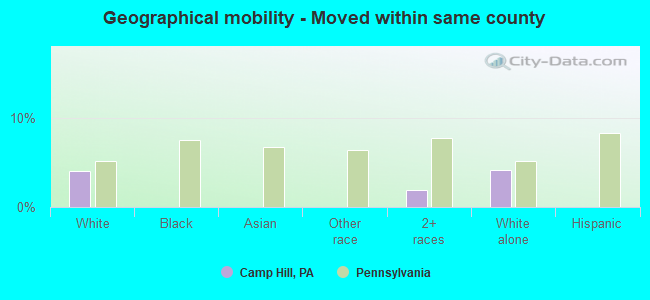
Geographical mobility - Moved within same county (%)
Geographical mobility - Moved within same county (%) - White
Geographical mobility - Moved within same county (%) - Black or African American
Geographical mobility - Moved within same county (%) - Asian
Geographical mobility - Moved within same county (%) - Hispanic or Latino
Geographical mobility - Moved within same county (%) - American Indian and Alaska Native
Geographical mobility - Moved within same county (%) - Multirace
Geographical mobility - Moved within same county (%) - Other Race
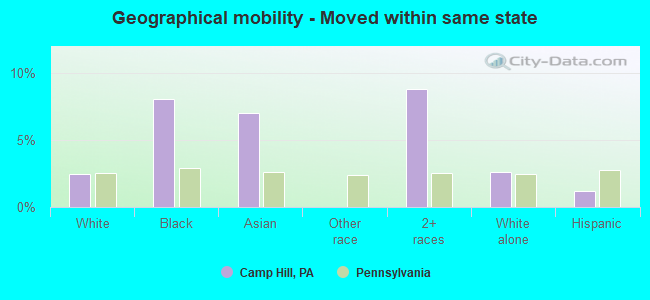
Geographical mobility - Moved from different county within same state (%)
Geographical mobility - Moved from different county within same state (%) - White
Geographical mobility - Moved from different county within same state (%) - Black or African American
Geographical mobility - Moved from different county within same state (%) - Asian
Geographical mobility - Moved from different county within same state (%) - Hispanic or Latino
Geographical mobility - Moved from different county within same state (%) - American Indian and Alaska Native
Geographical mobility - Moved from different county within same state (%) - Multirace
Geographical mobility - Moved from different county within same state (%) - Other Race
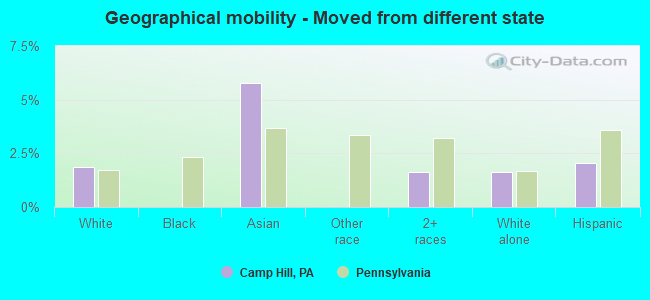
Geographical mobility - Moved from different state (%)
Geographical mobility - Moved from different state (%) - White
Geographical mobility - Moved from different state (%) - Black or African American
Geographical mobility - Moved from different state (%) - Asian
Geographical mobility - Moved from different state (%) - Hispanic or Latino
Geographical mobility - Moved from different state (%) - American Indian and Alaska Native
Geographical mobility - Moved from different state (%) - Multirace
Geographical mobility - Moved from different state (%) - Other Race
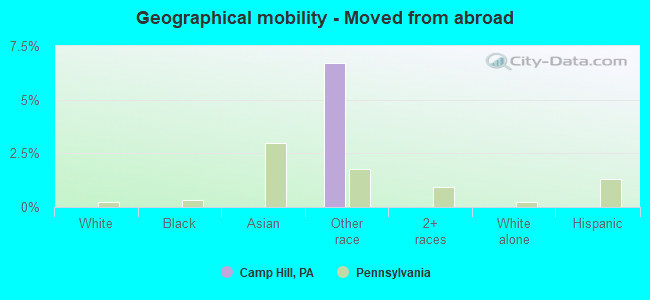
Geographical mobility - Moved from abroad (%)
Geographical mobility - Moved from abroad (%) - White
Geographical mobility - Moved from abroad (%) - Black or African American
Geographical mobility - Moved from abroad (%) - Asian
Geographical mobility - Moved from abroad (%) - Hispanic or Latino
Geographical mobility - Moved from abroad (%) - American Indian and Alaska Native
Geographical mobility - Moved from abroad (%) - Multirace
Geographical mobility - Moved from abroad (%) - Other Race
Place of birth for the foreign-born population - Ireland (%)
Place of birth for the foreign-born population - Denmark (%)
Place of birth for the foreign-born population - Norway (%)
Place of birth for the foreign-born population - Sweden (%)
Place of birth for the foreign-born population - United Kingdom (%)
Place of birth for the foreign-born population - England (%)
Place of birth for the foreign-born population - Scotland (%)
Place of birth for the foreign-born population - Other Northern Europe (%)
Place of birth for the foreign-born population - Austria (%)
Place of birth for the foreign-born population - Belgium (%)
Place of birth for the foreign-born population - France (%)
Place of birth for the foreign-born population - Germany (%)
Place of birth for the foreign-born population - Netherlands (%)
Place of birth for the foreign-born population - Switzerland (%)
Place of birth for the foreign-born population - Other Western Europe (%)
Place of birth for the foreign-born population - Greece (%)
Place of birth for the foreign-born population - Italy (%)
Place of birth for the foreign-born population - Portugal (%)
Place of birth for the foreign-born population - Spain (%)
Place of birth for the foreign-born population - Other Southern Europe (%)
Place of birth for the foreign-born population - Albania (%)
Place of birth for the foreign-born population - Belarus (%)
Place of birth for the foreign-born population - Bosnia and Herzegovina (%)
Place of birth for the foreign-born population - Bulgaria (%)
Place of birth for the foreign-born population - Croatia (%)
Place of birth for the foreign-born population - Czechoslovakia (%)
Place of birth for the foreign-born population - Hungary (%)
Place of birth for the foreign-born population - Latvia (%)
Place of birth for the foreign-born population - Lithuania (%)
Place of birth for the foreign-born population - North Macedonia (Macedonia) (%)
Place of birth for the foreign-born population - Moldova (%)
Place of birth for the foreign-born population - Poland (%)
Place of birth for the foreign-born population - Romania (%)
Place of birth for the foreign-born population - Russia (%)
Place of birth for the foreign-born population - Serbia (%)
Place of birth for the foreign-born population - Ukraine (%)
Place of birth for the foreign-born population - Other Eastern Europe (%)
Place of birth for the foreign-born population - China (%)
Place of birth for the foreign-born population - Hong Kong (%)
Place of birth for the foreign-born population - Taiwan (%)
Place of birth for the foreign-born population - Japan (%)
Place of birth for the foreign-born population - Korea (%)
Place of birth for the foreign-born population - Other Eastern Asia (%)
Place of birth for the foreign-born population - Afghanistan (%)
Place of birth for the foreign-born population - Bangladesh (%)
Place of birth for the foreign-born population - India (%)
Place of birth for the foreign-born population - Iran (%)
Place of birth for the foreign-born population - Kazakhstan (%)
Place of birth for the foreign-born population - Nepal (%)
Place of birth for the foreign-born population - Pakistan (%)
Place of birth for the foreign-born population - Sri Lanka (%)
Place of birth for the foreign-born population - Uzbekistan (%)
Place of birth for the foreign-born population - Other South Central Asia (%)
Place of birth for the foreign-born population - Burma (%)
Place of birth for the foreign-born population - Cambodia (%)
Place of birth for the foreign-born population - Indonesia (%)
Place of birth for the foreign-born population - Laos (%)
Place of birth for the foreign-born population - Malaysia (%)
Place of birth for the foreign-born population - Philippines (%)
Place of birth for the foreign-born population - Singapore (%)
Place of birth for the foreign-born population - Thailand (%)
Place of birth for the foreign-born population - Vietnam (%)
Place of birth for the foreign-born population - Other South Eastern Asia (%)
Place of birth for the foreign-born population - Armenia (%)
Place of birth for the foreign-born population - Iraq (%)
Place of birth for the foreign-born population - Israel (%)
Place of birth for the foreign-born population - Jordan (%)
Place of birth for the foreign-born population - Kuwait (%)
Place of birth for the foreign-born population - Lebanon (%)
Place of birth for the foreign-born population - Saudi Arabia (%)
Place of birth for the foreign-born population - Syria (%)
Place of birth for the foreign-born population - Turkey (%)
Place of birth for the foreign-born population - Yemen (%)
Place of birth for the foreign-born population - Other Western Asia (%)
Place of birth for the foreign-born population - Eritrea (%)
Place of birth for the foreign-born population - Ethiopia (%)
Place of birth for the foreign-born population - Kenya (%)
Place of birth for the foreign-born population - Somalia (%)
Place of birth for the foreign-born population - Uganda (%)
Place of birth for the foreign-born population - Zimbabwe (%)
Place of birth for the foreign-born population - Other Eastern Africa (%)
Place of birth for the foreign-born population - Cameroon (%)
Place of birth for the foreign-born population - Congo (%)
Place of birth for the foreign-born population - Democratic Republic of Congo (Zaire) (%)
Place of birth for the foreign-born population - Other Middle Africa (%)
Place of birth for the foreign-born population - Egypt (%)
Place of birth for the foreign-born population - Morocco (%)
Place of birth for the foreign-born population - Sudan (%)
Place of birth for the foreign-born population - Other Northern Africa (%)
Place of birth for the foreign-born population - South Africa (%)
Place of birth for the foreign-born population - Other Southern Africa (%)
Place of birth for the foreign-born population - Cabo Verde (%)
Place of birth for the foreign-born population - Ghana (%)
Place of birth for the foreign-born population - Liberia (%)
Place of birth for the foreign-born population - Nigeria (%)
Place of birth for the foreign-born population - Senegal (%)
Place of birth for the foreign-born population - Sierra Leone (%)
Place of birth for the foreign-born population - Other Western Africa (%)
Place of birth for the foreign-born population - Australia (%)
Place of birth for the foreign-born population - New Zealand (%)
Place of birth for the foreign-born population - Fiji (%)
Place of birth for the foreign-born population - Micronesia (%)
Place of birth for the foreign-born population - Bahamas (%)
Place of birth for the foreign-born population - Barbados (%)
Place of birth for the foreign-born population - Cuba (%)
Place of birth for the foreign-born population - Dominica (%)
Place of birth for the foreign-born population - Dominican Republic (%)
Place of birth for the foreign-born population - Grenada (%)
Place of birth for the foreign-born population - Haiti (%)
Place of birth for the foreign-born population - Jamaica (%)
Place of birth for the foreign-born population - St. Vincent and the Grenadines (%)
Place of birth for the foreign-born population - Trinidad and Tobago (%)
Place of birth for the foreign-born population - West Indies (%)
Place of birth for the foreign-born population - Other Caribbean (%)
Place of birth for the foreign-born population - Belize (%)
Place of birth for the foreign-born population - Costa Rica (%)
Place of birth for the foreign-born population - El Salvador (%)
Place of birth for the foreign-born population - Guatemala (%)
Place of birth for the foreign-born population - Honduras (%)
Place of birth for the foreign-born population - Mexico (%)
Place of birth for the foreign-born population - Nicaragua (%)
Place of birth for the foreign-born population - Panama (%)
Place of birth for the foreign-born population - Other Central America (%)
Place of birth for the foreign-born population - Argentina (%)
Place of birth for the foreign-born population - Bolivia (%)
Place of birth for the foreign-born population - Brazil (%)
Place of birth for the foreign-born population - Chile (%)
Place of birth for the foreign-born population - Colombia (%)
Place of birth for the foreign-born population - Ecuador (%)
Place of birth for the foreign-born population - Guyana (%)
Place of birth for the foreign-born population - Peru (%)
Place of birth for the foreign-born population - Uruguay (%)
Place of birth for the foreign-born population - Venezuela (%)
Place of birth for the foreign-born population - Other South America (%)
Place of birth for the foreign-born population - Canada (%)
Place of birth for the foreign-born population - Other Northern America (%)
Place of birth for the foreign-born population - Other (%)
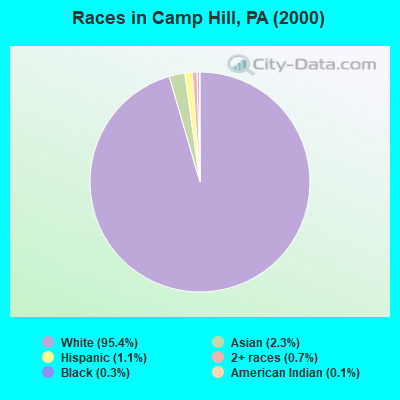
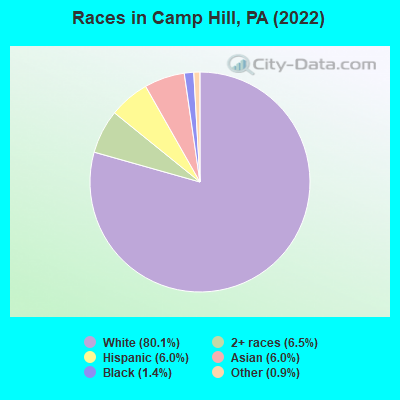
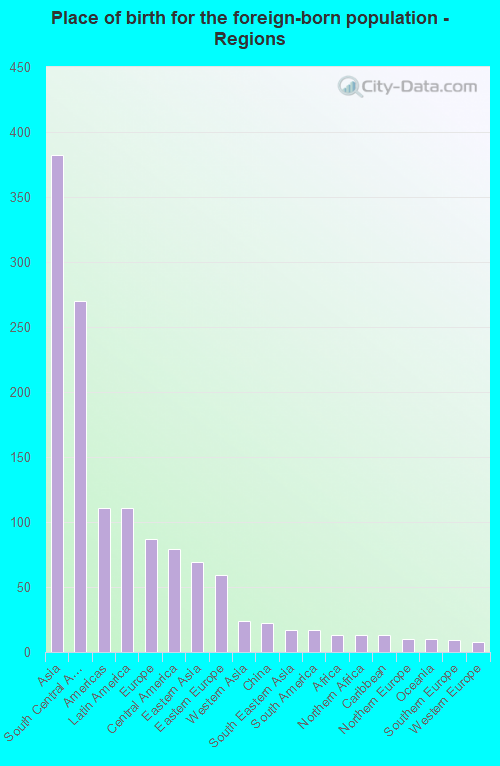
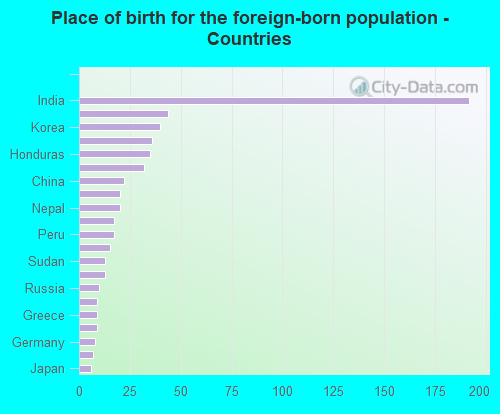
According to 2022 data, the most numerous races in Camp Hill, PA are White alone (6,699 residents), Black alone (116 residents), and Hispanic (503 residents). 88.2% of Camp Hill residents speak English at home. 7.2% of Camp Hill, PA residents are foreign-born (4.5% born in Asia, 1.3% born in Latin America, 1.0% born in Europe), which is 3.1% greater than the foreign-born rate of 7.0% across the entire state of Pennsylvania.
Race distribution in Camp Hill
2000 2022
10,322,455 84.1% White alone 1,202,437 9.8% Black alone 394,088 3.2% Hispanic 218,296 1.8% Asian alone 113,097 0.9% Two or more races 13,086 0.1% Other race alone 14,904 0.1% American Indian alone 2,691 0.02% Native Hawaiian and Other
9,487,228 73.1% White alone 1,311,581 10.1% Black alone 1,115,997 8.6% Hispanic 493,942 3.8% Two or more races 487,124 3.8% Asian alone 63,582 0.5% Other race alone 10,130 0.08% American Indian alone 2,424 0.02% Native Hawaiian and Other
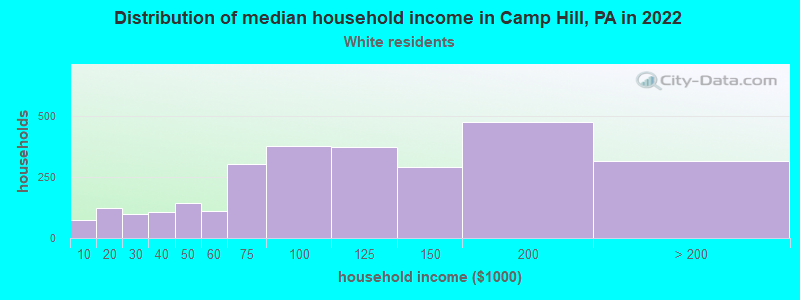
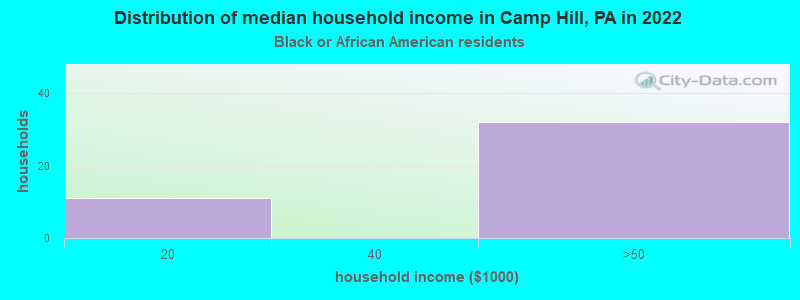
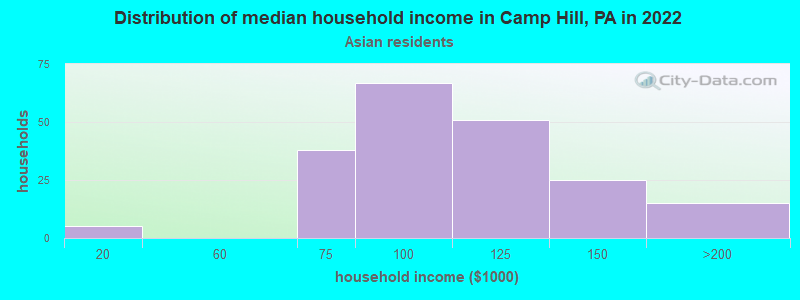
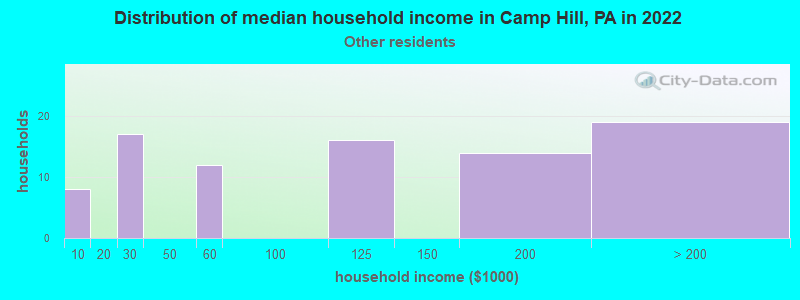
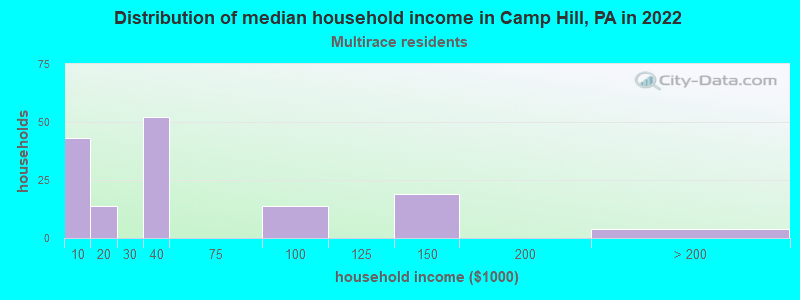
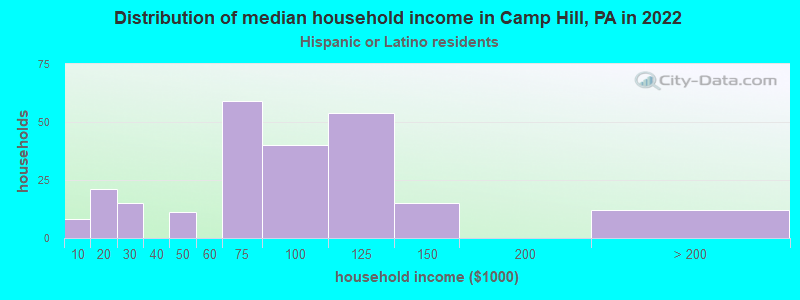
Income and house value in Camp Hill Median household income in 2022 $114,346 White non-Hispanic householders$107,707 Asian householders$178,132 Some other race householders$26,861 Two or more races householders$96,941 Hispanic or Latino race householdersMedian 2022 house value $288,448 White Non-Hispanic householders$372,007 Black or African American householders $257,543 Asian householders$314,775 Two or more races householders$325,764 Hispanic or Latino householders
Median age by race in Camp Hill
44.4 Median age for White residents44.2 43.8 31.9 Median age for Black or African American residents28.7 37.6 -857,881,136.1 Median age for American Indian / Alaska Native residents-714,583,332.6 -577,519,379.3 36.3 Median age for Asian residents34.6 58.9 -680,432,644.4 Median age for Native Hawaiian / Pacific Islander residents-666,666,666.0 -666,666,666.0 38.7 Median age for Other race residents39.4 35.7 11.9 Median age for Two or more races residents22.9 9.7 43.6 Median age for White alone residents43.7 43.5 41.7 Median age for Hispanic or Latino residents41.3 42.7
Owner/renter occupied households by race in Camp Hill
House owners and renters - White residents 2,138 74.6% Owner occupied726 25.4% Renter occupiedHouse owners and renters - Black or African American residents 42 100.0% Renter occupiedHouse owners and renters - Asian residents 20 8.8% Owner occupied210 91.2% Renter occupiedHouse owners and renters - Other race residents 87 82.2% Owner occupied19 17.8% Renter occupiedHouse owners and renters - Two or more races residents 72 64.7% Owner occupied39 35.3% Renter occupiedHouse owners and renters - White alone residents 2,078 76.0% Owner occupied657 24.0% Renter occupiedHouse owners and renters - Hispanic or Latino residents 172 72.6% Owner occupied65 27.4% Renter occupied
Language usage in Camp Hill
English speakers - Total 88.2% of residents of Camp Hill speak English at home.
7.5% of residents speak Spanish at home 434 73.2% Speak English very well159 26.8% Speak English less than very well4.8% of residents speak other language at home 255 66.4% Speak English very well129 33.6% Speak English less than very well
English speakers - Born in the United States 95.8% of residents of Camp Hill speak English at home.
3.2% of residents speak Spanish at home 59 100.0% Speak English very well1.5% of residents speak other language at home 28 100.0% Speak English very well
English speakers - Native, born elsewhere 26.5% of residents of Camp Hill speak English at home.
70.4% of residents speak Spanish at home 162 89.5% Speak English very well19 10.5% Speak English less than very well
English speakers - Foreign-born 38.3% of residents of Camp Hill speak English at home.
28.1% of residents speak Spanish at home 43 23.1% Speak English very well143 76.9% Speak English less than very well43.4% of residents speak other language at home 170 59.2% Speak English very well117 40.8% Speak English less than very well
White (Caucasian) - Speak only English Native:
94.3% (6,001)Foreign-born:
54.9% (113)
White (Caucasian) - Speak another language Native:
5.7% (362)Foreign-born:
47.6% (98)
Asian - Speak only English Native:
88.4% (106)Foreign-born:
28.6% (108)
Asian - Speak another language Native:
15.6% (19)Foreign-born:
73.4% (276)
Other race - Speak another language Native:
63.9% (95)Foreign-born:
96.8% (101)
Two or more races - Speak only English Native:
100.0% (506)Foreign-born:
100.0% (16)
White alone - Speak only English Native:
96.3% (6,028)Foreign-born:
93.0% (114)
White alone - Speak another language Native:
3.9% (244)Foreign-born:
16.8% (21)
Hispanic or Latino - Speak another language Native:
64.8% (205)Foreign-born:
100.0% (152)
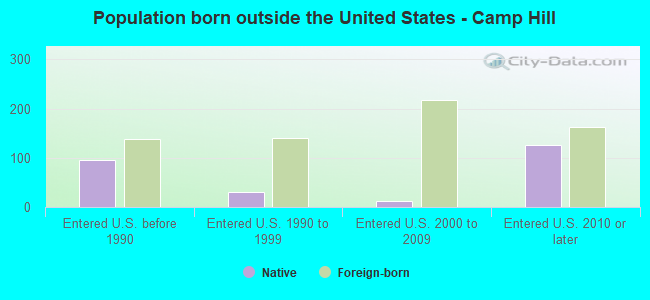
Foreign-born residents in Camp Hill 604 residents are foreign born (4.5% Asia , 1.3% Latin America , 1.0% Europe ).
This city:
7.2%Pennsylvania:
7.3%
Marital status for residents in Camp Hill Marital status - White (Caucasian) population 15 years and over
Males 27.0% Never married59.7% Now married1.5% Separated3.1% Widowed8.7% DivorcedFemales 26.1% Never married49.6% Now married1.1% Separated8.9% Widowed14.3% DivorcedWomen who gave birth in the past 12 months Now married:
88.2% (81)Unmarried:
11.8% (11)
Women who did not give birth in the past 12 months Now married:
47.4% (726)Unmarried:
52.6% (806)
Marital status - Black or African American population 15 years and over
Males 73.5% Never married5.9% Now married0.0% Separated0.0% Widowed20.6% DivorcedFemales 0.0% Never married0.0% Now married60.0% Separated0.0% Widowed40.0% DivorcedWomen who did not give birth in the past 12 months Now married:
100.0% (12)Unmarried:
0.0% (0)
Marital status - Asian population 15 years and over
Males 36.2% Never married49.3% Now married0.0% Separated0.0% Widowed14.5% DivorcedFemales 19.5% Never married67.6% Now married0.0% Separated0.0% Widowed12.9% DivorcedWomen who gave birth in the past 12 months Now married:
33.3% (9)Unmarried:
66.7% (17)
Women who did not give birth in the past 12 months Now married:
52.1% (40)Unmarried:
47.9% (37)
Marital status - Other race population 15 years and over
Males 44.0% Never married56.0% Now married0.0% Separated0.0% Widowed0.0% DivorcedFemales 8.5% Never married66.1% Now married0.0% Separated0.0% Widowed25.4% DivorcedWomen who gave birth in the past 12 months Now married:
100.0% (15)Unmarried:
0.0% (0)
Women who did not give birth in the past 12 months Now married:
100.0% (12)Unmarried:
0.0% (0)
Marital status - Two or more races population 15 years and over
Males 32.4% Never married67.6% Now married0.0% Separated0.0% Widowed0.0% DivorcedFemales 28.1% Never married33.3% Now married0.0% Separated6.2% Widowed32.3% DivorcedWomen who did not give birth in the past 12 months Now married:
27.5% (33)Unmarried:
72.5% (86)
Marital status - White alone, not Hispanic / Latino population 15 years and over
Males 26.6% Never married59.7% Now married1.6% Separated3.2% Widowed8.8% DivorcedFemales 26.6% Never married49.3% Now married1.1% Separated9.0% Widowed14.0% DivorcedWomen who gave birth in the past 12 months Now married:
88.2% (81)Unmarried:
11.8% (11)
Women who did not give birth in the past 12 months Now married:
47.9% (727)Unmarried:
52.1% (790)
Marital status - Hispanic or Latino population 15 years and over
Males 35.6% Never married60.2% Now married0.0% Separated0.0% Widowed4.2% DivorcedFemales 0.0% Never married65.0% Now married11.7% Separated0.0% Widowed23.3% DivorcedWomen who gave birth in the past 12 months Now married:
100.0% (13)Unmarried:
0.0% (0)
Women who did not give birth in the past 12 months Now married:
41.4% (13)Unmarried:
58.6% (18)
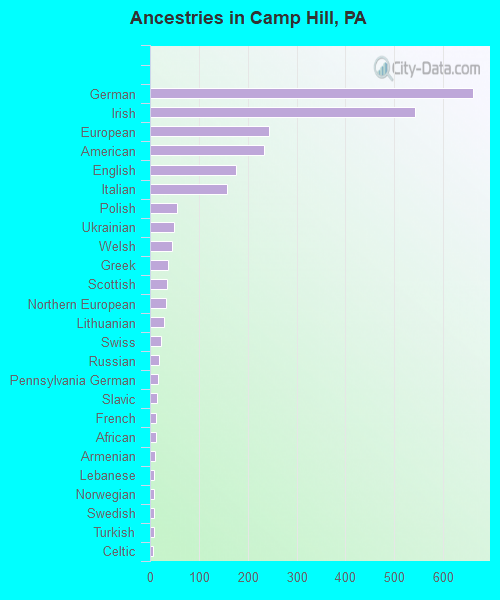
Ancestries in Camp Hill
661 19.3% German543 15.9% Irish243 7.1% European233 6.8% American176 5.1% English158 4.6% Italian56 1.6% Polish49 1.4% Ukrainian45 1.3% Welsh37 1.1% Greek34 1.0% Scottish32 0.9% Northern European28 0.8% Lithuanian23 0.7% Swiss19 0.6% Russian16 0.5% Pennsylvania German15 0.4% Slavic13 0.4% French13 0.4% African11 0.3% Armenian9 0.3% Lebanese8 0.2% Norwegian8 0.2% Swedish8 0.2% Turkish7 0.2% Celtic7 0.2% Hungarian6 0.2% Dutch6 0.2% Scotch-Irish6 0.2% Serbian6 0.2% Slovene3 0.09% Croatian
Children Nativity (place of birth) in Camp Hill
Children under 6 years - Living with two parents Both parents native 367 100.0% NativeBoth parents foreign-born 15 45.9% Native18 54.1% Foreign-bornOne native, one foreign-born parent 72 100.0% NativeChildren under 6 years - Living with one parent Native parent 60 100.0% Native
Children 6 to 17 years - Living with two parents Both parents native 1,002 100.0% NativeBoth parents foreign-born 8 100.0% NativeOne native, one foreign-born parent 151 100.0% NativeChildren 6 to 17 years - Living with one parent Native parent 366 100.0% Native
Grandparents responsible for own grandchildren in Camp Hill
Grandparents (30 to 59 years) White / Caucasian 8 100.0% Not responsible for grandchildrenWhite alone, not Hispanic / Latino 8 100.0% Not responsible for grandchildrenGrandparents (60 years and over) White / Caucasian 12 28.9% Responsible for grandchildren28 71.1% Not responsible for grandchildrenWhite alone, not Hispanic / Latino 12 28.9% Responsible for grandchildren28 71.1% Not responsible for grandchildren