Races in Canton, Ohio (OH) Detailed Stats
Data:
Races - White alone (%)
Races - White alone (% change since 2000)
Races - Black alone (%)
Races - Black alone (% change since 2000)
Races - American Indian alone (%)
Races - American Indian alone (% change since 2000)
Races - Asian alone (%)
Races - Asian alone (% change since 2000)
Races - Hispanic (%)
Races - Hispanic (% change since 2000)
Races - Native Hawaiian and Other Pacific Islander alone (%)
Races - Native Hawaiian and Other Pacific Islander alone (% change since 2000)
Races - Two or more races(%)
Races - Two or more races(% change since 2000)
Races - Other race alone (%)
Races - Other race alone (% change since 2000)
Racial diversity
Place of birth - Born in state of residence (%)
Place of birth - Born in state of residence (%) - White
Place of birth - Born in state of residence (%) - Black or African American
Place of birth - Born in state of residence (%) - Asian
Place of birth - Born in state of residence (%) - Hispanic or Latino
Place of birth - Born in state of residence (%) - American Indian and Alaska Native
Place of birth - Born in state of residence (%) - Multirace
Place of birth - Born in state of residence (%) - Other Race
Place of birth - Born in other state (%)
Place of birth - Born in other state (%) - White
Place of birth - Born in other state (%) - Black or African American
Place of birth - Born in other state (%) - Asian
Place of birth - Born in other state (%) - Hispanic or Latino
Place of birth - Born in other state (%) - American Indian and Alaska Native
Place of birth - Born in other state (%) - Multirace
Place of birth - Born in other state (%) - Other Race
Place of birth - Native, outside of US (%)
Place of birth - Native, outside of US (%) - White
Place of birth - Native, outside of US (%) - Black or African American
Place of birth - Native, outside of US (%) - Asian
Place of birth - Native, outside of US (%) - Hispanic or Latino
Place of birth - Native, outside of US (%) - American Indian and Alaska Native
Place of birth - Native, outside of US (%) - Multirace
Place of birth - Native, outside of US (%) - Other Race
Place of birth - Foreign born (%)
Place of birth - Foreign born (%) - White
Place of birth - Foreign born (%) - Black or African American
Place of birth - Foreign born (%) - Asian
Place of birth - Foreign born (%) - Hispanic or Latino
Place of birth - Foreign born (%) - American Indian and Alaska Native
Place of birth - Foreign born (%) - Multirace
Place of birth - Foreign born (%) - Other Race
Residents speaking English at home (%)
Residents speaking English at home - Born in the United States (%)
Residents speaking English at home - Native, born elsewhere (%)
Residents speaking English at home - Foreign born (%)
Residents speaking Spanish at home (%)
Residents speaking Spanish at home - Born in the United States (%)
Residents speaking Spanish at home - Native, born elsewhere (%)
Residents speaking Spanish at home - Foreign born (%)
Residents speaking other language at home (%)
Residents speaking other language at home - Born in the United States (%)
Residents speaking other language at home - Native, born elsewhere (%)
Residents speaking other language at home - Foreign born (%)
Marital status - Never married (%)
Marital status - Now married (%)
Marital status - Separated (%)
Marital status - Widowed (%)
Marital status - Divorced (%)
Ancestries Reported - Arab (%)
Ancestries Reported - Czech (%)
Ancestries Reported - Danish (%)
Ancestries Reported - Dutch (%)
Ancestries Reported - English (%)
Ancestries Reported - French (%)
Ancestries Reported - French Canadian (%)
Ancestries Reported - German (%)
Ancestries Reported - Greek (%)
Ancestries Reported - Hungarian (%)
Ancestries Reported - Irish (%)
Ancestries Reported - Italian (%)
Ancestries Reported - Lithuanian (%)
Ancestries Reported - Norwegian (%)
Ancestries Reported - Polish (%)
Ancestries Reported - Portuguese (%)
Ancestries Reported - Russian (%)
Ancestries Reported - Scotch-Irish (%)
Ancestries Reported - Scottish (%)
Ancestries Reported - Slovak (%)
Ancestries Reported - Subsaharan African (%)
Ancestries Reported - Swedish (%)
Ancestries Reported - Swiss (%)
Ancestries Reported - Ukrainian (%)
Ancestries Reported - United States (%)
Ancestries Reported - Welsh (%)
Ancestries Reported - West Indian (%)
Ancestries Reported - Other (%)
Geographical mobility - Same house 1 year ago (%)
Geographical mobility - Same house 1 year ago (%) - White
Geographical mobility - Same house 1 year ago (%) - Black or African American
Geographical mobility - Same house 1 year ago (%) - Asian
Geographical mobility - Same house 1 year ago (%) - Hispanic or Latino
Geographical mobility - Same house 1 year ago (%) - American Indian and Alaska Native
Geographical mobility - Same house 1 year ago (%) - Multirace
Geographical mobility - Same house 1 year ago (%) - Other Race
Geographical mobility - Moved within same county (%)
Geographical mobility - Moved within same county (%) - White
Geographical mobility - Moved within same county (%) - Black or African American
Geographical mobility - Moved within same county (%) - Asian
Geographical mobility - Moved within same county (%) - Hispanic or Latino
Geographical mobility - Moved within same county (%) - American Indian and Alaska Native
Geographical mobility - Moved within same county (%) - Multirace
Geographical mobility - Moved within same county (%) - Other Race
Geographical mobility - Moved from different county within same state (%)
Geographical mobility - Moved from different county within same state (%) - White
Geographical mobility - Moved from different county within same state (%) - Black or African American
Geographical mobility - Moved from different county within same state (%) - Asian
Geographical mobility - Moved from different county within same state (%) - Hispanic or Latino
Geographical mobility - Moved from different county within same state (%) - American Indian and Alaska Native
Geographical mobility - Moved from different county within same state (%) - Multirace
Geographical mobility - Moved from different county within same state (%) - Other Race
Geographical mobility - Moved from different state (%)
Geographical mobility - Moved from different state (%) - White
Geographical mobility - Moved from different state (%) - Black or African American
Geographical mobility - Moved from different state (%) - Asian
Geographical mobility - Moved from different state (%) - Hispanic or Latino
Geographical mobility - Moved from different state (%) - American Indian and Alaska Native
Geographical mobility - Moved from different state (%) - Multirace
Geographical mobility - Moved from different state (%) - Other Race
Geographical mobility - Moved from abroad (%)
Geographical mobility - Moved from abroad (%) - White
Geographical mobility - Moved from abroad (%) - Black or African American
Geographical mobility - Moved from abroad (%) - Asian
Geographical mobility - Moved from abroad (%) - Hispanic or Latino
Geographical mobility - Moved from abroad (%) - American Indian and Alaska Native
Geographical mobility - Moved from abroad (%) - Multirace
Geographical mobility - Moved from abroad (%) - Other Race
Place of birth for the foreign-born population - Ireland (%)
Place of birth for the foreign-born population - Denmark (%)
Place of birth for the foreign-born population - Norway (%)
Place of birth for the foreign-born population - Sweden (%)
Place of birth for the foreign-born population - United Kingdom (%)
Place of birth for the foreign-born population - England (%)
Place of birth for the foreign-born population - Scotland (%)
Place of birth for the foreign-born population - Other Northern Europe (%)
Place of birth for the foreign-born population - Austria (%)
Place of birth for the foreign-born population - Belgium (%)
Place of birth for the foreign-born population - France (%)
Place of birth for the foreign-born population - Germany (%)
Place of birth for the foreign-born population - Netherlands (%)
Place of birth for the foreign-born population - Switzerland (%)
Place of birth for the foreign-born population - Other Western Europe (%)
Place of birth for the foreign-born population - Greece (%)
Place of birth for the foreign-born population - Italy (%)
Place of birth for the foreign-born population - Portugal (%)
Place of birth for the foreign-born population - Spain (%)
Place of birth for the foreign-born population - Other Southern Europe (%)
Place of birth for the foreign-born population - Albania (%)
Place of birth for the foreign-born population - Belarus (%)
Place of birth for the foreign-born population - Bosnia and Herzegovina (%)
Place of birth for the foreign-born population - Bulgaria (%)
Place of birth for the foreign-born population - Croatia (%)
Place of birth for the foreign-born population - Czechoslovakia (%)
Place of birth for the foreign-born population - Hungary (%)
Place of birth for the foreign-born population - Latvia (%)
Place of birth for the foreign-born population - Lithuania (%)
Place of birth for the foreign-born population - North Macedonia (Macedonia) (%)
Place of birth for the foreign-born population - Moldova (%)
Place of birth for the foreign-born population - Poland (%)
Place of birth for the foreign-born population - Romania (%)
Place of birth for the foreign-born population - Russia (%)
Place of birth for the foreign-born population - Serbia (%)
Place of birth for the foreign-born population - Ukraine (%)
Place of birth for the foreign-born population - Other Eastern Europe (%)
Place of birth for the foreign-born population - China (%)
Place of birth for the foreign-born population - Hong Kong (%)
Place of birth for the foreign-born population - Taiwan (%)
Place of birth for the foreign-born population - Japan (%)
Place of birth for the foreign-born population - Korea (%)
Place of birth for the foreign-born population - Other Eastern Asia (%)
Place of birth for the foreign-born population - Afghanistan (%)
Place of birth for the foreign-born population - Bangladesh (%)
Place of birth for the foreign-born population - India (%)
Place of birth for the foreign-born population - Iran (%)
Place of birth for the foreign-born population - Kazakhstan (%)
Place of birth for the foreign-born population - Nepal (%)
Place of birth for the foreign-born population - Pakistan (%)
Place of birth for the foreign-born population - Sri Lanka (%)
Place of birth for the foreign-born population - Uzbekistan (%)
Place of birth for the foreign-born population - Other South Central Asia (%)
Place of birth for the foreign-born population - Burma (%)
Place of birth for the foreign-born population - Cambodia (%)
Place of birth for the foreign-born population - Indonesia (%)
Place of birth for the foreign-born population - Laos (%)
Place of birth for the foreign-born population - Malaysia (%)
Place of birth for the foreign-born population - Philippines (%)
Place of birth for the foreign-born population - Singapore (%)
Place of birth for the foreign-born population - Thailand (%)
Place of birth for the foreign-born population - Vietnam (%)
Place of birth for the foreign-born population - Other South Eastern Asia (%)
Place of birth for the foreign-born population - Armenia (%)
Place of birth for the foreign-born population - Iraq (%)
Place of birth for the foreign-born population - Israel (%)
Place of birth for the foreign-born population - Jordan (%)
Place of birth for the foreign-born population - Kuwait (%)
Place of birth for the foreign-born population - Lebanon (%)
Place of birth for the foreign-born population - Saudi Arabia (%)
Place of birth for the foreign-born population - Syria (%)
Place of birth for the foreign-born population - Turkey (%)
Place of birth for the foreign-born population - Yemen (%)
Place of birth for the foreign-born population - Other Western Asia (%)
Place of birth for the foreign-born population - Eritrea (%)
Place of birth for the foreign-born population - Ethiopia (%)
Place of birth for the foreign-born population - Kenya (%)
Place of birth for the foreign-born population - Somalia (%)
Place of birth for the foreign-born population - Uganda (%)
Place of birth for the foreign-born population - Zimbabwe (%)
Place of birth for the foreign-born population - Other Eastern Africa (%)
Place of birth for the foreign-born population - Cameroon (%)
Place of birth for the foreign-born population - Congo (%)
Place of birth for the foreign-born population - Democratic Republic of Congo (Zaire) (%)
Place of birth for the foreign-born population - Other Middle Africa (%)
Place of birth for the foreign-born population - Egypt (%)
Place of birth for the foreign-born population - Morocco (%)
Place of birth for the foreign-born population - Sudan (%)
Place of birth for the foreign-born population - Other Northern Africa (%)
Place of birth for the foreign-born population - South Africa (%)
Place of birth for the foreign-born population - Other Southern Africa (%)
Place of birth for the foreign-born population - Cabo Verde (%)
Place of birth for the foreign-born population - Ghana (%)
Place of birth for the foreign-born population - Liberia (%)
Place of birth for the foreign-born population - Nigeria (%)
Place of birth for the foreign-born population - Senegal (%)
Place of birth for the foreign-born population - Sierra Leone (%)
Place of birth for the foreign-born population - Other Western Africa (%)
Place of birth for the foreign-born population - Australia (%)
Place of birth for the foreign-born population - New Zealand (%)
Place of birth for the foreign-born population - Fiji (%)
Place of birth for the foreign-born population - Micronesia (%)
Place of birth for the foreign-born population - Bahamas (%)
Place of birth for the foreign-born population - Barbados (%)
Place of birth for the foreign-born population - Cuba (%)
Place of birth for the foreign-born population - Dominica (%)
Place of birth for the foreign-born population - Dominican Republic (%)
Place of birth for the foreign-born population - Grenada (%)
Place of birth for the foreign-born population - Haiti (%)
Place of birth for the foreign-born population - Jamaica (%)
Place of birth for the foreign-born population - St. Vincent and the Grenadines (%)
Place of birth for the foreign-born population - Trinidad and Tobago (%)
Place of birth for the foreign-born population - West Indies (%)
Place of birth for the foreign-born population - Other Caribbean (%)
Place of birth for the foreign-born population - Belize (%)
Place of birth for the foreign-born population - Costa Rica (%)
Place of birth for the foreign-born population - El Salvador (%)
Place of birth for the foreign-born population - Guatemala (%)
Place of birth for the foreign-born population - Honduras (%)
Place of birth for the foreign-born population - Mexico (%)
Place of birth for the foreign-born population - Nicaragua (%)
Place of birth for the foreign-born population - Panama (%)
Place of birth for the foreign-born population - Other Central America (%)
Place of birth for the foreign-born population - Argentina (%)
Place of birth for the foreign-born population - Bolivia (%)
Place of birth for the foreign-born population - Brazil (%)
Place of birth for the foreign-born population - Chile (%)
Place of birth for the foreign-born population - Colombia (%)
Place of birth for the foreign-born population - Ecuador (%)
Place of birth for the foreign-born population - Guyana (%)
Place of birth for the foreign-born population - Peru (%)
Place of birth for the foreign-born population - Uruguay (%)
Place of birth for the foreign-born population - Venezuela (%)
Place of birth for the foreign-born population - Other South America (%)
Place of birth for the foreign-born population - Canada (%)
Place of birth for the foreign-born population - Other Northern America (%)
Place of birth for the foreign-born population - Other (%)
Latest news about races in Canton, OH collected exclusively by city-data.com from local newspapers, TV, and radio stations
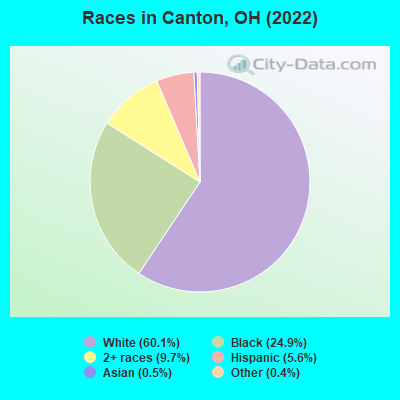
According to 2022 data, the most numerous races in Canton, OH are White alone (42,255 residents), Black alone (17,535 residents), and Two or more races (6,836 residents). 96.4% of Canton residents speak English at home. 2.6% of Canton, OH residents are foreign-born (1.4% born in Latin America, 0.5% born in Europe, 0.4% born in Asia), which is 52.3% less than the foreign-born rate of 4.0% across the entire state of Ohio.
Race distribution in Canton
2000 2022
9,538,111 84.0% White alone 1,290,662 11.4% Black alone 217,123 1.9% Hispanic 137,770 1.2% Two or more races 131,670 1.2% Asian alone 21,985 0.2% American Indian alone 13,483 0.1% Other race alone 2,336 0.02% Native Hawaiian and Other
8,948,793 76.1% White alone 1,401,403 11.9% Black alone 529,291 4.5% Two or more races 517,232 4.4% Hispanic 293,387 2.5% Asian alone 52,805 0.4% Other race alone 9,785 0.08% American Indian alone 3,362 0.03% Native Hawaiian and Other
Income and house value in Canton Median household income in 2022 $39,117 White non-Hispanic householders$34,255 Black householders$67,817 Asian householders$53,019 Two or more races householders$61,089 Hispanic or Latino race householdersMedian 2022 house value $92,195 White Non-Hispanic householders$74,673 Black or African American householders$86,669 American Indian or Alaska Native householders $105,944 Asian householders$145,302 Some other race householders$79,256 Two or more races householders$89,634 Hispanic or Latino householders
Median age by race in Canton
41.9 Median age for White residents40.5 43.2 31.5 Median age for Black or African American residents35.1 27.5 -666,666,666.0 Median age for American Indian / Alaska Native residents-666,666,666.0 -666,666,666.0 30.2 Median age for Asian residents27.0 34.8 -666,666,666.0 Median age for Native Hawaiian / Pacific Islander residents-666,666,666.0 -666,666,666.0 -666,666,666.0 Median age for Other race residents-666,666,666.0 -666,666,666.0 18.1 Median age for Two or more races residents15.6 24.6 42.5 Median age for White alone residents40.7 43.5 20.8 Median age for Hispanic or Latino residents36.3 20.6
Owner/renter occupied households by race in Canton
House owners and renters - White residents 10,909 53.2% Owner occupied9,605 46.8% Renter occupiedHouse owners and renters - Black or African American residents 2,326 42.7% Owner occupied3,124 57.3% Renter occupiedHouse owners and renters - Asian residents 101 79.2% Owner occupied27 20.8% Renter occupiedHouse owners and renters - Other race residents 53 12.3% Owner occupied376 87.7% Renter occupiedHouse owners and renters - Two or more races residents 1,463 44.4% Owner occupied1,832 55.6% Renter occupiedHouse owners and renters - White alone residents 10,909 53.9% Owner occupied9,348 46.1% Renter occupiedHouse owners and renters - Hispanic or Latino residents 602 45.0% Owner occupied736 55.0% Renter occupied
Language usage in Canton
English speakers - Total 96.4% of residents of Canton speak English at home.
2.2% of residents speak Spanish at home 831 58.3% Speak English very well595 41.7% Speak English less than very well1.0% of residents speak other language at home 466 69.6% Speak English very well204 30.4% Speak English less than very well
English speakers - Born in the United States 95.7% of residents of Canton speak English at home.
3.1% of residents speak Spanish at home 176 55.0% Speak English very well144 45.0% Speak English less than very well0.3% of residents speak other language at home 34 100.0% Speak English very well
English speakers - Native, born elsewhere 88.2% of residents of Canton speak English at home.
13.6% of residents speak Spanish at home 64 91.4% Speak English very well6 8.6% Speak English less than very well
English speakers - Foreign-born 33.2% of residents of Canton speak English at home.
28.4% of residents speak Spanish at home 155 32.6% Speak English very well320 67.4% Speak English less than very well25.5% of residents speak other language at home 208 48.8% Speak English very well218 51.2% Speak English less than very well
White (Caucasian) - Speak only English Native:
98.0% (39,642)Foreign-born:
26.8% (235)
White (Caucasian) - Speak another language Native:
2.0% (793)Foreign-born:
76.3% (668)
Black or African American - Speak only English Native:
99.1% (15,315)Foreign-born:
66.4% (87)
Black or African American - Speak another language Native:
0.8% (122)Foreign-born:
37.5% (49)
Asian - Speak only English Native:
100.0% (48)Foreign-born:
60.7% (188)
Asian - Speak another language Native:
14.2% (7)Foreign-born:
44.5% (138)
Other race - Speak only English Native:
59.1% (260)Foreign-born:
13.4% (56)
Other race - Speak another language Native:
40.8% (180)Foreign-born:
85.2% (358)
Two or more races - Speak only English Native:
94.4% (7,735)Foreign-born:
31.3% (79)
Two or more races - Speak another language Native:
5.0% (412)Foreign-born:
65.3% (166)
White alone - Speak only English Native:
98.8% (39,135)Foreign-born:
39.9% (203)
White alone - Speak another language Native:
1.2% (485)Foreign-born:
60.4% (308)
Hispanic or Latino - Speak only English Native:
71.8% (2,062)Foreign-born:
32.9% (170)
Hispanic or Latino - Speak another language Native:
19.7% (567)Foreign-born:
93.1% (481)
Foreign-born residents in Canton 1,846 residents are foreign born (1.4% Latin America , 0.5% Europe , 0.4% Asia ).
Marital status for residents in Canton Marital status - White (Caucasian) population 15 years and over
Males 42.4% Never married35.2% Now married2.6% Separated2.5% Widowed17.2% DivorcedFemales 32.5% Never married32.6% Now married1.7% Separated11.6% Widowed21.5% DivorcedWomen who gave birth in the past 12 months Now married:
23.5% (148)Unmarried:
76.5% (481)
Women who did not give birth in the past 12 months Now married:
28.4% (2,620)Unmarried:
71.6% (6,617)
Marital status - Black or African American population 15 years and over
Males 57.3% Never married36.8% Now married0.0% Separated0.0% Widowed5.8% DivorcedFemales 52.5% Never married18.0% Now married8.8% Separated11.4% Widowed9.2% DivorcedWomen who gave birth in the past 12 months Now married:
18.7% (72)Unmarried:
81.3% (313)
Women who did not give birth in the past 12 months Now married:
15.6% (561)Unmarried:
84.4% (3,045)
Marital status - Asian population 15 years and over
Males 46.5% Never married53.5% Now married0.0% Separated0.0% Widowed0.0% DivorcedFemales 4.9% Never married84.3% Now married0.0% Separated5.9% Widowed4.9% DivorcedWomen who did not give birth in the past 12 months Now married:
83.5% (91)Unmarried:
16.5% (18)
Marital status - Other race population 15 years and over
Males 78.6% Never married15.4% Now married0.0% Separated0.0% Widowed6.0% DivorcedFemales 78.6% Never married4.8% Now married0.0% Separated4.8% Widowed11.7% DivorcedWomen who did not give birth in the past 12 months Now married:
5.9% (16)Unmarried:
94.1% (254)
Marital status - Two or more races population 15 years and over
Males 72.9% Never married19.3% Now married0.4% Separated0.3% Widowed7.1% DivorcedFemales 70.5% Never married15.3% Now married1.1% Separated6.2% Widowed6.9% DivorcedWomen who gave birth in the past 12 months Now married:
51.4% (64)Unmarried:
48.6% (61)
Women who did not give birth in the past 12 months Now married:
12.1% (278)Unmarried:
87.9% (2,026)
Marital status - White alone, not Hispanic / Latino population 15 years and over
Males 42.0% Never married35.5% Now married2.6% Separated2.5% Widowed17.4% DivorcedFemales 30.8% Never married33.5% Now married1.8% Separated11.9% Widowed22.1% DivorcedWomen who gave birth in the past 12 months Now married:
23.5% (148)Unmarried:
76.5% (481)
Women who did not give birth in the past 12 months Now married:
29.9% (2,620)Unmarried:
70.1% (6,132)
Marital status - Hispanic or Latino population 15 years and over
Males 62.8% Never married31.9% Now married0.0% Separated0.5% Widowed4.8% DivorcedFemales 54.2% Never married28.8% Now married0.0% Separated6.4% Widowed10.6% DivorcedWomen who gave birth in the past 12 months Now married:
0.0% (0)Unmarried:
100.0% (16)
Women who did not give birth in the past 12 months Now married:
26.0% (218)Unmarried:
74.0% (621)
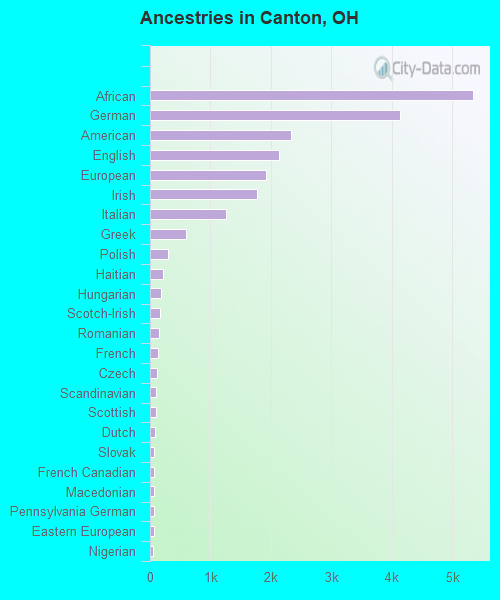
Ancestries in Canton
5,344 15.2% African4,130 11.8% German2,339 6.7% American2,139 6.1% English1,915 5.4% European1,764 5.0% Irish1,254 3.6% Italian588 1.7% Greek297 0.8% Polish210 0.6% Haitian180 0.5% Hungarian167 0.5% Scotch-Irish155 0.4% Romanian137 0.4% French122 0.3% Czech106 0.3% Scandinavian93 0.3% Scottish80 0.2% Dutch74 0.2% Slovak73 0.2% French Canadian65 0.2% Macedonian62 0.2% Pennsylvania German59 0.2% Eastern European51 0.1% Nigerian48 0.1% Belgian48 0.1% Swedish47 0.1% Croatian37 0.1% Norwegian36 0.1% Portuguese34 0.10% Austrian33 0.09% Swiss31 0.09% Welsh30 0.09% Syrian29 0.08% Canadian26 0.07% Lithuanian25 0.07% Cape Verdean24 0.07% Serbian20 0.06% Czechoslovakian18 0.05% Celtic17 0.05% Albanian17 0.05% Israeli14 0.04% British14 0.04% Ukrainian12 0.03% Lebanese10 0.03% Australian10 0.03% Egyptian10 0.03% South African8 0.02% Slovene4 0.01% Russian3 0.01% Northern European3 0.01% Jamaican
Geographical mobility in Canton Same house 1 year ago 34,637 81.9% White (Caucasian)14,977 87.5% Black or African American16 58.0% American Indian / Alaska Native325 88.5% Asian740 81.2% Other race8,054 91.4% Two or more races34,229 82.2% White alone, not Hispanic / Latino2,730 74.4% Hispanic or LatinoMoved within same county 5,990 14.2% White / Caucasian1,387 8.1% Black or African American7 26.2% American Indian / Alaska Native20 5.3% Asian78 8.5% Other race1,534 17.4% Two or more races5,775 13.9% White alone, not Hispanic / Latino664 18.1% Hispanic or LatinoMoved within same state 555 1.3% White / Caucasian397 2.3% Black or African American158 1.8% Two or more races555 1.3% White alone, not Hispanic / Latino56 1.5% Hispanic or LatinoMoved from different state 1,040 2.5% White / Caucasian246 1.4% Black or African American10 2.7% Asian75 8.3% Other race39 0.4% Two or more races1,040 2.5% White alone, not Hispanic / Latino90 2.4% Hispanic or LatinoMoved from abroad 60 0.1% White12 3.2% Asian60 0.1% White alone, not Hispanic / Latino31 0.8% Hispanic or Latino
Children Nativity (place of birth) in Canton
Children under 6 years - Living with two parents Both parents native 1,849 100.0% NativeBoth parents foreign-born 61 100.0% NativeOne native, one foreign-born parent 57 100.0% NativeChildren under 6 years - Living with one parent Native parent 3,718 99.9% Native2 0.1% Foreign-bornForeign-born parent 113 69.4% Native50 30.6% Foreign-bornChildren 6 to 17 years - Living with two parents Both parents native 3,202 100.0% NativeBoth parents foreign-born 35 100.0% NativeOne native, one foreign-born parent 223 100.0% NativeChildren 6 to 17 years - Living with one parent Native parent 6,209 100.0% NativeForeign-born parent 248 50.4% Native244 49.6% Foreign-born
Grandparents responsible for own grandchildren in Canton
Grandparents (30 to 59 years) White / Caucasian 393 62.0% Responsible for grandchildren241 38.0% Not responsible for grandchildrenBlack or African American 99 63.9% Responsible for grandchildren56 36.1% Not responsible for grandchildrenTwo or more races 74 100.0% Responsible for grandchildrenWhite alone, not Hispanic / Latino 393 65.8% Responsible for grandchildren204 34.2% Not responsible for grandchildrenHispanic or Latino 15 27.8% Responsible for grandchildren40 72.2% Not responsible for grandchildrenGrandparents (60 years and over) White / Caucasian 371 64.7% Responsible for grandchildren203 35.3% Not responsible for grandchildrenBlack or African American 36 19.8% Responsible for grandchildren144 80.2% Not responsible for grandchildrenTwo or more races 29 67.9% Responsible for grandchildren14 32.1% Not responsible for grandchildrenWhite alone, not Hispanic / Latino 364 65.7% Responsible for grandchildren190 34.3% Not responsible for grandchildrenHispanic or Latino 6 100.0% Responsible for grandchildren
Zip codes: 44641 , 44702 , 44703 , 44704 , 44705 , 44706 , 44707 , 44708 , 44709 , 44710 , 44714 , 44718 , 44720 , 44721 , 44730 .