Races in Capron, Illinois (IL) Detailed Stats
Data:
Races - White alone (%)
Races - White alone (% change since 2000)
Races - Black alone (%)
Races - Black alone (% change since 2000)
Races - American Indian alone (%)
Races - American Indian alone (% change since 2000)
Races - Asian alone (%)
Races - Asian alone (% change since 2000)
Races - Hispanic (%)
Races - Hispanic (% change since 2000)
Races - Native Hawaiian and Other Pacific Islander alone (%)
Races - Native Hawaiian and Other Pacific Islander alone (% change since 2000)
Races - Two or more races(%)
Races - Two or more races(% change since 2000)
Races - Other race alone (%)
Races - Other race alone (% change since 2000)
Racial diversity
Place of birth - Born in state of residence (%)
Place of birth - Born in state of residence (%) - White
Place of birth - Born in state of residence (%) - Black or African American
Place of birth - Born in state of residence (%) - Asian
Place of birth - Born in state of residence (%) - Hispanic or Latino
Place of birth - Born in state of residence (%) - American Indian and Alaska Native
Place of birth - Born in state of residence (%) - Multirace
Place of birth - Born in state of residence (%) - Other Race
Place of birth - Born in other state (%)
Place of birth - Born in other state (%) - White
Place of birth - Born in other state (%) - Black or African American
Place of birth - Born in other state (%) - Asian
Place of birth - Born in other state (%) - Hispanic or Latino
Place of birth - Born in other state (%) - American Indian and Alaska Native
Place of birth - Born in other state (%) - Multirace
Place of birth - Born in other state (%) - Other Race
Place of birth - Native, outside of US (%)
Place of birth - Native, outside of US (%) - White
Place of birth - Native, outside of US (%) - Black or African American
Place of birth - Native, outside of US (%) - Asian
Place of birth - Native, outside of US (%) - Hispanic or Latino
Place of birth - Native, outside of US (%) - American Indian and Alaska Native
Place of birth - Native, outside of US (%) - Multirace
Place of birth - Native, outside of US (%) - Other Race
Place of birth - Foreign born (%)
Place of birth - Foreign born (%) - White
Place of birth - Foreign born (%) - Black or African American
Place of birth - Foreign born (%) - Asian
Place of birth - Foreign born (%) - Hispanic or Latino
Place of birth - Foreign born (%) - American Indian and Alaska Native
Place of birth - Foreign born (%) - Multirace
Place of birth - Foreign born (%) - Other Race
Residents speaking English at home (%)
Residents speaking English at home - Born in the United States (%)
Residents speaking English at home - Native, born elsewhere (%)
Residents speaking English at home - Foreign born (%)
Residents speaking Spanish at home (%)
Residents speaking Spanish at home - Born in the United States (%)
Residents speaking Spanish at home - Native, born elsewhere (%)
Residents speaking Spanish at home - Foreign born (%)
Residents speaking other language at home (%)
Residents speaking other language at home - Born in the United States (%)
Residents speaking other language at home - Native, born elsewhere (%)
Residents speaking other language at home - Foreign born (%)
Marital status - Never married (%)
Marital status - Now married (%)
Marital status - Separated (%)
Marital status - Widowed (%)
Marital status - Divorced (%)
Ancestries Reported - Arab (%)
Ancestries Reported - Czech (%)
Ancestries Reported - Danish (%)
Ancestries Reported - Dutch (%)
Ancestries Reported - English (%)
Ancestries Reported - French (%)
Ancestries Reported - French Canadian (%)
Ancestries Reported - German (%)
Ancestries Reported - Greek (%)
Ancestries Reported - Hungarian (%)
Ancestries Reported - Irish (%)
Ancestries Reported - Italian (%)
Ancestries Reported - Lithuanian (%)
Ancestries Reported - Norwegian (%)
Ancestries Reported - Polish (%)
Ancestries Reported - Portuguese (%)
Ancestries Reported - Russian (%)
Ancestries Reported - Scotch-Irish (%)
Ancestries Reported - Scottish (%)
Ancestries Reported - Slovak (%)
Ancestries Reported - Subsaharan African (%)
Ancestries Reported - Swedish (%)
Ancestries Reported - Swiss (%)
Ancestries Reported - Ukrainian (%)
Ancestries Reported - United States (%)
Ancestries Reported - Welsh (%)
Ancestries Reported - West Indian (%)
Ancestries Reported - Other (%)
Geographical mobility - Same house 1 year ago (%)
Geographical mobility - Same house 1 year ago (%) - White
Geographical mobility - Same house 1 year ago (%) - Black or African American
Geographical mobility - Same house 1 year ago (%) - Asian
Geographical mobility - Same house 1 year ago (%) - Hispanic or Latino
Geographical mobility - Same house 1 year ago (%) - American Indian and Alaska Native
Geographical mobility - Same house 1 year ago (%) - Multirace
Geographical mobility - Same house 1 year ago (%) - Other Race
Geographical mobility - Moved within same county (%)
Geographical mobility - Moved within same county (%) - White
Geographical mobility - Moved within same county (%) - Black or African American
Geographical mobility - Moved within same county (%) - Asian
Geographical mobility - Moved within same county (%) - Hispanic or Latino
Geographical mobility - Moved within same county (%) - American Indian and Alaska Native
Geographical mobility - Moved within same county (%) - Multirace
Geographical mobility - Moved within same county (%) - Other Race
Geographical mobility - Moved from different county within same state (%)
Geographical mobility - Moved from different county within same state (%) - White
Geographical mobility - Moved from different county within same state (%) - Black or African American
Geographical mobility - Moved from different county within same state (%) - Asian
Geographical mobility - Moved from different county within same state (%) - Hispanic or Latino
Geographical mobility - Moved from different county within same state (%) - American Indian and Alaska Native
Geographical mobility - Moved from different county within same state (%) - Multirace
Geographical mobility - Moved from different county within same state (%) - Other Race
Geographical mobility - Moved from different state (%)
Geographical mobility - Moved from different state (%) - White
Geographical mobility - Moved from different state (%) - Black or African American
Geographical mobility - Moved from different state (%) - Asian
Geographical mobility - Moved from different state (%) - Hispanic or Latino
Geographical mobility - Moved from different state (%) - American Indian and Alaska Native
Geographical mobility - Moved from different state (%) - Multirace
Geographical mobility - Moved from different state (%) - Other Race
Geographical mobility - Moved from abroad (%)
Geographical mobility - Moved from abroad (%) - White
Geographical mobility - Moved from abroad (%) - Black or African American
Geographical mobility - Moved from abroad (%) - Asian
Geographical mobility - Moved from abroad (%) - Hispanic or Latino
Geographical mobility - Moved from abroad (%) - American Indian and Alaska Native
Geographical mobility - Moved from abroad (%) - Multirace
Geographical mobility - Moved from abroad (%) - Other Race
Place of birth for the foreign-born population - Ireland (%)
Place of birth for the foreign-born population - Denmark (%)
Place of birth for the foreign-born population - Norway (%)
Place of birth for the foreign-born population - Sweden (%)
Place of birth for the foreign-born population - United Kingdom (%)
Place of birth for the foreign-born population - England (%)
Place of birth for the foreign-born population - Scotland (%)
Place of birth for the foreign-born population - Other Northern Europe (%)
Place of birth for the foreign-born population - Austria (%)
Place of birth for the foreign-born population - Belgium (%)
Place of birth for the foreign-born population - France (%)
Place of birth for the foreign-born population - Germany (%)
Place of birth for the foreign-born population - Netherlands (%)
Place of birth for the foreign-born population - Switzerland (%)
Place of birth for the foreign-born population - Other Western Europe (%)
Place of birth for the foreign-born population - Greece (%)
Place of birth for the foreign-born population - Italy (%)
Place of birth for the foreign-born population - Portugal (%)
Place of birth for the foreign-born population - Spain (%)
Place of birth for the foreign-born population - Other Southern Europe (%)
Place of birth for the foreign-born population - Albania (%)
Place of birth for the foreign-born population - Belarus (%)
Place of birth for the foreign-born population - Bosnia and Herzegovina (%)
Place of birth for the foreign-born population - Bulgaria (%)
Place of birth for the foreign-born population - Croatia (%)
Place of birth for the foreign-born population - Czechoslovakia (%)
Place of birth for the foreign-born population - Hungary (%)
Place of birth for the foreign-born population - Latvia (%)
Place of birth for the foreign-born population - Lithuania (%)
Place of birth for the foreign-born population - North Macedonia (Macedonia) (%)
Place of birth for the foreign-born population - Moldova (%)
Place of birth for the foreign-born population - Poland (%)
Place of birth for the foreign-born population - Romania (%)
Place of birth for the foreign-born population - Russia (%)
Place of birth for the foreign-born population - Serbia (%)
Place of birth for the foreign-born population - Ukraine (%)
Place of birth for the foreign-born population - Other Eastern Europe (%)
Place of birth for the foreign-born population - China (%)
Place of birth for the foreign-born population - Hong Kong (%)
Place of birth for the foreign-born population - Taiwan (%)
Place of birth for the foreign-born population - Japan (%)
Place of birth for the foreign-born population - Korea (%)
Place of birth for the foreign-born population - Other Eastern Asia (%)
Place of birth for the foreign-born population - Afghanistan (%)
Place of birth for the foreign-born population - Bangladesh (%)
Place of birth for the foreign-born population - India (%)
Place of birth for the foreign-born population - Iran (%)
Place of birth for the foreign-born population - Kazakhstan (%)
Place of birth for the foreign-born population - Nepal (%)
Place of birth for the foreign-born population - Pakistan (%)
Place of birth for the foreign-born population - Sri Lanka (%)
Place of birth for the foreign-born population - Uzbekistan (%)
Place of birth for the foreign-born population - Other South Central Asia (%)
Place of birth for the foreign-born population - Burma (%)
Place of birth for the foreign-born population - Cambodia (%)
Place of birth for the foreign-born population - Indonesia (%)
Place of birth for the foreign-born population - Laos (%)
Place of birth for the foreign-born population - Malaysia (%)
Place of birth for the foreign-born population - Philippines (%)
Place of birth for the foreign-born population - Singapore (%)
Place of birth for the foreign-born population - Thailand (%)
Place of birth for the foreign-born population - Vietnam (%)
Place of birth for the foreign-born population - Other South Eastern Asia (%)
Place of birth for the foreign-born population - Armenia (%)
Place of birth for the foreign-born population - Iraq (%)
Place of birth for the foreign-born population - Israel (%)
Place of birth for the foreign-born population - Jordan (%)
Place of birth for the foreign-born population - Kuwait (%)
Place of birth for the foreign-born population - Lebanon (%)
Place of birth for the foreign-born population - Saudi Arabia (%)
Place of birth for the foreign-born population - Syria (%)
Place of birth for the foreign-born population - Turkey (%)
Place of birth for the foreign-born population - Yemen (%)
Place of birth for the foreign-born population - Other Western Asia (%)
Place of birth for the foreign-born population - Eritrea (%)
Place of birth for the foreign-born population - Ethiopia (%)
Place of birth for the foreign-born population - Kenya (%)
Place of birth for the foreign-born population - Somalia (%)
Place of birth for the foreign-born population - Uganda (%)
Place of birth for the foreign-born population - Zimbabwe (%)
Place of birth for the foreign-born population - Other Eastern Africa (%)
Place of birth for the foreign-born population - Cameroon (%)
Place of birth for the foreign-born population - Congo (%)
Place of birth for the foreign-born population - Democratic Republic of Congo (Zaire) (%)
Place of birth for the foreign-born population - Other Middle Africa (%)
Place of birth for the foreign-born population - Egypt (%)
Place of birth for the foreign-born population - Morocco (%)
Place of birth for the foreign-born population - Sudan (%)
Place of birth for the foreign-born population - Other Northern Africa (%)
Place of birth for the foreign-born population - South Africa (%)
Place of birth for the foreign-born population - Other Southern Africa (%)
Place of birth for the foreign-born population - Cabo Verde (%)
Place of birth for the foreign-born population - Ghana (%)
Place of birth for the foreign-born population - Liberia (%)
Place of birth for the foreign-born population - Nigeria (%)
Place of birth for the foreign-born population - Senegal (%)
Place of birth for the foreign-born population - Sierra Leone (%)
Place of birth for the foreign-born population - Other Western Africa (%)
Place of birth for the foreign-born population - Australia (%)
Place of birth for the foreign-born population - New Zealand (%)
Place of birth for the foreign-born population - Fiji (%)
Place of birth for the foreign-born population - Micronesia (%)
Place of birth for the foreign-born population - Bahamas (%)
Place of birth for the foreign-born population - Barbados (%)
Place of birth for the foreign-born population - Cuba (%)
Place of birth for the foreign-born population - Dominica (%)
Place of birth for the foreign-born population - Dominican Republic (%)
Place of birth for the foreign-born population - Grenada (%)
Place of birth for the foreign-born population - Haiti (%)
Place of birth for the foreign-born population - Jamaica (%)
Place of birth for the foreign-born population - St. Vincent and the Grenadines (%)
Place of birth for the foreign-born population - Trinidad and Tobago (%)
Place of birth for the foreign-born population - West Indies (%)
Place of birth for the foreign-born population - Other Caribbean (%)
Place of birth for the foreign-born population - Belize (%)
Place of birth for the foreign-born population - Costa Rica (%)
Place of birth for the foreign-born population - El Salvador (%)
Place of birth for the foreign-born population - Guatemala (%)
Place of birth for the foreign-born population - Honduras (%)
Place of birth for the foreign-born population - Mexico (%)
Place of birth for the foreign-born population - Nicaragua (%)
Place of birth for the foreign-born population - Panama (%)
Place of birth for the foreign-born population - Other Central America (%)
Place of birth for the foreign-born population - Argentina (%)
Place of birth for the foreign-born population - Bolivia (%)
Place of birth for the foreign-born population - Brazil (%)
Place of birth for the foreign-born population - Chile (%)
Place of birth for the foreign-born population - Colombia (%)
Place of birth for the foreign-born population - Ecuador (%)
Place of birth for the foreign-born population - Guyana (%)
Place of birth for the foreign-born population - Peru (%)
Place of birth for the foreign-born population - Uruguay (%)
Place of birth for the foreign-born population - Venezuela (%)
Place of birth for the foreign-born population - Other South America (%)
Place of birth for the foreign-born population - Canada (%)
Place of birth for the foreign-born population - Other Northern America (%)
Place of birth for the foreign-born population - Other (%)
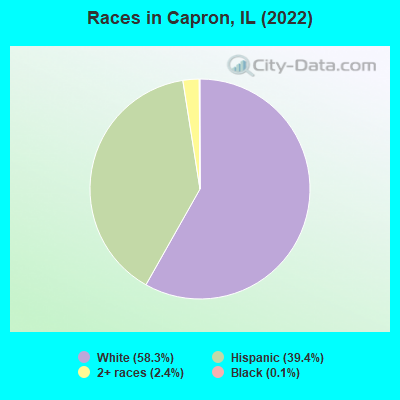
According to 2022 data, the most numerous races in Capron, IL are White alone (784 residents), Hispanic (529 residents), and Black alone (2 residents). 70.9% of Capron residents speak English at home. 15.5% of Capron, IL residents are foreign-born (15.3% born in Latin America), which is 9.5% greater than the foreign-born rate of 14.0% across the entire state of Illinois.
Race distribution in Capron
2000 2022
8,424,140 67.8% White alone 1,856,152 14.9% Black alone 1,530,262 12.3% Hispanic 419,916 3.4% Asian alone 153,996 1.2% Two or more races 13,479 0.1% Other race alone 18,232 0.1% American Indian alone 3,116 0.03% Native Hawaiian and Other
7,356,301 58.5% White alone 2,299,726 18.3% Hispanic 1,660,423 13.2% Black alone 747,296 5.9% Asian alone 458,599 3.6% Two or more races 45,386 0.4% Other race alone 10,405 0.08% American Indian alone 3,896 0.03% Native Hawaiian and Other
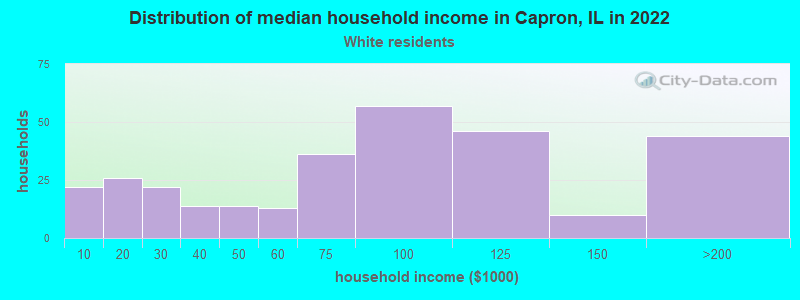
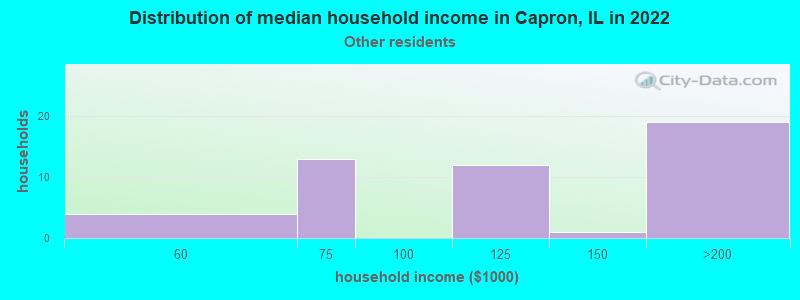
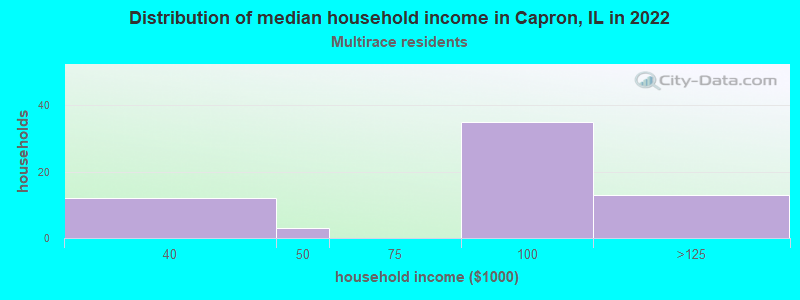
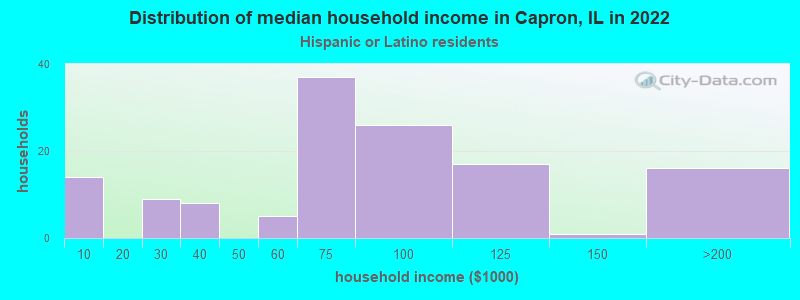
Income and house value in Capron Median household income in 2022 $91,094 White non-Hispanic householders$114,066 Some other race householders$87,631 Two or more races householders$69,575 Hispanic or Latino race householdersMedian 2022 house value $157,248 White Non-Hispanic householders$241,064 Black or African American householders$179,203 American Indian or Alaska Native householders$148,347 Some other race householders$159,177 Hispanic or Latino householders
Median age by race in Capron
32.4 Median age for White residents33.5 31.8 -677,966,101.0 Median age for Black or African American residents-676,737,159.4 -686,222,221.5 -696,696,696.0 Median age for American Indian / Alaska Native residents-720,238,094.5 -688,956,432.9 -684,491,977.9 Median age for Asian residents-684,981,684.3 -682,291,666.0 -593,236,714.4 Median age for Native Hawaiian / Pacific Islander residents-658,536,584.7 -576,015,108.0 21.7 Median age for Other race residents21.9 20.5 48.2 Median age for Two or more races residents39.0 64.2 34.0 Median age for White alone residents31.5 34.1 27.9 Median age for Hispanic or Latino residents32.0 25.9
Owner/renter occupied households by race in Capron
House owners and renters - White residents 241 79.7% Owner occupied61 20.3% Renter occupiedHouse owners and renters - Other race residents 34 73.7% Owner occupied12 26.3% Renter occupiedHouse owners and renters - Two or more races residents 65 95.6% Owner occupied3 4.4% Renter occupiedHouse owners and renters - White alone residents 233 88.1% Owner occupied32 11.9% Renter occupiedHouse owners and renters - Hispanic or Latino residents 86 65.4% Owner occupied45 34.6% Renter occupied
Language usage in Capron
English speakers - Total 70.9% of residents of Capron speak English at home.
29.1% of residents speak Spanish at home 196 53.7% Speak English very well169 46.3% Speak English less than very well
English speakers - Born in the United States 93.1% of residents of Capron speak English at home.
6.0% of residents speak Spanish at home 14 100.0% Speak English very well
English speakers - Foreign-born 13.0% of residents of Capron speak English at home.
86.5% of residents speak Spanish at home 56 31.1% Speak English very well124 68.9% Speak English less than very well
White (Caucasian) - Speak only English Native:
93.5% (776)Foreign-born:
35.0% (24)
White (Caucasian) - Speak another language Native:
6.1% (51)Foreign-born:
67.1% (47)
Other race - Speak another language Native:
66.9% (87)Foreign-born:
99.9% (103)
Two or more races - Speak another language Native:
59.4% (50)Foreign-born:
100.0% (42)
Hispanic or Latino - Speak only English Native:
28.6% (74)Foreign-born:
13.6% (29)
Hispanic or Latino - Speak another language Native:
70.9% (182)Foreign-born:
86.2% (182)
Foreign-born residents in Capron 208 residents are foreign born (15.3% Latin America ).
This city:
15.5%Illinois:
14.1%
Marital status for residents in Capron Marital status - White (Caucasian) population 15 years and over
Males 30.6% Never married51.1% Now married5.9% Separated0.7% Widowed11.6% DivorcedFemales 38.7% Never married41.0% Now married0.0% Separated13.1% Widowed7.3% DivorcedWomen who gave birth in the past 12 months Now married:
68.8% (10)Unmarried:
31.2% (4)
Women who did not give birth in the past 12 months Now married:
38.1% (89)Unmarried:
61.9% (144)
Marital status - Other race population 15 years and over
Males 81.2% Never married18.8% Now married0.0% Separated0.0% Widowed0.0% DivorcedFemales 72.0% Never married28.0% Now married0.0% Separated0.0% Widowed0.0% DivorcedWomen who gave birth in the past 12 months Now married:
0.0% (0)Unmarried:
100.0% (16)
Women who did not give birth in the past 12 months Now married:
28.6% (19)Unmarried:
71.4% (47)
Marital status - Two or more races population 15 years and over
Males 48.6% Never married28.6% Now married22.9% Separated0.0% Widowed0.0% DivorcedFemales 10.0% Never married70.0% Now married0.0% Separated0.0% Widowed20.0% DivorcedWomen who did not give birth in the past 12 months Now married:
60.0% (9)Unmarried:
40.0% (6)
Marital status - White alone, not Hispanic / Latino population 15 years and over
Males 37.4% Never married44.3% Now married7.4% Separated0.9% Widowed10.0% DivorcedFemales 40.8% Never married38.5% Now married0.0% Separated12.1% Widowed8.6% DivorcedWomen who gave birth in the past 12 months Now married:
80.0% (8)Unmarried:
20.0% (2)
Women who did not give birth in the past 12 months Now married:
32.7% (69)Unmarried:
67.3% (141)
Marital status - Hispanic or Latino population 15 years and over
Males 41.5% Never married46.2% Now married4.1% Separated0.0% Widowed8.2% DivorcedFemales 42.8% Never married46.2% Now married0.0% Separated6.4% Widowed4.6% DivorcedWomen who gave birth in the past 12 months Now married:
15.0% (3)Unmarried:
85.0% (17)
Women who did not give birth in the past 12 months Now married:
45.2% (48)Unmarried:
54.8% (58)
Ancestries in Capron
125 19.0% German66 10.0% American27 4.1% Irish15 2.3% English11 1.7% Norwegian6 0.9% French6 0.9% Swedish4 0.6% Polish3 0.5% Welsh
Children Nativity (place of birth) in Capron
Children under 6 years - Living with two parents Both parents native 20 100.0% NativeBoth parents foreign-born 22 100.0% NativeOne native, one foreign-born parent 15 100.0% NativeChildren under 6 years - Living with one parent Native parent 23 100.0% NativeForeign-born parent 15 100.0% NativeChildren 6 to 17 years - Living with two parents Both parents native 131 100.0% NativeBoth parents foreign-born 17 93.9% Native1 6.1% Foreign-bornOne native, one foreign-born parent 5 100.0% NativeChildren 6 to 17 years - Living with one parent Native parent 40 100.0% NativeForeign-born parent 75 49.8% Native75 50.2% Foreign-born
Place of birth for residents in Capron 208 Americas208 Latin America208 Central America
Grandparents responsible for own grandchildren in Capron
Grandparents (30 to 59 years) White / Caucasian 2 66.7% Responsible for grandchildren1 33.3% Not responsible for grandchildrenOther race 19 100.0% Not responsible for grandchildrenWhite alone, not Hispanic / Latino 1 100.0% Not responsible for grandchildrenHispanic or Latino 3 16.6% Responsible for grandchildren17 83.4% Not responsible for grandchildrenGrandparents (60 years and over) White / Caucasian 4 15.3% Responsible for grandchildren20 84.7% Not responsible for grandchildrenWhite alone, not Hispanic / Latino 4 48.6% Responsible for grandchildren4 51.4% Not responsible for grandchildrenHispanic or Latino 17 100.0% Not responsible for grandchildren