Races in Carlisle, New York (NY) Detailed Stats
Ancestries, Foreign-born residents, place of birth

Discuss Carlisle, New York races on our local forum with over 2,400,000 registered users
1.8% of Carlisle, NY residents are foreign-born , which is 1108.6% less than the foreign-born rate of 22.0% across the entire state of New York.
Race distribution in Carlisle

- 1,67895.4%White alone
- 412.3%Hispanic
- 140.8%Two or more races
- 90.5%American Indian alone
- 60.3%Black alone
- 50.3%Asian alone
- 40.2%Other race alone
- 10.06%Native Hawaiian and Other
Pacific Islander alone

2000
2022
-
- 11,760,98162.0%White alone
- 2,867,58315.1%Hispanic
- 2,812,62314.8%Black alone
- 1,035,9265.5%Asian alone
- 366,1161.9%Two or more races
- 75,4990.4%Other race alone
- 52,4990.3%American Indian alone
- 5,2300.03%Native Hawaiian and Other
Pacific Islander alone

-
- 10,408,93352.9%White alone
- 3,867,29919.7%Hispanic
- 2,633,84013.4%Black alone
- 1,776,2869.0%Asian alone
- 732,6703.7%Two or more races
- 216,1101.1%Other race alone
- 35,0820.2%American Indian alone
- 6,9310.04%Native Hawaiian and Other
Pacific Islander alone

Income and house value in Carlisle
- Median household income in 2022
- $78,324White non-Hispanic householders
- $159,491Black householders
- $72,426Asian householders
- $23,479Two or more races householders
- $75,856Hispanic or Latino race householders
- Median 2022 house value
- $171,043White Non-Hispanic householders
- $159,953Two or more races householders
- $145,664Hispanic or Latino householders
Household income for White non-Hispanic householders

Household income for Black householders

Household income for Asian householders

Household income for Two or more races householders

Household income for Hispanic or Latino race householders

Foreign-born residents in Carlisle
32 residents are foreign born
| This city: | 1.8% |
| New York: | 20.4% |
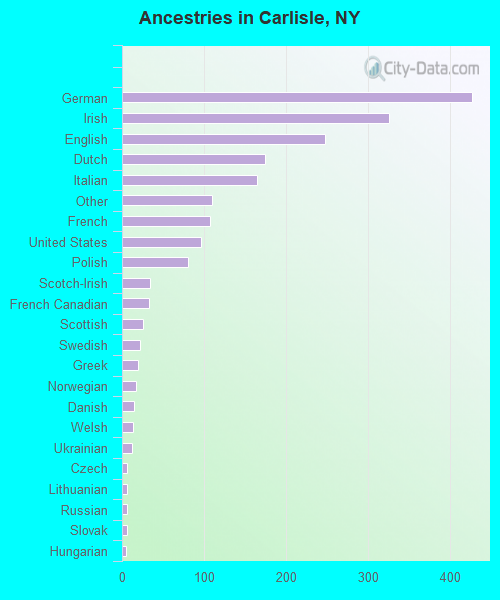
Ancestries in Carlisle

- 42621.8%German
- 32616.7%Irish
- 24712.6%English
- 1748.9%Dutch
- 1658.4%Italian
- 1105.6%Other
- 1075.5%French
- 964.9%United States
- 804.1%Polish
- 341.7%Scotch-Irish
- 331.7%French Canadian
- 261.3%Scottish
- 221.1%Swedish
- 191.0%Greek
- 170.9%Norwegian
- 150.8%Danish
- 140.7%Welsh
- 120.6%Ukrainian
- 60.3%Czech
- 60.3%Lithuanian
- 60.3%Russian
- 60.3%Slovak
- 50.3%Hungarian
- 30.2%West Indian
Zip codes: 12031.