Races in Carlisle, Pennsylvania (PA) Detailed Stats
Data:
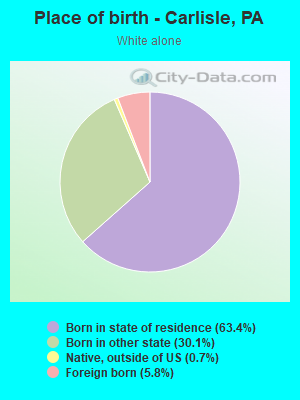
Races - White alone (%)
Races - White alone (% change since 2000)
Races - Black alone (%)
Races - Black alone (% change since 2000)
Races - American Indian alone (%)
Races - American Indian alone (% change since 2000)
Races - Asian alone (%)
Races - Asian alone (% change since 2000)
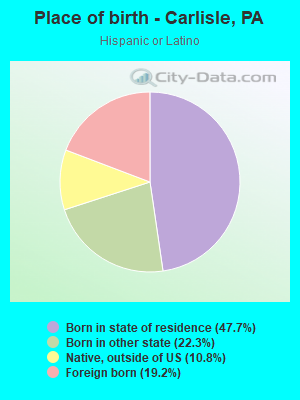
Races - Hispanic (%)
Races - Hispanic (% change since 2000)
Races - Native Hawaiian and Other Pacific Islander alone (%)
Races - Native Hawaiian and Other Pacific Islander alone (% change since 2000)
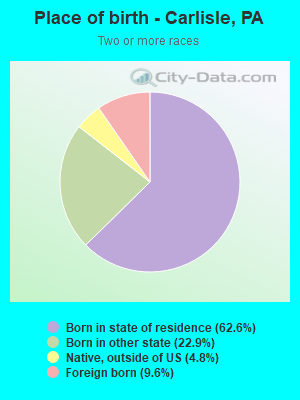
Races - Two or more races(%)
Races - Two or more races(% change since 2000)
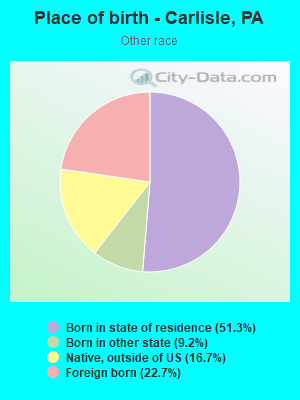
Races - Other race alone (%)
Races - Other race alone (% change since 2000)
Racial diversity
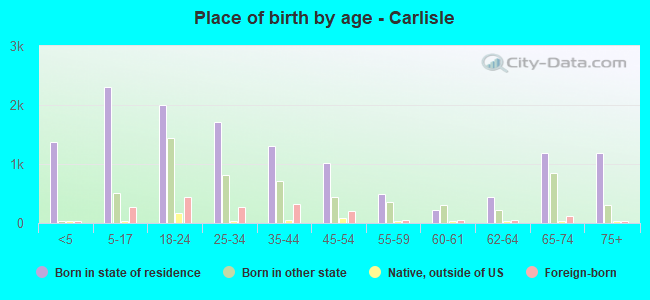
Place of birth - Born in state of residence (%)
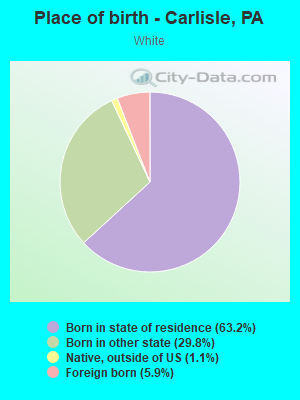
Place of birth - Born in state of residence (%) - White
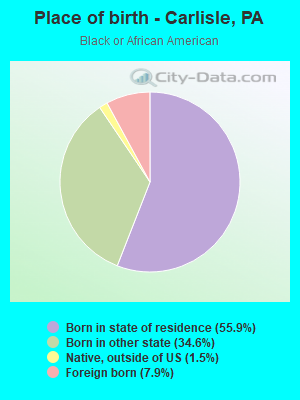
Place of birth - Born in state of residence (%) - Black or African American
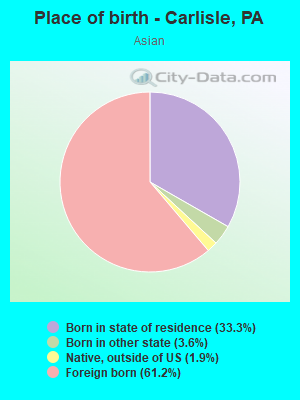
Place of birth - Born in state of residence (%) - Asian
Place of birth - Born in state of residence (%) - Hispanic or Latino
Place of birth - Born in state of residence (%) - American Indian and Alaska Native
Place of birth - Born in state of residence (%) - Multirace
Place of birth - Born in state of residence (%) - Other Race
Place of birth - Born in other state (%)
Place of birth - Born in other state (%) - White
Place of birth - Born in other state (%) - Black or African American
Place of birth - Born in other state (%) - Asian
Place of birth - Born in other state (%) - Hispanic or Latino
Place of birth - Born in other state (%) - American Indian and Alaska Native
Place of birth - Born in other state (%) - Multirace
Place of birth - Born in other state (%) - Other Race
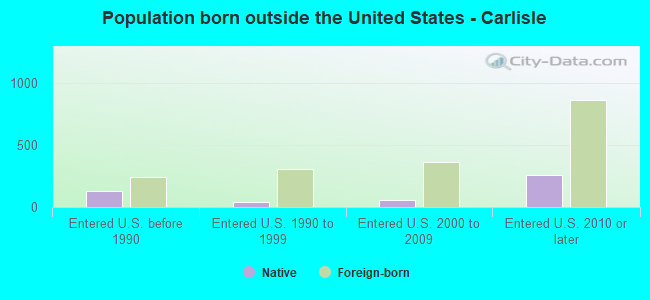
Place of birth - Native, outside of US (%)
Place of birth - Native, outside of US (%) - White
Place of birth - Native, outside of US (%) - Black or African American
Place of birth - Native, outside of US (%) - Asian
Place of birth - Native, outside of US (%) - Hispanic or Latino
Place of birth - Native, outside of US (%) - American Indian and Alaska Native
Place of birth - Native, outside of US (%) - Multirace
Place of birth - Native, outside of US (%) - Other Race
Place of birth - Foreign born (%)
Place of birth - Foreign born (%) - White
Place of birth - Foreign born (%) - Black or African American
Place of birth - Foreign born (%) - Asian
Place of birth - Foreign born (%) - Hispanic or Latino
Place of birth - Foreign born (%) - American Indian and Alaska Native
Place of birth - Foreign born (%) - Multirace
Place of birth - Foreign born (%) - Other Race
Residents speaking English at home (%)
Residents speaking English at home - Born in the United States (%)
Residents speaking English at home - Native, born elsewhere (%)
Residents speaking English at home - Foreign born (%)
Residents speaking Spanish at home (%)
Residents speaking Spanish at home - Born in the United States (%)
Residents speaking Spanish at home - Native, born elsewhere (%)
Residents speaking Spanish at home - Foreign born (%)
Residents speaking other language at home (%)
Residents speaking other language at home - Born in the United States (%)
Residents speaking other language at home - Native, born elsewhere (%)
Residents speaking other language at home - Foreign born (%)
Marital status - Never married (%)
Marital status - Now married (%)
Marital status - Separated (%)
Marital status - Widowed (%)
Marital status - Divorced (%)
Ancestries Reported - Arab (%)
Ancestries Reported - Czech (%)
Ancestries Reported - Danish (%)
Ancestries Reported - Dutch (%)
Ancestries Reported - English (%)
Ancestries Reported - French (%)
Ancestries Reported - French Canadian (%)
Ancestries Reported - German (%)
Ancestries Reported - Greek (%)
Ancestries Reported - Hungarian (%)
Ancestries Reported - Irish (%)
Ancestries Reported - Italian (%)
Ancestries Reported - Lithuanian (%)
Ancestries Reported - Norwegian (%)
Ancestries Reported - Polish (%)
Ancestries Reported - Portuguese (%)
Ancestries Reported - Russian (%)
Ancestries Reported - Scotch-Irish (%)
Ancestries Reported - Scottish (%)
Ancestries Reported - Slovak (%)
Ancestries Reported - Subsaharan African (%)
Ancestries Reported - Swedish (%)
Ancestries Reported - Swiss (%)
Ancestries Reported - Ukrainian (%)
Ancestries Reported - United States (%)
Ancestries Reported - Welsh (%)
Ancestries Reported - West Indian (%)
Ancestries Reported - Other (%)
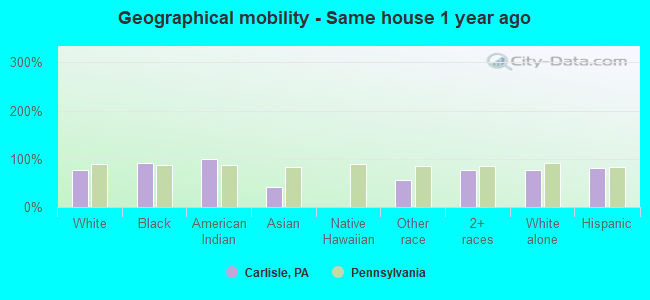
Geographical mobility - Same house 1 year ago (%)
Geographical mobility - Same house 1 year ago (%) - White
Geographical mobility - Same house 1 year ago (%) - Black or African American
Geographical mobility - Same house 1 year ago (%) - Asian
Geographical mobility - Same house 1 year ago (%) - Hispanic or Latino
Geographical mobility - Same house 1 year ago (%) - American Indian and Alaska Native
Geographical mobility - Same house 1 year ago (%) - Multirace
Geographical mobility - Same house 1 year ago (%) - Other Race
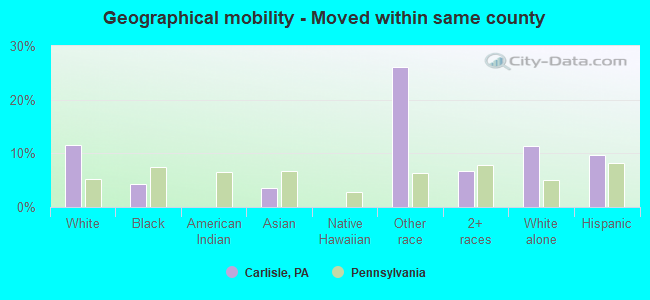
Geographical mobility - Moved within same county (%)
Geographical mobility - Moved within same county (%) - White
Geographical mobility - Moved within same county (%) - Black or African American
Geographical mobility - Moved within same county (%) - Asian
Geographical mobility - Moved within same county (%) - Hispanic or Latino
Geographical mobility - Moved within same county (%) - American Indian and Alaska Native
Geographical mobility - Moved within same county (%) - Multirace
Geographical mobility - Moved within same county (%) - Other Race
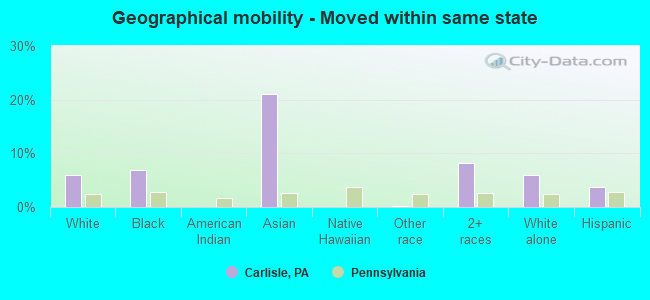
Geographical mobility - Moved from different county within same state (%)
Geographical mobility - Moved from different county within same state (%) - White
Geographical mobility - Moved from different county within same state (%) - Black or African American
Geographical mobility - Moved from different county within same state (%) - Asian
Geographical mobility - Moved from different county within same state (%) - Hispanic or Latino
Geographical mobility - Moved from different county within same state (%) - American Indian and Alaska Native
Geographical mobility - Moved from different county within same state (%) - Multirace
Geographical mobility - Moved from different county within same state (%) - Other Race
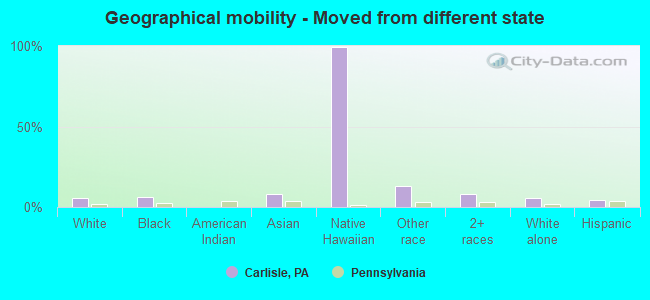
Geographical mobility - Moved from different state (%)
Geographical mobility - Moved from different state (%) - White
Geographical mobility - Moved from different state (%) - Black or African American
Geographical mobility - Moved from different state (%) - Asian
Geographical mobility - Moved from different state (%) - Hispanic or Latino
Geographical mobility - Moved from different state (%) - American Indian and Alaska Native
Geographical mobility - Moved from different state (%) - Multirace
Geographical mobility - Moved from different state (%) - Other Race
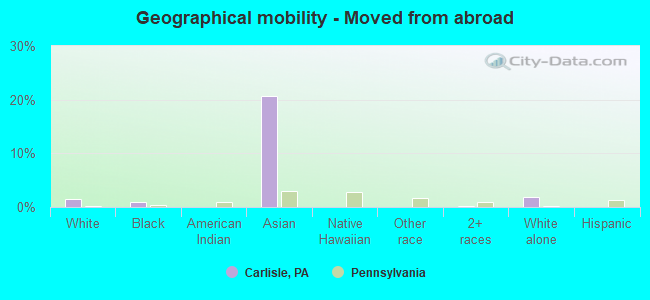
Geographical mobility - Moved from abroad (%)
Geographical mobility - Moved from abroad (%) - White
Geographical mobility - Moved from abroad (%) - Black or African American
Geographical mobility - Moved from abroad (%) - Asian
Geographical mobility - Moved from abroad (%) - Hispanic or Latino
Geographical mobility - Moved from abroad (%) - American Indian and Alaska Native
Geographical mobility - Moved from abroad (%) - Multirace
Geographical mobility - Moved from abroad (%) - Other Race
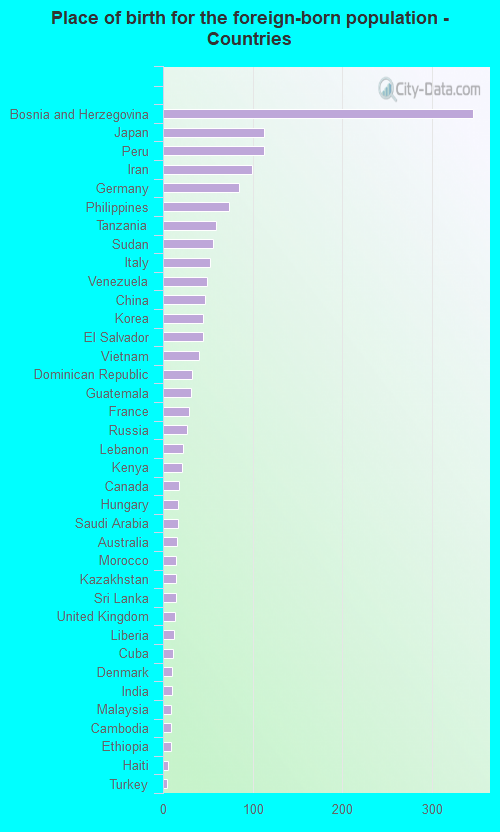
Place of birth for the foreign-born population - Ireland (%)
Place of birth for the foreign-born population - Denmark (%)
Place of birth for the foreign-born population - Norway (%)
Place of birth for the foreign-born population - Sweden (%)
Place of birth for the foreign-born population - United Kingdom (%)
Place of birth for the foreign-born population - England (%)
Place of birth for the foreign-born population - Scotland (%)
Place of birth for the foreign-born population - Other Northern Europe (%)
Place of birth for the foreign-born population - Austria (%)
Place of birth for the foreign-born population - Belgium (%)
Place of birth for the foreign-born population - France (%)
Place of birth for the foreign-born population - Germany (%)
Place of birth for the foreign-born population - Netherlands (%)
Place of birth for the foreign-born population - Switzerland (%)
Place of birth for the foreign-born population - Other Western Europe (%)
Place of birth for the foreign-born population - Greece (%)
Place of birth for the foreign-born population - Italy (%)
Place of birth for the foreign-born population - Portugal (%)
Place of birth for the foreign-born population - Spain (%)
Place of birth for the foreign-born population - Other Southern Europe (%)
Place of birth for the foreign-born population - Albania (%)
Place of birth for the foreign-born population - Belarus (%)
Place of birth for the foreign-born population - Bosnia and Herzegovina (%)
Place of birth for the foreign-born population - Bulgaria (%)
Place of birth for the foreign-born population - Croatia (%)
Place of birth for the foreign-born population - Czechoslovakia (%)
Place of birth for the foreign-born population - Hungary (%)
Place of birth for the foreign-born population - Latvia (%)
Place of birth for the foreign-born population - Lithuania (%)
Place of birth for the foreign-born population - North Macedonia (Macedonia) (%)
Place of birth for the foreign-born population - Moldova (%)
Place of birth for the foreign-born population - Poland (%)
Place of birth for the foreign-born population - Romania (%)
Place of birth for the foreign-born population - Russia (%)
Place of birth for the foreign-born population - Serbia (%)
Place of birth for the foreign-born population - Ukraine (%)
Place of birth for the foreign-born population - Other Eastern Europe (%)
Place of birth for the foreign-born population - China (%)
Place of birth for the foreign-born population - Hong Kong (%)
Place of birth for the foreign-born population - Taiwan (%)
Place of birth for the foreign-born population - Japan (%)
Place of birth for the foreign-born population - Korea (%)
Place of birth for the foreign-born population - Other Eastern Asia (%)
Place of birth for the foreign-born population - Afghanistan (%)
Place of birth for the foreign-born population - Bangladesh (%)
Place of birth for the foreign-born population - India (%)
Place of birth for the foreign-born population - Iran (%)
Place of birth for the foreign-born population - Kazakhstan (%)
Place of birth for the foreign-born population - Nepal (%)
Place of birth for the foreign-born population - Pakistan (%)
Place of birth for the foreign-born population - Sri Lanka (%)
Place of birth for the foreign-born population - Uzbekistan (%)
Place of birth for the foreign-born population - Other South Central Asia (%)
Place of birth for the foreign-born population - Burma (%)
Place of birth for the foreign-born population - Cambodia (%)
Place of birth for the foreign-born population - Indonesia (%)
Place of birth for the foreign-born population - Laos (%)
Place of birth for the foreign-born population - Malaysia (%)
Place of birth for the foreign-born population - Philippines (%)
Place of birth for the foreign-born population - Singapore (%)
Place of birth for the foreign-born population - Thailand (%)
Place of birth for the foreign-born population - Vietnam (%)
Place of birth for the foreign-born population - Other South Eastern Asia (%)
Place of birth for the foreign-born population - Armenia (%)
Place of birth for the foreign-born population - Iraq (%)
Place of birth for the foreign-born population - Israel (%)
Place of birth for the foreign-born population - Jordan (%)
Place of birth for the foreign-born population - Kuwait (%)
Place of birth for the foreign-born population - Lebanon (%)
Place of birth for the foreign-born population - Saudi Arabia (%)
Place of birth for the foreign-born population - Syria (%)
Place of birth for the foreign-born population - Turkey (%)
Place of birth for the foreign-born population - Yemen (%)
Place of birth for the foreign-born population - Other Western Asia (%)
Place of birth for the foreign-born population - Eritrea (%)
Place of birth for the foreign-born population - Ethiopia (%)
Place of birth for the foreign-born population - Kenya (%)
Place of birth for the foreign-born population - Somalia (%)
Place of birth for the foreign-born population - Uganda (%)
Place of birth for the foreign-born population - Zimbabwe (%)
Place of birth for the foreign-born population - Other Eastern Africa (%)
Place of birth for the foreign-born population - Cameroon (%)
Place of birth for the foreign-born population - Congo (%)
Place of birth for the foreign-born population - Democratic Republic of Congo (Zaire) (%)
Place of birth for the foreign-born population - Other Middle Africa (%)
Place of birth for the foreign-born population - Egypt (%)
Place of birth for the foreign-born population - Morocco (%)
Place of birth for the foreign-born population - Sudan (%)
Place of birth for the foreign-born population - Other Northern Africa (%)
Place of birth for the foreign-born population - South Africa (%)
Place of birth for the foreign-born population - Other Southern Africa (%)
Place of birth for the foreign-born population - Cabo Verde (%)
Place of birth for the foreign-born population - Ghana (%)
Place of birth for the foreign-born population - Liberia (%)
Place of birth for the foreign-born population - Nigeria (%)
Place of birth for the foreign-born population - Senegal (%)
Place of birth for the foreign-born population - Sierra Leone (%)
Place of birth for the foreign-born population - Other Western Africa (%)
Place of birth for the foreign-born population - Australia (%)
Place of birth for the foreign-born population - New Zealand (%)
Place of birth for the foreign-born population - Fiji (%)
Place of birth for the foreign-born population - Micronesia (%)
Place of birth for the foreign-born population - Bahamas (%)
Place of birth for the foreign-born population - Barbados (%)
Place of birth for the foreign-born population - Cuba (%)
Place of birth for the foreign-born population - Dominica (%)
Place of birth for the foreign-born population - Dominican Republic (%)
Place of birth for the foreign-born population - Grenada (%)
Place of birth for the foreign-born population - Haiti (%)
Place of birth for the foreign-born population - Jamaica (%)
Place of birth for the foreign-born population - St. Vincent and the Grenadines (%)
Place of birth for the foreign-born population - Trinidad and Tobago (%)
Place of birth for the foreign-born population - West Indies (%)
Place of birth for the foreign-born population - Other Caribbean (%)
Place of birth for the foreign-born population - Belize (%)
Place of birth for the foreign-born population - Costa Rica (%)
Place of birth for the foreign-born population - El Salvador (%)
Place of birth for the foreign-born population - Guatemala (%)
Place of birth for the foreign-born population - Honduras (%)
Place of birth for the foreign-born population - Mexico (%)
Place of birth for the foreign-born population - Nicaragua (%)
Place of birth for the foreign-born population - Panama (%)
Place of birth for the foreign-born population - Other Central America (%)
Place of birth for the foreign-born population - Argentina (%)
Place of birth for the foreign-born population - Bolivia (%)
Place of birth for the foreign-born population - Brazil (%)
Place of birth for the foreign-born population - Chile (%)
Place of birth for the foreign-born population - Colombia (%)
Place of birth for the foreign-born population - Ecuador (%)
Place of birth for the foreign-born population - Guyana (%)
Place of birth for the foreign-born population - Peru (%)
Place of birth for the foreign-born population - Uruguay (%)
Place of birth for the foreign-born population - Venezuela (%)
Place of birth for the foreign-born population - Other South America (%)
Place of birth for the foreign-born population - Canada (%)
Place of birth for the foreign-born population - Other Northern America (%)
Place of birth for the foreign-born population - Other (%)
Latest news about races in Carlisle, PA collected exclusively by city-data.com from local newspapers, TV, and radio stations
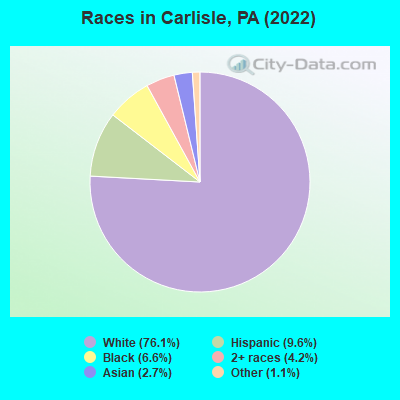
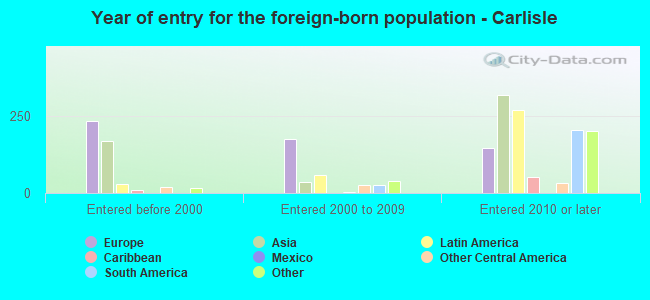
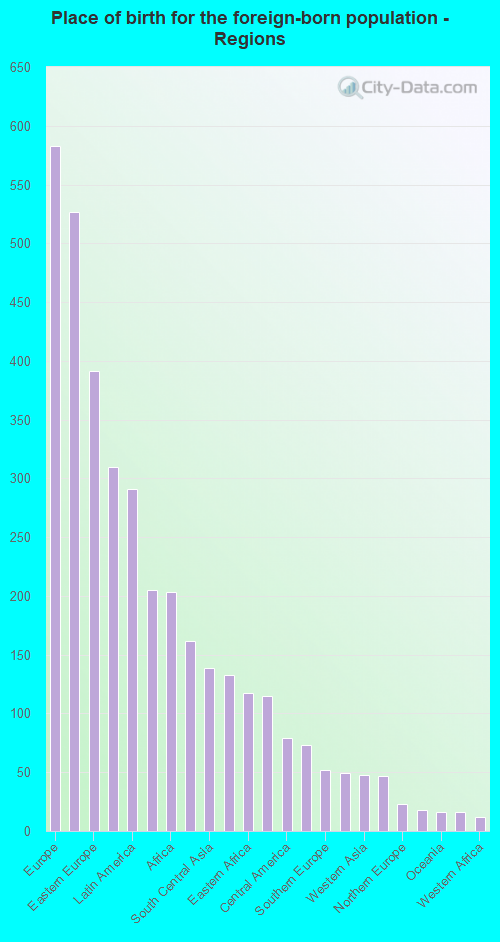
According to 2022 data, the most numerous races in Carlisle, PA are White alone (16,309 residents), Black alone (1,411 residents), and Hispanic (2,056 residents). 89.4% of Carlisle residents speak English at home. 7.7% of Carlisle, PA residents are foreign-born (2.7% born in Europe, 2.4% born in Asia, 1.3% born in Latin America, 0.9% born in Africa), which is 8.6% greater than the foreign-born rate of 7.0% across the entire state of Pennsylvania.
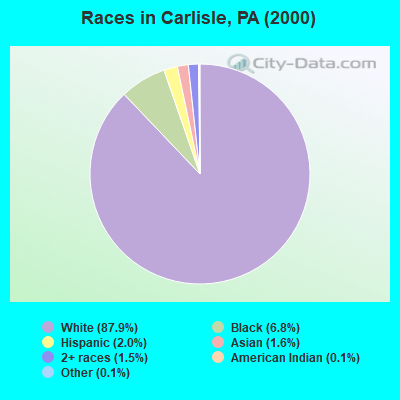
Race distribution in Carlisle
2000 2022
10,322,455 84.1% White alone 1,202,437 9.8% Black alone 394,088 3.2% Hispanic 218,296 1.8% Asian alone 113,097 0.9% Two or more races 13,086 0.1% Other race alone 14,904 0.1% American Indian alone 2,691 0.02% Native Hawaiian and Other
9,487,228 73.1% White alone 1,311,581 10.1% Black alone 1,115,997 8.6% Hispanic 493,942 3.8% Two or more races 487,124 3.8% Asian alone 63,582 0.5% Other race alone 10,130 0.08% American Indian alone 2,424 0.02% Native Hawaiian and Other
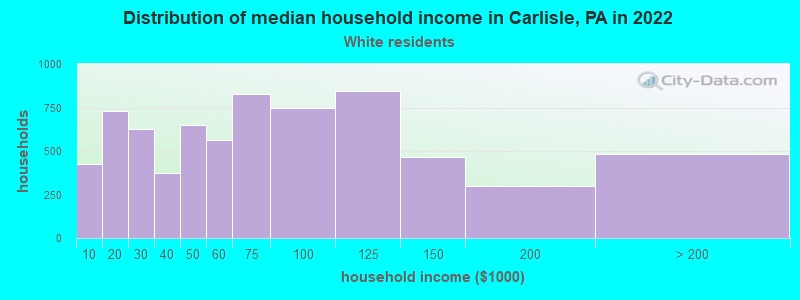
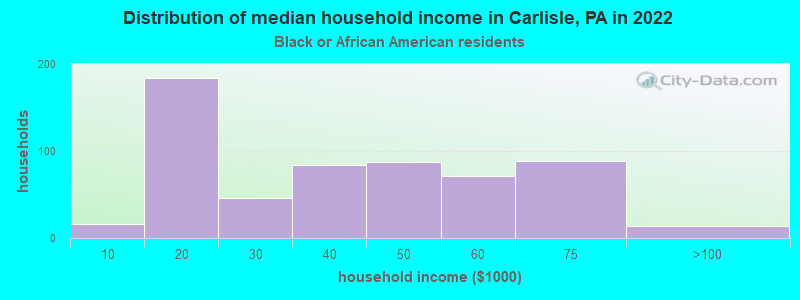
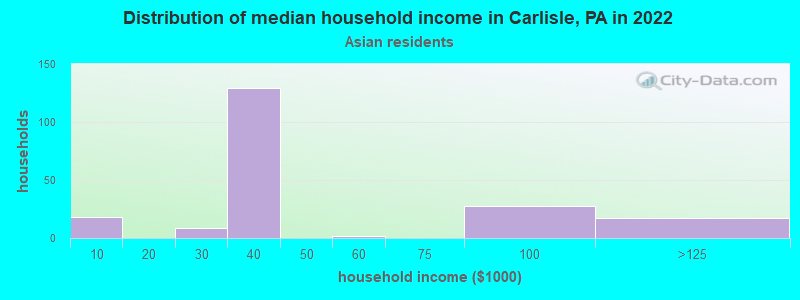
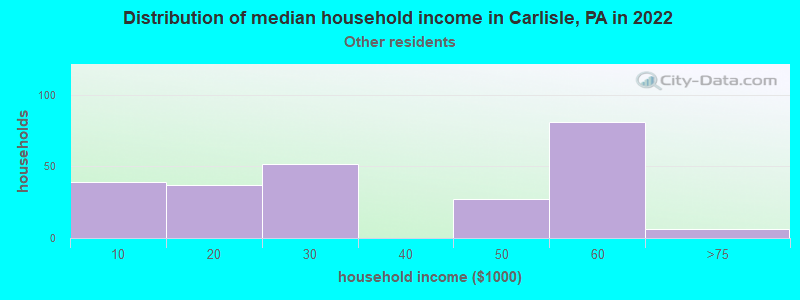
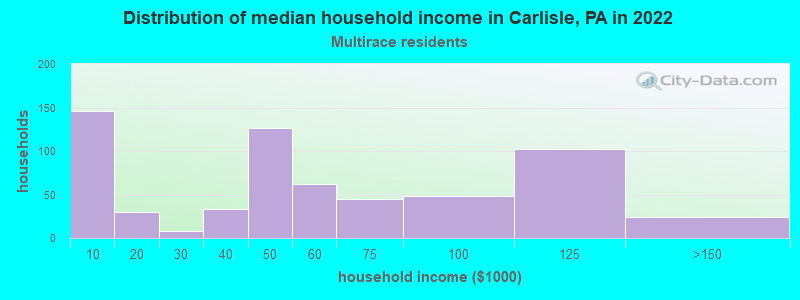
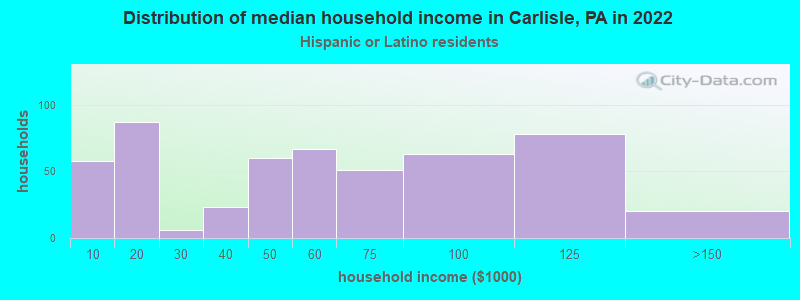
Income and house value in Carlisle Median household income in 2022 $57,584 White non-Hispanic householders$29,026 Black householders$49,105 Asian householders$40,549 Two or more races householders$57,606 Hispanic or Latino race householdersMedian 2022 house value $222,131 White Non-Hispanic householders$146,818 Black or African American householders$179,821 American Indian or Alaska Native householders $653,914 Asian householders$237,998 Two or more races householders$204,996 Hispanic or Latino householders
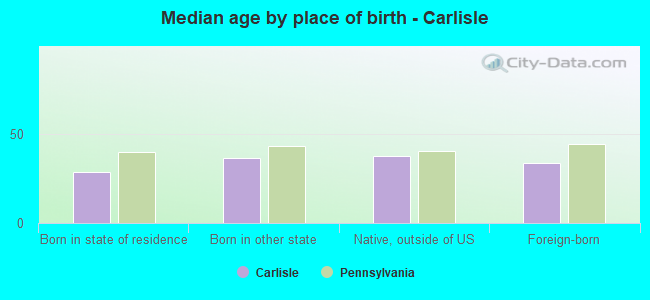
Median age by race in Carlisle
37.7 Median age for White residents36.9 37.9 20.3 Median age for Black or African American residents17.4 25.5 -857,881,136.1 Median age for American Indian / Alaska Native residents-714,583,332.6 -577,519,379.3 23.6 Median age for Asian residents41.5 23.6 -680,432,644.4 Median age for Native Hawaiian / Pacific Islander residents-666,666,666.0 -666,666,666.0 32.5 Median age for Other race residents33.1 31.7 17.8 Median age for Two or more races residents17.0 18.1 37.5 Median age for White alone residents36.6 38.0 19.6 Median age for Hispanic or Latino residents20.9 18.9
Owner/renter occupied households by race in Carlisle
House owners and renters - White residents 3,820 55.1% Owner occupied3,117 44.9% Renter occupiedHouse owners and renters - Black or African American residents 83 15.0% Owner occupied471 85.0% Renter occupiedHouse owners and renters - Asian residents 38 15.4% Owner occupied211 84.6% Renter occupiedHouse owners and renters - Other race residents 94 35.0% Owner occupied175 65.0% Renter occupiedHouse owners and renters - Two or more races residents 87 21.0% Owner occupied327 79.0% Renter occupiedHouse owners and renters - White alone residents 3,791 54.8% Owner occupied3,124 45.2% Renter occupiedHouse owners and renters - Hispanic or Latino residents 148 39.3% Owner occupied229 60.7% Renter occupied
Language usage in Carlisle
English speakers - Total 89.4% of residents of Carlisle speak English at home.
4.8% of residents speak Spanish at home 699 72.1% Speak English very well270 27.9% Speak English less than very well6.0% of residents speak other language at home 753 63.1% Speak English very well441 36.9% Speak English less than very well
English speakers - Born in the United States 92.0% of residents of Carlisle speak English at home.
5.3% of residents speak Spanish at home 286 88.8% Speak English very well36 11.2% Speak English less than very well3.7% of residents speak other language at home 224 100.0% Speak English very well
English speakers - Native, born elsewhere 58.7% of residents of Carlisle speak English at home.
42.7% of residents speak Spanish at home 179 97.8% Speak English very well4 2.2% Speak English less than very well2.1% of residents speak other language at home 9 100.0% Speak English very well
English speakers - Foreign-born 31.0% of residents of Carlisle speak English at home.
24.7% of residents speak Spanish at home 107 24.4% Speak English very well332 75.6% Speak English less than very well50.0% of residents speak other language at home 438 49.3% Speak English very well451 50.7% Speak English less than very well
White (Caucasian) - Speak only English Native:
97.4% (14,553)Foreign-born:
32.2% (318)
White (Caucasian) - Speak another language Native:
2.6% (394)Foreign-born:
67.1% (663)
Black or African American - Speak only English Native:
89.9% (1,269)Foreign-born:
39.6% (53)
Black or African American - Speak another language Native:
9.5% (134)Foreign-born:
62.4% (83)
Asian - Speak only English Native:
94.8% (203)Foreign-born:
27.4% (96)
Asian - Speak another language Native:
9.9% (21)Foreign-born:
74.4% (261)
Other race - Speak only English Native:
63.4% (369)Foreign-born:
10.7% (22)
Other race - Speak another language Native:
34.7% (202)Foreign-born:
88.3% (184)
Two or more races - Speak only English Native:
89.0% (1,202)Foreign-born:
19.2% (33)
Two or more races - Speak another language Native:
9.4% (127)Foreign-born:
69.4% (119)
White alone - Speak only English Native:
97.7% (14,350)Foreign-born:
33.8% (323)
White alone - Speak another language Native:
2.3% (339)Foreign-born:
64.7% (619)
Hispanic or Latino - Speak only English Native:
69.3% (894)Foreign-born:
9.5% (37)
Hispanic or Latino - Speak another language Native:
29.9% (386)Foreign-born:
88.3% (345)
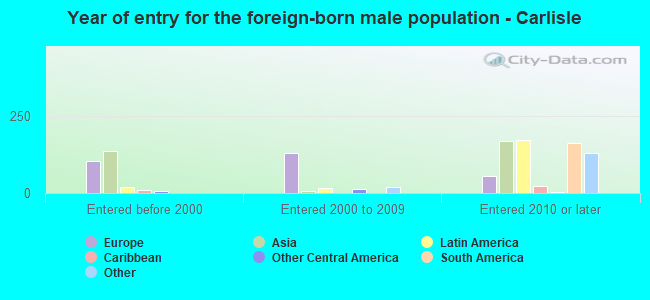
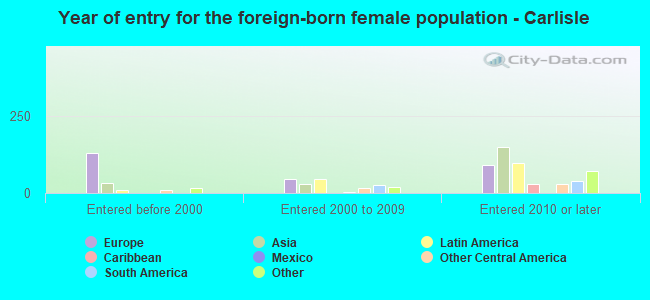
Foreign-born residents in Carlisle 1,642 residents are foreign born (2.7% Europe , 2.4% Asia , 1.3% Latin America , 0.9% Africa ).
This city:
7.7%Pennsylvania:
7.3%
Marital status for residents in Carlisle Marital status - White (Caucasian) population 15 years and over
Males 48.0% Never married38.4% Now married1.0% Separated2.6% Widowed10.0% DivorcedFemales 38.2% Never married38.3% Now married1.7% Separated8.5% Widowed13.3% DivorcedWomen who gave birth in the past 12 months Now married:
38.8% (77)Unmarried:
61.2% (122)
Women who did not give birth in the past 12 months Now married:
30.3% (1,157)Unmarried:
69.7% (2,662)
Marital status - Black or African American population 15 years and over
Males 74.3% Never married6.5% Now married11.4% Separated6.3% Widowed1.5% DivorcedFemales 76.1% Never married4.2% Now married0.0% Separated5.0% Widowed14.7% DivorcedWomen who did not give birth in the past 12 months Now married:
3.8% (15)Unmarried:
96.2% (391)
Marital status - Asian population 15 years and over
Males 46.3% Never married48.9% Now married0.0% Separated0.0% Widowed4.8% DivorcedFemales 79.9% Never married18.3% Now married0.0% Separated0.0% Widowed1.7% DivorcedWomen who did not give birth in the past 12 months Now married:
9.9% (28)Unmarried:
90.1% (254)
Marital status - Other race population 15 years and over
Males 64.3% Never married19.3% Now married0.6% Separated0.0% Widowed15.8% DivorcedFemales 40.9% Never married18.3% Now married5.2% Separated0.0% Widowed35.7% DivorcedWomen who gave birth in the past 12 months Now married:
100.0% (29)Unmarried:
0.0% (0)
Women who did not give birth in the past 12 months Now married:
20.2% (45)Unmarried:
79.8% (177)
Marital status - Two or more races population 15 years and over
Males 73.3% Never married13.6% Now married10.6% Separated0.0% Widowed2.5% DivorcedFemales 80.7% Never married4.4% Now married0.0% Separated7.1% Widowed7.8% DivorcedWomen who gave birth in the past 12 months Now married:
100.0% (27)Unmarried:
0.0% (0)
Women who did not give birth in the past 12 months Now married:
0.6% (3)Unmarried:
99.4% (518)
Marital status - White alone, not Hispanic / Latino population 15 years and over
Males 47.8% Never married38.2% Now married1.0% Separated2.7% Widowed10.2% DivorcedFemales 37.6% Never married38.6% Now married1.7% Separated8.7% Widowed13.4% DivorcedWomen who gave birth in the past 12 months Now married:
38.8% (77)Unmarried:
61.2% (122)
Women who did not give birth in the past 12 months Now married:
31.1% (1,158)Unmarried:
68.9% (2,561)
Marital status - Hispanic or Latino population 15 years and over
Males 66.0% Never married26.8% Now married7.2% Separated0.0% Widowed0.0% DivorcedFemales 64.9% Never married14.4% Now married2.4% Separated4.7% Widowed13.6% DivorcedWomen who gave birth in the past 12 months Now married:
100.0% (25)Unmarried:
0.0% (0)
Women who did not give birth in the past 12 months Now married:
9.9% (41)Unmarried:
90.1% (374)
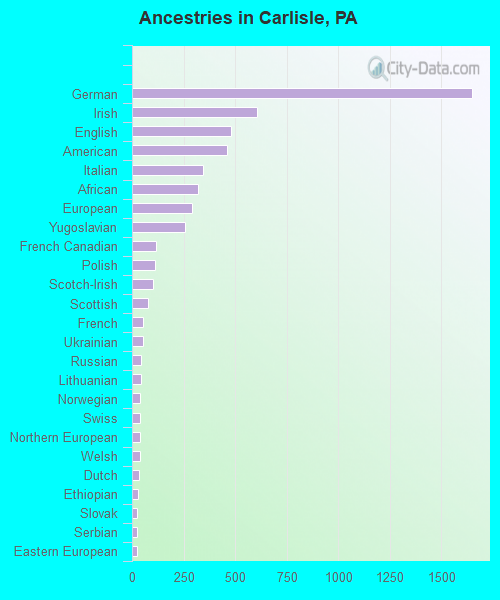
Ancestries in Carlisle
1,648 21.6% German606 7.9% Irish482 6.3% English461 6.0% American342 4.5% Italian322 4.2% African293 3.8% European258 3.4% Yugoslavian114 1.5% French Canadian112 1.5% Polish103 1.3% Scotch-Irish77 1.0% Scottish53 0.7% French52 0.7% Ukrainian46 0.6% Russian43 0.6% Lithuanian41 0.5% Norwegian40 0.5% Swiss40 0.5% Northern European38 0.5% Welsh33 0.4% Dutch28 0.4% Ethiopian26 0.3% Slovak25 0.3% Serbian24 0.3% Eastern European23 0.3% Croatian22 0.3% Lebanese21 0.3% Moroccan21 0.3% Iranian21 0.3% Hungarian15 0.2% Danish14 0.2% Pennsylvania German14 0.2% Liberian12 0.2% British10 0.1% Swedish8 0.1% Scandinavian7 0.09% Nigerian6 0.08% Afghan5 0.07% Haitian4 0.05% Romanian3 0.04% Greek3 0.04% Jamaican2 0.03% Czech
Geographical mobility in Carlisle Same house 1 year ago 12,491 76.2% White (Caucasian)1,531 90.7% Black or African American50 99.6% American Indian / Alaska Native232 40.8% Asian325 55.5% Other race1,411 77.5% Two or more races12,304 76.3% White alone, not Hispanic / Latino1,570 79.6% Hispanic or LatinoMoved within same county 1,900 11.6% White / Caucasian71 4.2% Black or African American21 3.6% Asian152 26.0% Other race121 6.6% Two or more races1,844 11.4% White alone, not Hispanic / Latino193 9.8% Hispanic or LatinoMoved within same state 980 6.0% White / Caucasian117 6.9% Black or African American120 21.1% Asian1 0.2% Other race148 8.1% Two or more races955 5.9% White alone, not Hispanic / Latino74 3.7% Hispanic or LatinoMoved from different state 895 5.5% White / Caucasian103 6.1% Black or African American45 7.9% Asian1 99.3% Native Hawaiian / Pacific Islander75 12.8% Other race148 8.1% Two or more races911 5.6% White alone, not Hispanic / Latino84 4.2% Hispanic or LatinoMoved from abroad 250 1.5% White16 1.0% Black or African American118 20.7% Asian5 0.3% Two or more races291 1.8% White alone, not Hispanic / Latino
Children Nativity (place of birth) in Carlisle
Children under 6 years - Living with two parents Both parents native 437 100.0% NativeBoth parents foreign-born 50 73.9% Native18 26.1% Foreign-bornOne native, one foreign-born parent 130 100.0% NativeChildren under 6 years - Living with one parent Native parent 587 100.0% NativeForeign-born parent 15 100.0% NativeChildren 6 to 17 years - Living with two parents Both parents native 1,112 100.0% NativeBoth parents foreign-born 38 17.8% Native178 82.2% Foreign-bornOne native, one foreign-born parent 127 63.2% Native74 36.8% Foreign-bornChildren 6 to 17 years - Living with one parent Native parent 1,359 100.0% NativeForeign-born parent 86 46.8% Native98 53.2% Foreign-born
Grandparents responsible for own grandchildren in Carlisle
Grandparents (30 to 59 years) Two or more races 9 100.0% Not responsible for grandchildrenHispanic or Latino 11 100.0% Not responsible for grandchildren
Grandparents (60 years and over)