Races in Carrollton, Michigan (MI) Detailed Stats
Ancestries, Foreign-born residents, place of birth

Recent posts about races in Carrollton, Michigan on our local forum with over 2,400,000 registered users:
 | Good/Safe neighborhoods in Tri-Cities area? Saginaw, Bay City, Midland. (13 replies) |
| Saginaw anyone? (55 replies) |
| Anyone familiar with Caro and nearbye areas? (12 replies) |
1.2% of Carrollton, MI residents are foreign-born , which is 421.2% less than the foreign-born rate of 6.0% across the entire state of Michigan.
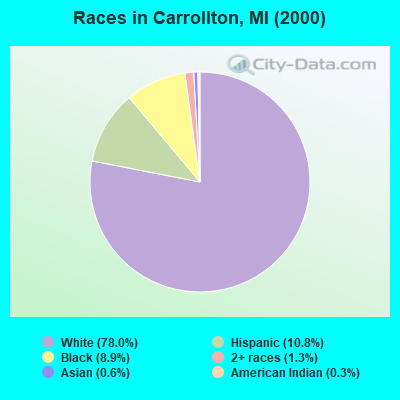
Race distribution in Carrollton

- 5,14978.0%White alone
- 71110.8%Hispanic
- 5908.9%Black alone
- 871.3%Two or more races
- 400.6%Asian alone
- 190.3%American Indian alone
- 50.08%Other race alone
- 10.02%Native Hawaiian and Other
Pacific Islander alone
2000
2022
-
- 7,806,69178.6%White alone
- 1,402,04714.1%Black alone
- 323,8773.3%Hispanic
- 175,3111.8%Asian alone
- 163,4871.6%Two or more races
- 53,4210.5%American Indian alone
- 11,4650.1%Other race alone
- 2,1450.02%Native Hawaiian and Other
Pacific Islander alone

-
- 7,289,05172.6%White alone
- 1,310,46413.1%Black alone
- 572,4055.7%Hispanic
- 450,0314.5%Two or more races
- 335,7323.3%Asian alone
- 45,2170.5%Other race alone
- 29,0110.3%American Indian alone
- 2,2070.02%Native Hawaiian and Other
Pacific Islander alone

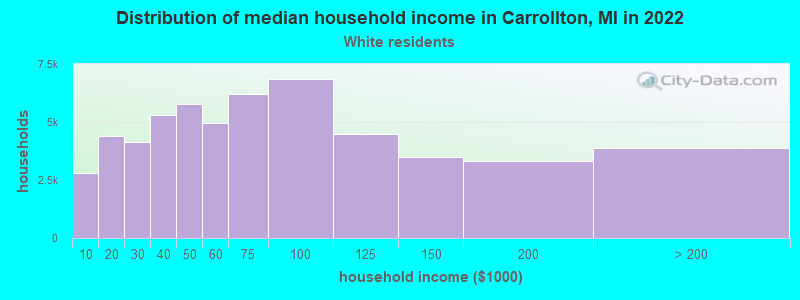
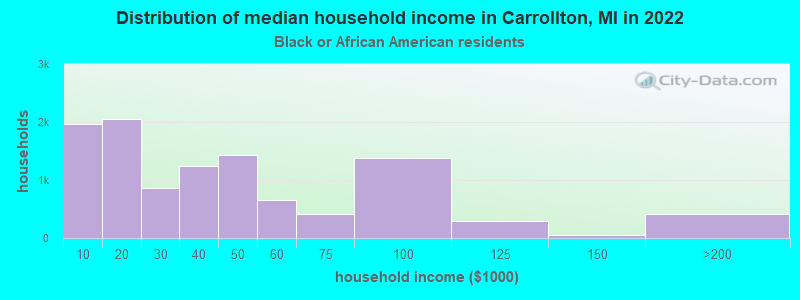
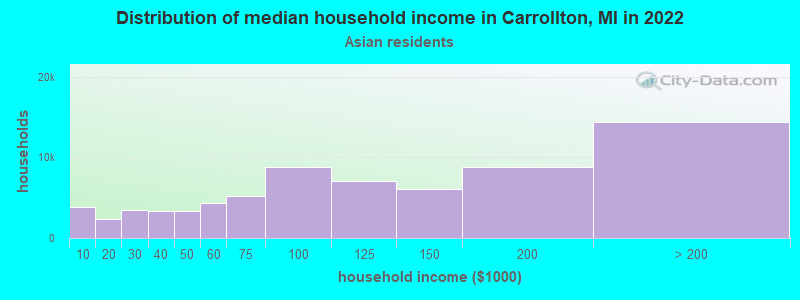
Income and house value in Carrollton
- Median household income in 2022
- $56,743White non-Hispanic householders
- $24,790Black householders
- $133,974Asian householders
- $72,845Some other race householders
- $36,347Two or more races householders
- $79,494Hispanic or Latino race householders
- Median 2022 house value
- $117,072White Non-Hispanic householders
- $77,185Black or African American householders
- $164,040Asian householders
- $127,087Some other race householders
- $75,285Two or more races householders
- $131,059Hispanic or Latino householders
Household income for White non-Hispanic householders
Household income for Black householders
Household income for Asian householders
Household income for Two or more races householders
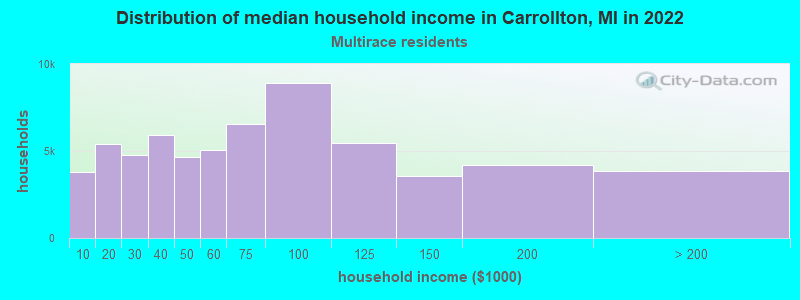
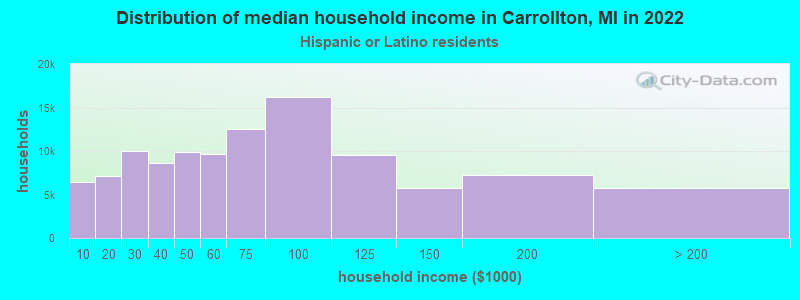
Household income for Hispanic or Latino race householders
Foreign-born residents in Carrollton
76 residents are foreign born
| This city: | 1.2% |
| Michigan: | 5.3% |
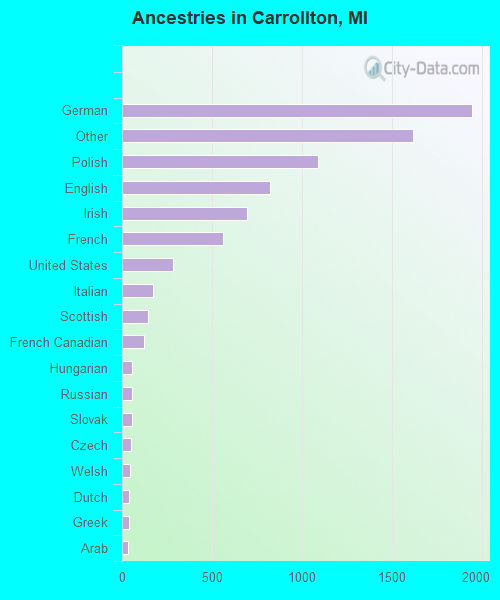
Ancestries in Carrollton

- 1,94324.5%German
- 1,62020.4%Other
- 1,09013.7%Polish
- 82010.3%English
- 6978.8%Irish
- 5607.1%French
- 2843.6%United States
- 1702.1%Italian
- 1471.9%Scottish
- 1231.6%French Canadian
- 570.7%Hungarian
- 550.7%Russian
- 540.7%Slovak
- 500.6%Czech
- 470.6%Welsh
- 410.5%Dutch
- 370.5%Greek
- 330.4%Arab
- 170.2%Danish
- 170.2%Swedish
- 160.2%Ukrainian
- 140.2%Norwegian
- 80.1%Swiss
- 70.09%Lithuanian
- 70.09%Scotch-Irish
- 70.09%Subsaharan African
- 70.09%West Indian
Zip codes: 48604.