Races in Cascade-Fairwood, Washington (WA) Detailed Stats
Ancestries, Foreign-born residents, place of birth

Recent posts about races in Cascade-Fairwood, Washington on our local forum with over 2,400,000 registered users:
 | Renton- what's up with all the septic systems? (9 replies) |
13.5% of Cascade-Fairwood, WA residents are foreign-born (8.3% born in Asia, 2.5% born in Europe), which is 11.5% less than the foreign-born rate of 15.0% across the entire state of Washington.
Race distribution in Cascade-Fairwood

- 24,62471.2%White alone
- 4,63413.4%Asian alone
- 2,0886.0%Black alone
- 1,4204.1%Hispanic
- 1,3563.9%Two or more races
- 1860.5%American Indian alone
- 1530.4%Native Hawaiian and Other
Pacific Islander alone - 1190.3%Other race alone
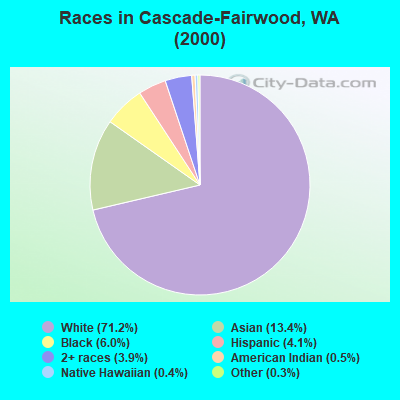
2000
2022
-
- 4,652,49078.9%White alone
- 441,5097.5%Hispanic
- 319,4015.4%Asian alone
- 184,6313.1%Black alone
- 175,9263.0%Two or more races
- 85,3961.4%American Indian alone
- 22,7790.4%Native Hawaiian and Other
Pacific Islander alone - 11,9890.2%Other race alone

-
- 4,941,45663.5%White alone
- 1,093,31314.0%Hispanic
- 755,8329.7%Asian alone
- 523,4486.7%Two or more races
- 299,5373.8%Black alone
- 69,0240.9%American Indian alone
- 52,2310.7%Native Hawaiian and Other
Pacific Islander alone - 50,9450.7%Other race alone

Income and house value in Cascade-Fairwood
- Median household income in 2022
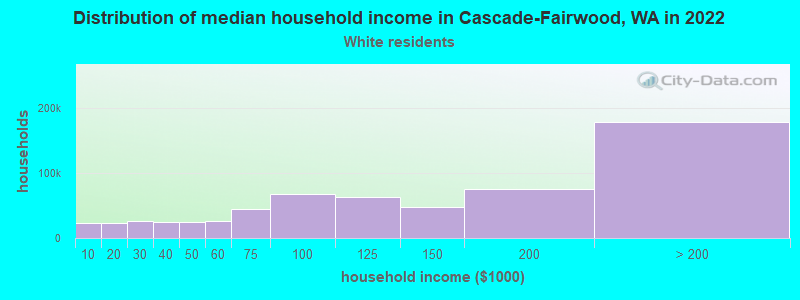
- $131,096White non-Hispanic householders
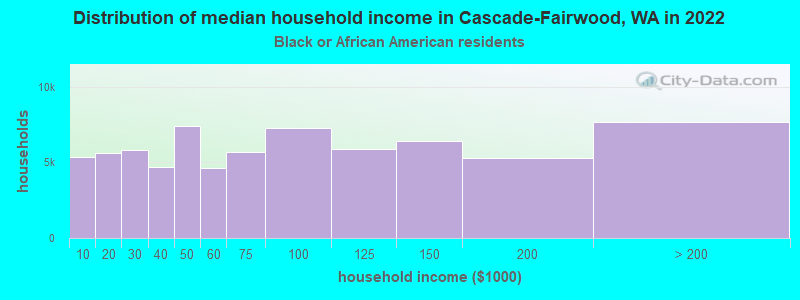
- $84,892Black householders
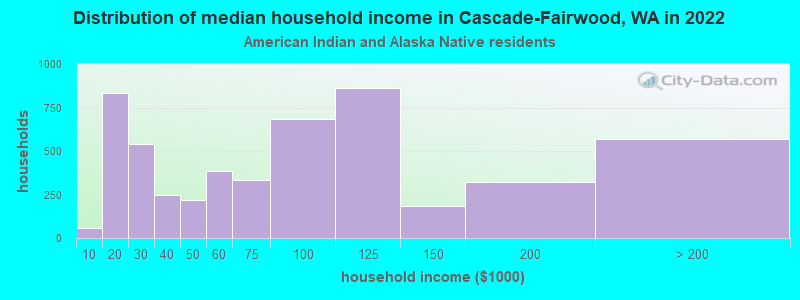
- $81,249American Indian and Alaska Native householders
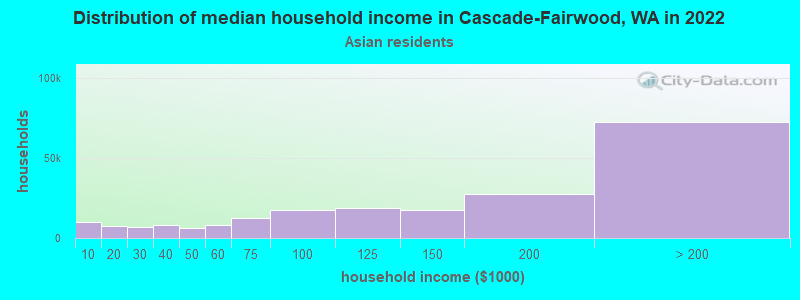
- $160,755Asian householders
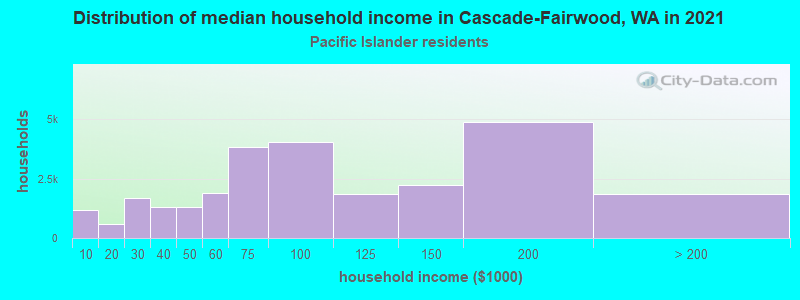
- $142,570Native Hawaiian and other Pacific Islander householders
- $85,906Some other race householders
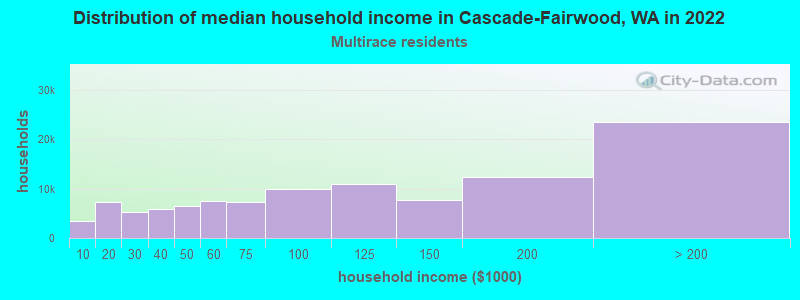
- $139,198Two or more races householders
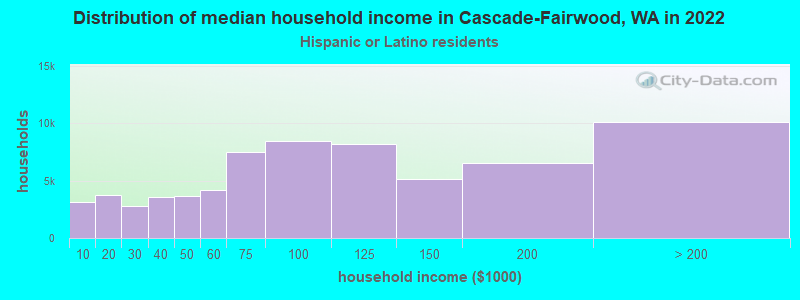
- $80,932Hispanic or Latino race householders
- Median 2022 house value
- $728,528White Non-Hispanic householders
- $763,945Black or African American householders
- $558,297American Indian or Alaska Native householders
- $789,461Asian householders
- $714,056Native Hawaiian and other Pacific Islander householders
- $714,056Some other race householders
- $733,098Two or more races householders
- $700,347Hispanic or Latino householders
Household income for White non-Hispanic householders
Household income for Black householders
Household income for American Indian and Alaska Native householders
Household income for Asian householders
Household income for Native Hawaiian and other Pacific Islander householders
Household income for Two or more races householders
Household income for Hispanic or Latino race householders
Foreign-born residents in Cascade-Fairwood
4,652 residents are foreign born (8.3% Asia, 2.5% Europe).
| This city: | 13.5% |
| Washington: | 10.4% |
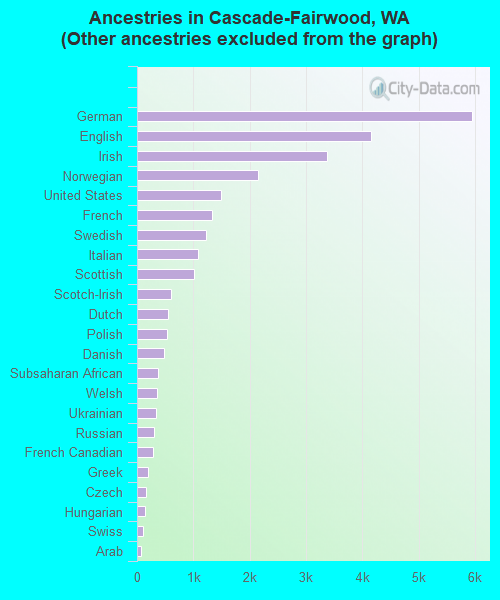
Ancestries in Cascade-Fairwood

- 11,78230.9%Other
- 5,95415.6%German
- 4,15810.9%English
- 3,3688.8%Irish
- 2,1555.6%Norwegian
- 1,4983.9%United States
- 1,3353.5%French
- 1,2263.2%Swedish
- 1,0792.8%Italian
- 1,0132.7%Scottish
- 6001.6%Scotch-Irish
- 5441.4%Dutch
- 5381.4%Polish
- 4771.2%Danish
- 3791.0%Subsaharan African
- 3540.9%Welsh
- 3390.9%Ukrainian
- 2970.8%Russian
- 2820.7%French Canadian
- 1990.5%Greek
- 1680.4%Czech
- 1460.4%Hungarian
- 1150.3%Swiss
- 720.2%Arab
- 430.1%West Indian
- 250.07%Lithuanian
- 210.06%Slovak
- 140.04%Portuguese
Zip codes: 98058.