Races in Cashtown-McKnightstown, Pennsylvania (PA) Detailed Stats
Ancestries, Foreign-born residents, place of birth

Discuss Cashtown-McKnightstown, Pennsylvania races on our local forum with over 2,400,000 registered users
1.5% of Cashtown-McKnightstown, PA residents are foreign-born , which is 379.2% less than the foreign-born rate of 7.0% across the entire state of Pennsylvania.
Race distribution in Cashtown-McKnightstown

- 72195.8%White alone
- 121.6%Black alone
- 111.5%Two or more races
- 70.9%Hispanic
- 20.3%Other race alone
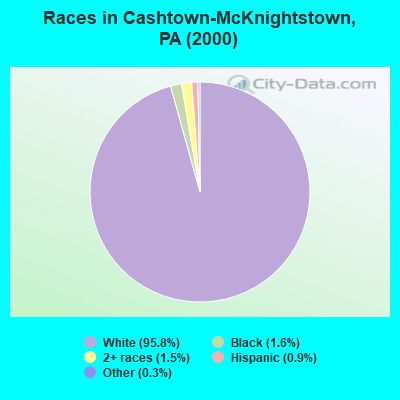
2000
2022
-
- 10,322,45584.1%White alone
- 1,202,4379.8%Black alone
- 394,0883.2%Hispanic
- 218,2961.8%Asian alone
- 113,0970.9%Two or more races
- 13,0860.1%Other race alone
- 14,9040.1%American Indian alone
- 2,6910.02%Native Hawaiian and Other
Pacific Islander alone

-
- 9,487,22873.1%White alone
- 1,311,58110.1%Black alone
- 1,115,9978.6%Hispanic
- 493,9423.8%Two or more races
- 487,1243.8%Asian alone
- 63,5820.5%Other race alone
- 10,1300.08%American Indian alone
- 2,4240.02%Native Hawaiian and Other
Pacific Islander alone

Income and house value in Cashtown-McKnightstown
- Median household income in 2022
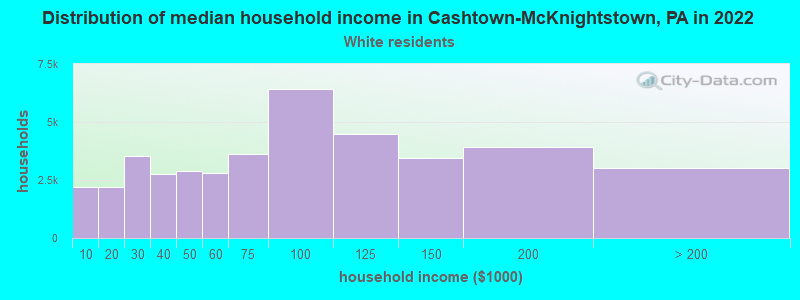
- $84,132White non-Hispanic householders
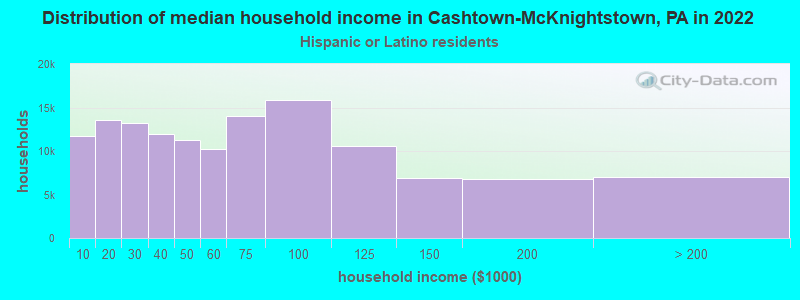
- $48,182Hispanic or Latino race householders
- Median 2022 house value
- $270,623White Non-Hispanic householders
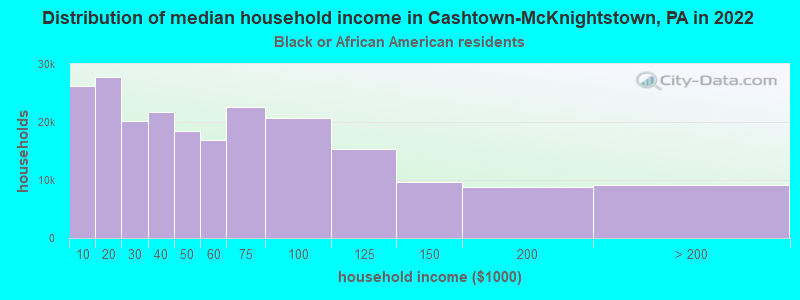
- $198,643Black or African American householders
Household income for White non-Hispanic householders
Household income for Black householders
Household income for Hispanic or Latino race householders
Foreign-born residents in Cashtown-McKnightstown
11 residents are foreign born
| This city: | 1.5% |
| Pennsylvania: | 4.1% |
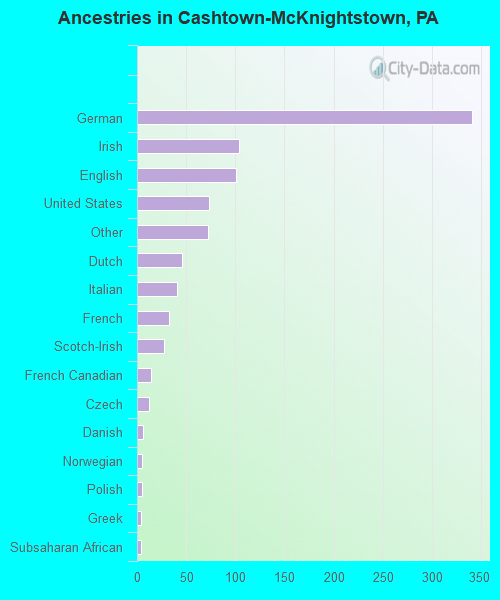
Ancestries in Cashtown-McKnightstown

- 34138.4%German
- 10411.7%Irish
- 10111.4%English
- 738.2%United States
- 728.1%Other
- 465.2%Dutch
- 414.6%Italian
- 333.7%French
- 273.0%Scotch-Irish
- 141.6%French Canadian
- 121.4%Czech
- 60.7%Danish
- 50.6%Norwegian
- 50.6%Polish
- 40.5%Greek
- 40.5%Subsaharan African
Zip codes: 17307.