Races in Cedar Mill, Oregon (OR) Detailed Stats
Data:
Races - White alone (%)
Races - White alone (% change since 2000)
Races - Black alone (%)
Races - Black alone (% change since 2000)
Races - American Indian alone (%)
Races - American Indian alone (% change since 2000)
Races - Asian alone (%)
Races - Asian alone (% change since 2000)
Races - Hispanic (%)
Races - Hispanic (% change since 2000)
Races - Native Hawaiian and Other Pacific Islander alone (%)
Races - Native Hawaiian and Other Pacific Islander alone (% change since 2000)
Races - Two or more races(%)
Races - Two or more races(% change since 2000)
Races - Other race alone (%)
Races - Other race alone (% change since 2000)
Racial diversity
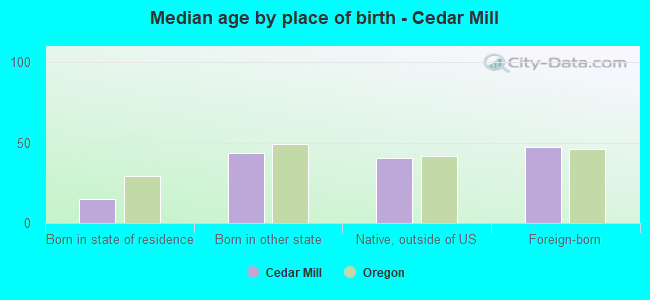
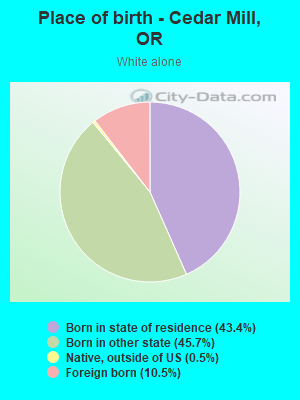
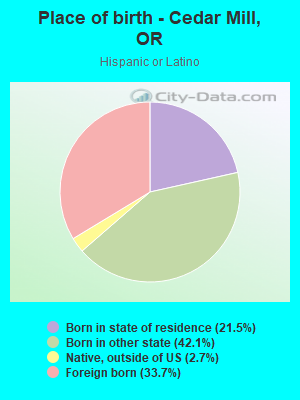
Place of birth - Born in state of residence (%)
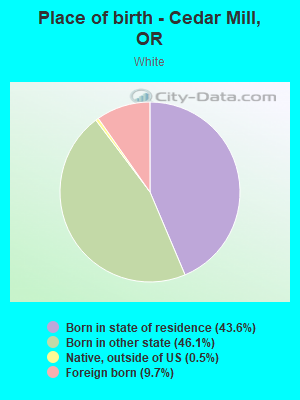
Place of birth - Born in state of residence (%) - White
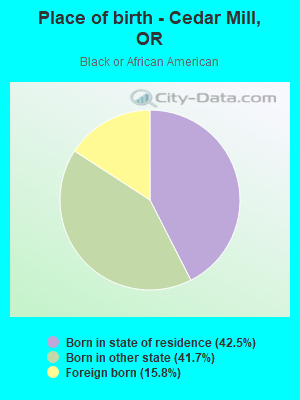
Place of birth - Born in state of residence (%) - Black or African American
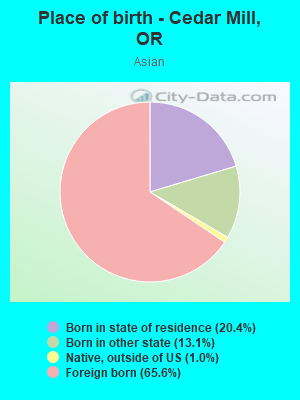
Place of birth - Born in state of residence (%) - Asian
Place of birth - Born in state of residence (%) - Hispanic or Latino
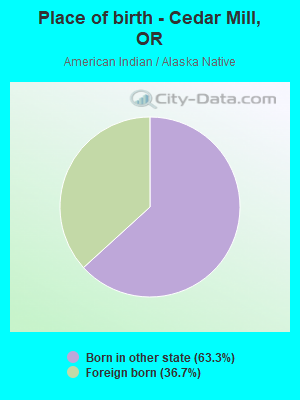
Place of birth - Born in state of residence (%) - American Indian and Alaska Native
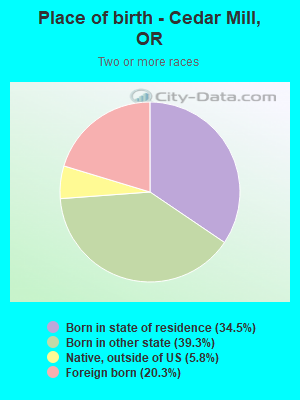
Place of birth - Born in state of residence (%) - Multirace
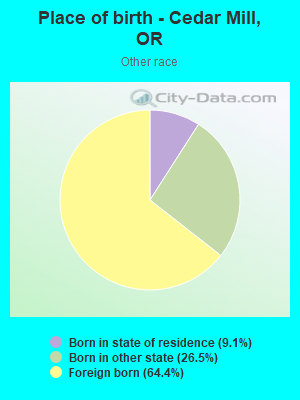
Place of birth - Born in state of residence (%) - Other Race
Place of birth - Born in other state (%)
Place of birth - Born in other state (%) - White
Place of birth - Born in other state (%) - Black or African American
Place of birth - Born in other state (%) - Asian
Place of birth - Born in other state (%) - Hispanic or Latino
Place of birth - Born in other state (%) - American Indian and Alaska Native
Place of birth - Born in other state (%) - Multirace
Place of birth - Born in other state (%) - Other Race
Place of birth - Native, outside of US (%)
Place of birth - Native, outside of US (%) - White
Place of birth - Native, outside of US (%) - Black or African American
Place of birth - Native, outside of US (%) - Asian
Place of birth - Native, outside of US (%) - Hispanic or Latino
Place of birth - Native, outside of US (%) - American Indian and Alaska Native
Place of birth - Native, outside of US (%) - Multirace
Place of birth - Native, outside of US (%) - Other Race
Place of birth - Foreign born (%)
Place of birth - Foreign born (%) - White
Place of birth - Foreign born (%) - Black or African American
Place of birth - Foreign born (%) - Asian
Place of birth - Foreign born (%) - Hispanic or Latino
Place of birth - Foreign born (%) - American Indian and Alaska Native
Place of birth - Foreign born (%) - Multirace
Place of birth - Foreign born (%) - Other Race
Residents speaking English at home (%)
Residents speaking English at home - Born in the United States (%)
Residents speaking English at home - Native, born elsewhere (%)
Residents speaking English at home - Foreign born (%)
Residents speaking Spanish at home (%)
Residents speaking Spanish at home - Born in the United States (%)
Residents speaking Spanish at home - Native, born elsewhere (%)
Residents speaking Spanish at home - Foreign born (%)
Residents speaking other language at home (%)
Residents speaking other language at home - Born in the United States (%)
Residents speaking other language at home - Native, born elsewhere (%)
Residents speaking other language at home - Foreign born (%)
Marital status - Never married (%)
Marital status - Now married (%)
Marital status - Separated (%)
Marital status - Widowed (%)
Marital status - Divorced (%)
Ancestries Reported - Arab (%)
Ancestries Reported - Czech (%)
Ancestries Reported - Danish (%)
Ancestries Reported - Dutch (%)
Ancestries Reported - English (%)
Ancestries Reported - French (%)
Ancestries Reported - French Canadian (%)
Ancestries Reported - German (%)
Ancestries Reported - Greek (%)
Ancestries Reported - Hungarian (%)
Ancestries Reported - Irish (%)
Ancestries Reported - Italian (%)
Ancestries Reported - Lithuanian (%)
Ancestries Reported - Norwegian (%)
Ancestries Reported - Polish (%)
Ancestries Reported - Portuguese (%)
Ancestries Reported - Russian (%)
Ancestries Reported - Scotch-Irish (%)
Ancestries Reported - Scottish (%)
Ancestries Reported - Slovak (%)
Ancestries Reported - Subsaharan African (%)
Ancestries Reported - Swedish (%)
Ancestries Reported - Swiss (%)
Ancestries Reported - Ukrainian (%)
Ancestries Reported - United States (%)
Ancestries Reported - Welsh (%)
Ancestries Reported - West Indian (%)
Ancestries Reported - Other (%)
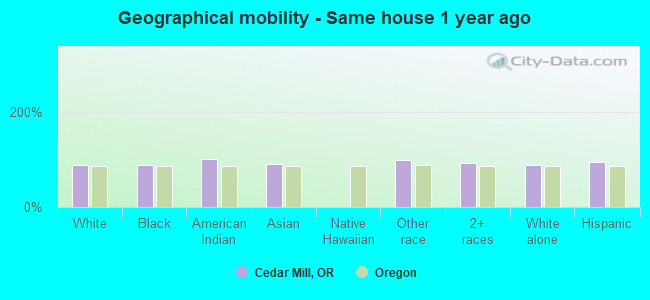
Geographical mobility - Same house 1 year ago (%)
Geographical mobility - Same house 1 year ago (%) - White
Geographical mobility - Same house 1 year ago (%) - Black or African American
Geographical mobility - Same house 1 year ago (%) - Asian
Geographical mobility - Same house 1 year ago (%) - Hispanic or Latino
Geographical mobility - Same house 1 year ago (%) - American Indian and Alaska Native
Geographical mobility - Same house 1 year ago (%) - Multirace
Geographical mobility - Same house 1 year ago (%) - Other Race
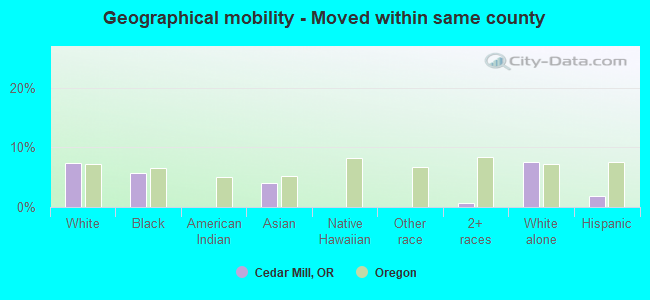
Geographical mobility - Moved within same county (%)
Geographical mobility - Moved within same county (%) - White
Geographical mobility - Moved within same county (%) - Black or African American
Geographical mobility - Moved within same county (%) - Asian
Geographical mobility - Moved within same county (%) - Hispanic or Latino
Geographical mobility - Moved within same county (%) - American Indian and Alaska Native
Geographical mobility - Moved within same county (%) - Multirace
Geographical mobility - Moved within same county (%) - Other Race
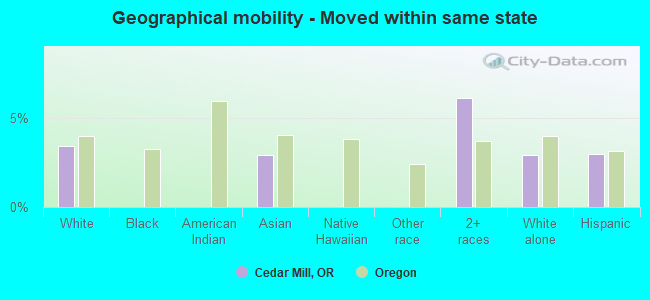
Geographical mobility - Moved from different county within same state (%)
Geographical mobility - Moved from different county within same state (%) - White
Geographical mobility - Moved from different county within same state (%) - Black or African American
Geographical mobility - Moved from different county within same state (%) - Asian
Geographical mobility - Moved from different county within same state (%) - Hispanic or Latino
Geographical mobility - Moved from different county within same state (%) - American Indian and Alaska Native
Geographical mobility - Moved from different county within same state (%) - Multirace
Geographical mobility - Moved from different county within same state (%) - Other Race
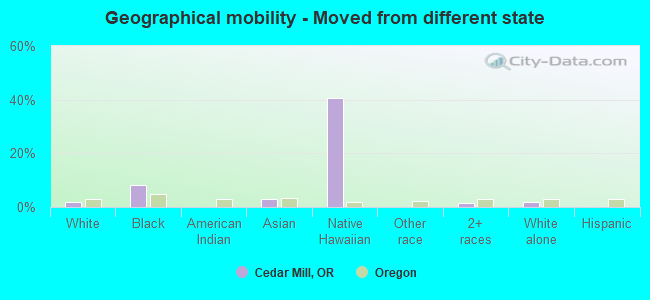
Geographical mobility - Moved from different state (%)
Geographical mobility - Moved from different state (%) - White
Geographical mobility - Moved from different state (%) - Black or African American
Geographical mobility - Moved from different state (%) - Asian
Geographical mobility - Moved from different state (%) - Hispanic or Latino
Geographical mobility - Moved from different state (%) - American Indian and Alaska Native
Geographical mobility - Moved from different state (%) - Multirace
Geographical mobility - Moved from different state (%) - Other Race
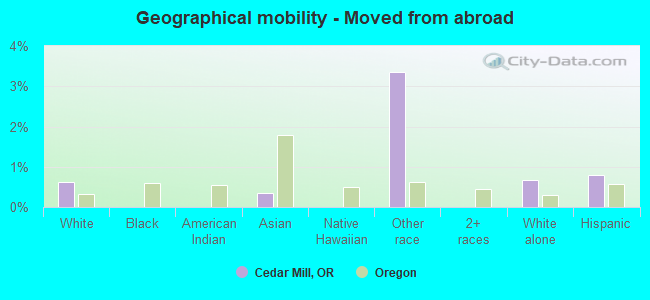
Geographical mobility - Moved from abroad (%)
Geographical mobility - Moved from abroad (%) - White
Geographical mobility - Moved from abroad (%) - Black or African American
Geographical mobility - Moved from abroad (%) - Asian
Geographical mobility - Moved from abroad (%) - Hispanic or Latino
Geographical mobility - Moved from abroad (%) - American Indian and Alaska Native
Geographical mobility - Moved from abroad (%) - Multirace
Geographical mobility - Moved from abroad (%) - Other Race
Place of birth for the foreign-born population - Ireland (%)
Place of birth for the foreign-born population - Denmark (%)
Place of birth for the foreign-born population - Norway (%)
Place of birth for the foreign-born population - Sweden (%)
Place of birth for the foreign-born population - United Kingdom (%)
Place of birth for the foreign-born population - England (%)
Place of birth for the foreign-born population - Scotland (%)
Place of birth for the foreign-born population - Other Northern Europe (%)
Place of birth for the foreign-born population - Austria (%)
Place of birth for the foreign-born population - Belgium (%)
Place of birth for the foreign-born population - France (%)
Place of birth for the foreign-born population - Germany (%)
Place of birth for the foreign-born population - Netherlands (%)
Place of birth for the foreign-born population - Switzerland (%)
Place of birth for the foreign-born population - Other Western Europe (%)
Place of birth for the foreign-born population - Greece (%)
Place of birth for the foreign-born population - Italy (%)
Place of birth for the foreign-born population - Portugal (%)
Place of birth for the foreign-born population - Spain (%)
Place of birth for the foreign-born population - Other Southern Europe (%)
Place of birth for the foreign-born population - Albania (%)
Place of birth for the foreign-born population - Belarus (%)
Place of birth for the foreign-born population - Bosnia and Herzegovina (%)
Place of birth for the foreign-born population - Bulgaria (%)
Place of birth for the foreign-born population - Croatia (%)
Place of birth for the foreign-born population - Czechoslovakia (%)
Place of birth for the foreign-born population - Hungary (%)
Place of birth for the foreign-born population - Latvia (%)
Place of birth for the foreign-born population - Lithuania (%)
Place of birth for the foreign-born population - North Macedonia (Macedonia) (%)
Place of birth for the foreign-born population - Moldova (%)
Place of birth for the foreign-born population - Poland (%)
Place of birth for the foreign-born population - Romania (%)
Place of birth for the foreign-born population - Russia (%)
Place of birth for the foreign-born population - Serbia (%)
Place of birth for the foreign-born population - Ukraine (%)
Place of birth for the foreign-born population - Other Eastern Europe (%)
Place of birth for the foreign-born population - China (%)
Place of birth for the foreign-born population - Hong Kong (%)
Place of birth for the foreign-born population - Taiwan (%)
Place of birth for the foreign-born population - Japan (%)
Place of birth for the foreign-born population - Korea (%)
Place of birth for the foreign-born population - Other Eastern Asia (%)
Place of birth for the foreign-born population - Afghanistan (%)
Place of birth for the foreign-born population - Bangladesh (%)
Place of birth for the foreign-born population - India (%)
Place of birth for the foreign-born population - Iran (%)
Place of birth for the foreign-born population - Kazakhstan (%)
Place of birth for the foreign-born population - Nepal (%)
Place of birth for the foreign-born population - Pakistan (%)
Place of birth for the foreign-born population - Sri Lanka (%)
Place of birth for the foreign-born population - Uzbekistan (%)
Place of birth for the foreign-born population - Other South Central Asia (%)
Place of birth for the foreign-born population - Burma (%)
Place of birth for the foreign-born population - Cambodia (%)
Place of birth for the foreign-born population - Indonesia (%)
Place of birth for the foreign-born population - Laos (%)
Place of birth for the foreign-born population - Malaysia (%)
Place of birth for the foreign-born population - Philippines (%)
Place of birth for the foreign-born population - Singapore (%)
Place of birth for the foreign-born population - Thailand (%)
Place of birth for the foreign-born population - Vietnam (%)
Place of birth for the foreign-born population - Other South Eastern Asia (%)
Place of birth for the foreign-born population - Armenia (%)
Place of birth for the foreign-born population - Iraq (%)
Place of birth for the foreign-born population - Israel (%)
Place of birth for the foreign-born population - Jordan (%)
Place of birth for the foreign-born population - Kuwait (%)
Place of birth for the foreign-born population - Lebanon (%)
Place of birth for the foreign-born population - Saudi Arabia (%)
Place of birth for the foreign-born population - Syria (%)
Place of birth for the foreign-born population - Turkey (%)
Place of birth for the foreign-born population - Yemen (%)
Place of birth for the foreign-born population - Other Western Asia (%)
Place of birth for the foreign-born population - Eritrea (%)
Place of birth for the foreign-born population - Ethiopia (%)
Place of birth for the foreign-born population - Kenya (%)
Place of birth for the foreign-born population - Somalia (%)
Place of birth for the foreign-born population - Uganda (%)
Place of birth for the foreign-born population - Zimbabwe (%)
Place of birth for the foreign-born population - Other Eastern Africa (%)
Place of birth for the foreign-born population - Cameroon (%)
Place of birth for the foreign-born population - Congo (%)
Place of birth for the foreign-born population - Democratic Republic of Congo (Zaire) (%)
Place of birth for the foreign-born population - Other Middle Africa (%)
Place of birth for the foreign-born population - Egypt (%)
Place of birth for the foreign-born population - Morocco (%)
Place of birth for the foreign-born population - Sudan (%)
Place of birth for the foreign-born population - Other Northern Africa (%)
Place of birth for the foreign-born population - South Africa (%)
Place of birth for the foreign-born population - Other Southern Africa (%)
Place of birth for the foreign-born population - Cabo Verde (%)
Place of birth for the foreign-born population - Ghana (%)
Place of birth for the foreign-born population - Liberia (%)
Place of birth for the foreign-born population - Nigeria (%)
Place of birth for the foreign-born population - Senegal (%)
Place of birth for the foreign-born population - Sierra Leone (%)
Place of birth for the foreign-born population - Other Western Africa (%)
Place of birth for the foreign-born population - Australia (%)
Place of birth for the foreign-born population - New Zealand (%)
Place of birth for the foreign-born population - Fiji (%)
Place of birth for the foreign-born population - Micronesia (%)
Place of birth for the foreign-born population - Bahamas (%)
Place of birth for the foreign-born population - Barbados (%)
Place of birth for the foreign-born population - Cuba (%)
Place of birth for the foreign-born population - Dominica (%)
Place of birth for the foreign-born population - Dominican Republic (%)
Place of birth for the foreign-born population - Grenada (%)
Place of birth for the foreign-born population - Haiti (%)
Place of birth for the foreign-born population - Jamaica (%)
Place of birth for the foreign-born population - St. Vincent and the Grenadines (%)
Place of birth for the foreign-born population - Trinidad and Tobago (%)
Place of birth for the foreign-born population - West Indies (%)
Place of birth for the foreign-born population - Other Caribbean (%)
Place of birth for the foreign-born population - Belize (%)
Place of birth for the foreign-born population - Costa Rica (%)
Place of birth for the foreign-born population - El Salvador (%)
Place of birth for the foreign-born population - Guatemala (%)
Place of birth for the foreign-born population - Honduras (%)
Place of birth for the foreign-born population - Mexico (%)
Place of birth for the foreign-born population - Nicaragua (%)
Place of birth for the foreign-born population - Panama (%)
Place of birth for the foreign-born population - Other Central America (%)
Place of birth for the foreign-born population - Argentina (%)
Place of birth for the foreign-born population - Bolivia (%)
Place of birth for the foreign-born population - Brazil (%)
Place of birth for the foreign-born population - Chile (%)
Place of birth for the foreign-born population - Colombia (%)
Place of birth for the foreign-born population - Ecuador (%)
Place of birth for the foreign-born population - Guyana (%)
Place of birth for the foreign-born population - Peru (%)
Place of birth for the foreign-born population - Uruguay (%)
Place of birth for the foreign-born population - Venezuela (%)
Place of birth for the foreign-born population - Other South America (%)
Place of birth for the foreign-born population - Canada (%)
Place of birth for the foreign-born population - Other Northern America (%)
Place of birth for the foreign-born population - Other (%)
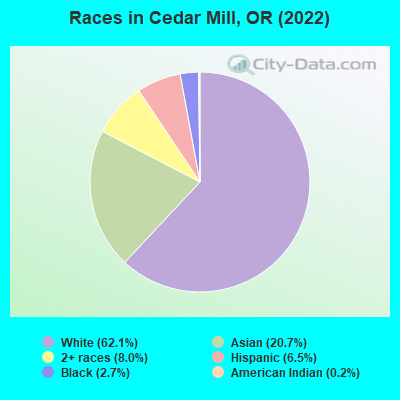
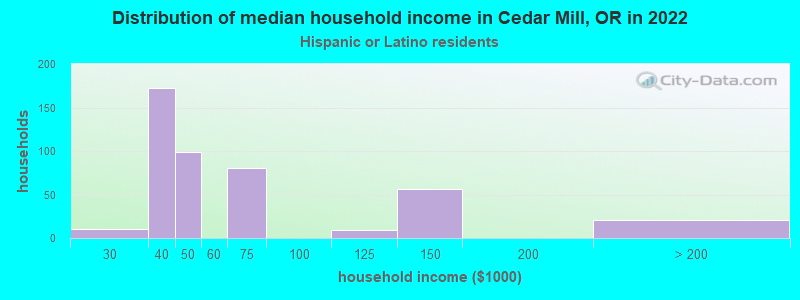
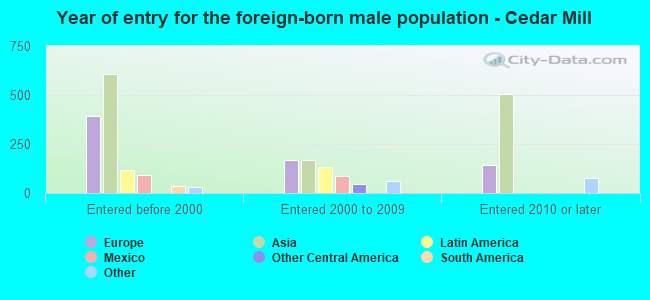
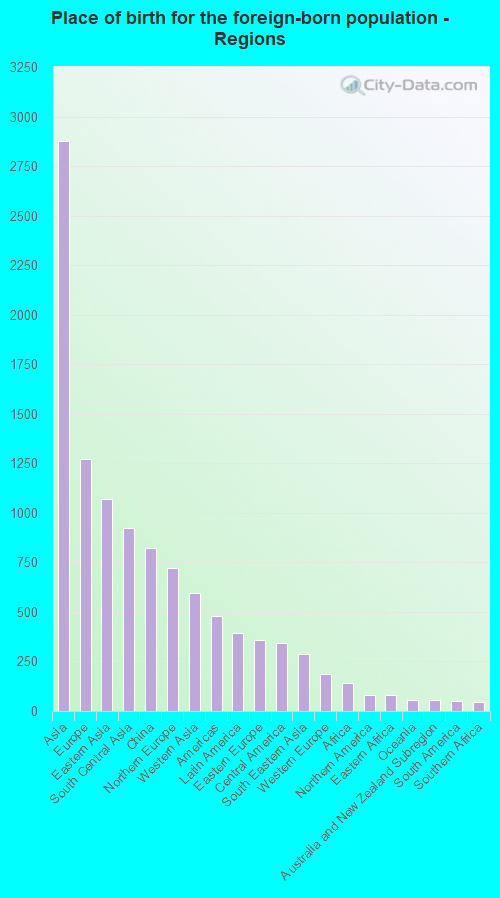
According to 2022 data, the most numerous races in Cedar Mill, OR are White alone (11,898 residents), Hispanic (1,242 residents), and Two or more races (1,538 residents). 70.8% of Cedar Mill residents speak English at home. 25.2% of Cedar Mill, OR residents are foreign-born (14.7% born in Asia, 6.5% born in Europe), which is 64.2% greater than the foreign-born rate of 9.0% across the entire state of Oregon.
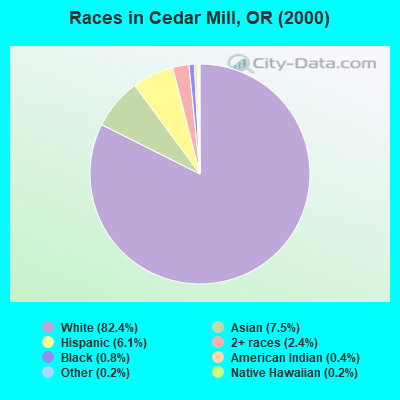
Race distribution in Cedar Mill
2000 2022
2,857,616 83.5% White alone 275,314 8.0% Hispanic 100,333 2.9% Asian alone 82,733 2.4% Two or more races 53,325 1.6% Black alone 40,130 1.2% American Indian alone 7,398 0.2% Native Hawaiian and Other 4,550 0.1% Other race alone
3,037,571 71.6% White alone 609,538 14.4% Hispanic 252,744 6.0% Two or more races 191,283 4.5% Asian alone 78,228 1.8% Black alone 29,399 0.7% American Indian alone 25,731 0.6% Other race alone 15,643 0.4% Native Hawaiian and Other
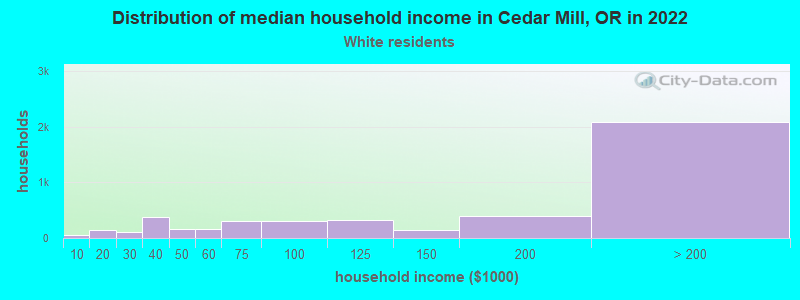
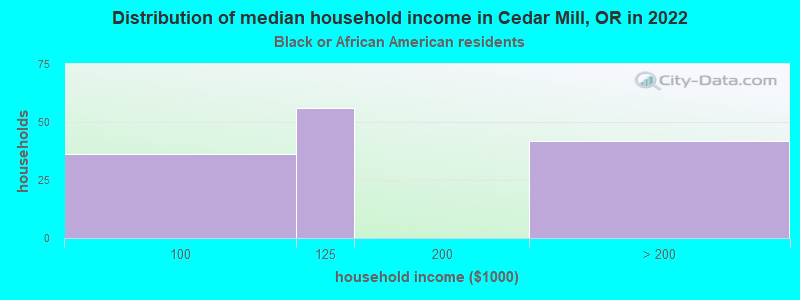
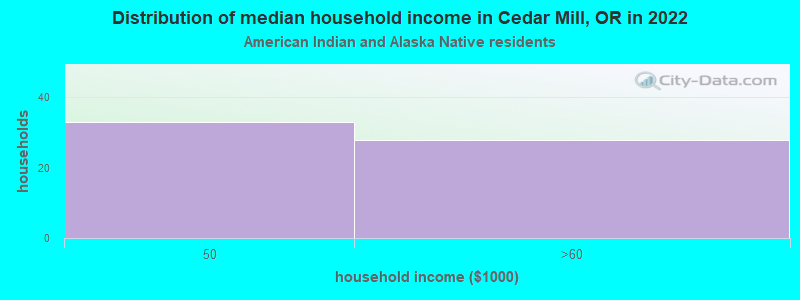
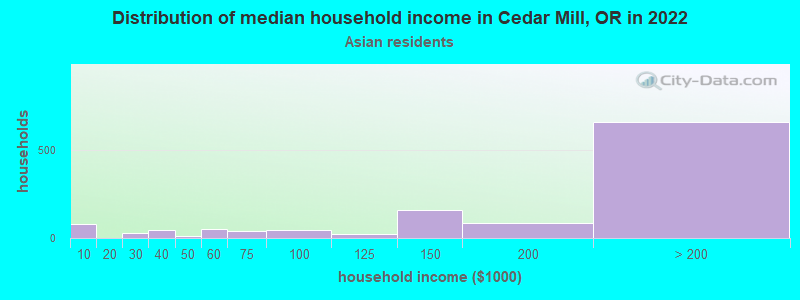
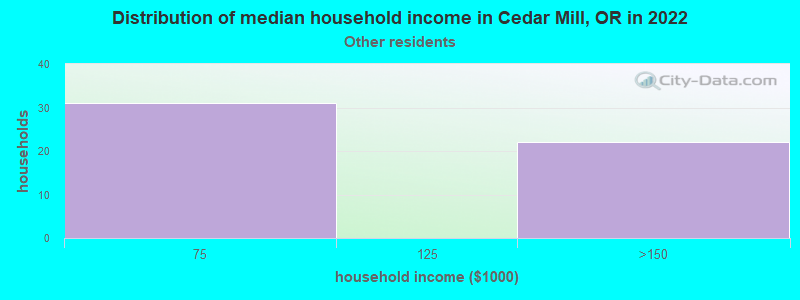
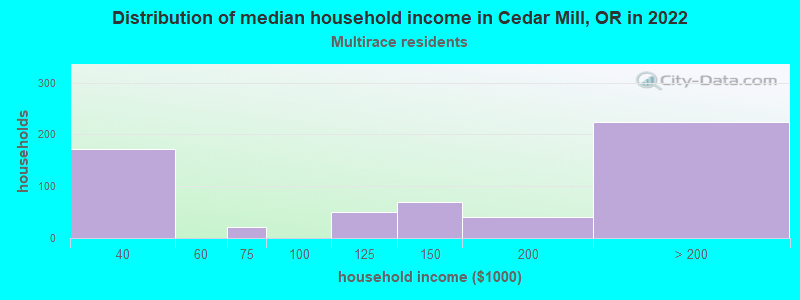
Income and house value in Cedar Mill Median household income in 2022 $181,727 White non-Hispanic householdersover $200,000 Asian householders$106,077 Two or more races householders$42,114 Hispanic or Latino race householdersMedian 2022 house value $986,094 White Non-Hispanic householders$826,643 Black or African American householders over $1,000,000 Asian householders$887,999 Some other race householders$774,106 Two or more races householders$860,444 Hispanic or Latino householders
Median age by race in Cedar Mill
39.6 Median age for White residents40.9 38.7 36.3 Median age for Black or African American residents38.5 5.9 -740,740,740.0 Median age for American Indian / Alaska Native residents-838,647,342.2 -658,119,657.5 44.7 Median age for Asian residents45.4 43.3 -642,169,728.1 Median age for Native Hawaiian / Pacific Islander residents-476,923,076.4 -850,649,349.8 36.3 Median age for Other race residents36.6 35.5 25.4 Median age for Two or more races residents20.9 27.0 39.8 Median age for White alone residents41.2 38.5 36.1 Median age for Hispanic or Latino residents29.4 38.1
Owner/renter occupied households by race in Cedar Mill
House owners and renters - White residents 3,225 71.6% Owner occupied1,278 28.4% Renter occupiedHouse owners and renters - Black or African American residents 60 42.7% Owner occupied80 57.3% Renter occupiedHouse owners and renters - American Indian / Alaska Native residents 24 41.2% Owner occupied34 58.8% Renter occupiedHouse owners and renters - Asian residents 1,311 96.2% Owner occupied52 3.8% Renter occupiedHouse owners and renters - Other race residents 50 100.0% Renter occupiedHouse owners and renters - Two or more races residents 559 85.3% Owner occupied96 14.7% Renter occupiedHouse owners and renters - White alone residents 3,266 73.6% Owner occupied1,169 26.4% Renter occupiedHouse owners and renters - Hispanic or Latino residents 290 56.1% Owner occupied228 43.9% Renter occupied
Language usage in Cedar Mill
English speakers - Total 70.8% of residents of Cedar Mill speak English at home.
4.5% of residents speak Spanish at home 375 46.5% Speak English very well432 53.5% Speak English less than very well24.7% of residents speak other language at home 3,753 85.0% Speak English very well661 15.0% Speak English less than very well
English speakers - Born in the United States 92.6% of residents of Cedar Mill speak English at home.
2.5% of residents speak Spanish at home 178 100.0% Speak English very well4.1% of residents speak other language at home 261 89.7% Speak English very well30 10.3% Speak English less than very well
English speakers - Native, born elsewhere 54.6% of residents of Cedar Mill speak English at home.
34.6% of residents speak Spanish at home 64 100.0% Speak English very well18.4% of residents speak other language at home 34 100.0% Speak English very well
English speakers - Foreign-born 16.4% of residents of Cedar Mill speak English at home.
7.9% of residents speak Spanish at home 46 12.1% Speak English very well335 87.9% Speak English less than very well71.7% of residents speak other language at home 2,840 82.2% Speak English very well616 17.8% Speak English less than very well
White (Caucasian) - Speak only English Native:
96.8% (9,379)Foreign-born:
31.0% (357)
White (Caucasian) - Speak another language Native:
3.4% (329)Foreign-born:
69.5% (802)
Black or African American - Speak another language Native:
16.0% (74)Foreign-born:
100.0% (90)
Asian - Speak only English Native:
61.9% (715)Foreign-born:
12.1% (316)
Asian - Speak another language Native:
36.5% (422)Foreign-born:
87.8% (2,290)
Other race - Speak another language Native:
51.9% (50)Foreign-born:
100.0% (179)
Two or more races - Speak only English Native:
80.4% (1,238)Foreign-born:
24.3% (110)
Two or more races - Speak another language Native:
19.4% (299)Foreign-born:
75.3% (340)
White alone - Speak only English Native:
96.4% (9,335)Foreign-born:
31.9% (397)
White alone - Speak another language Native:
3.6% (350)Foreign-born:
68.1% (848)
Hispanic or Latino - Speak another language Native:
37.3% (279)Foreign-born:
100.0% (415)
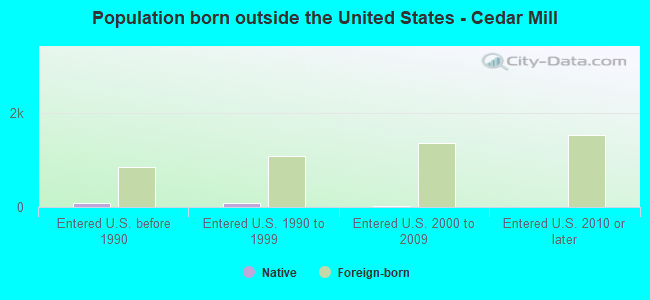
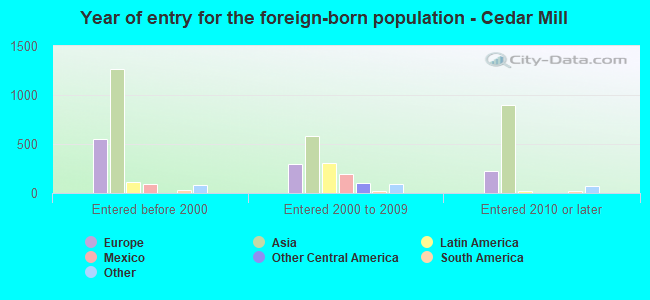
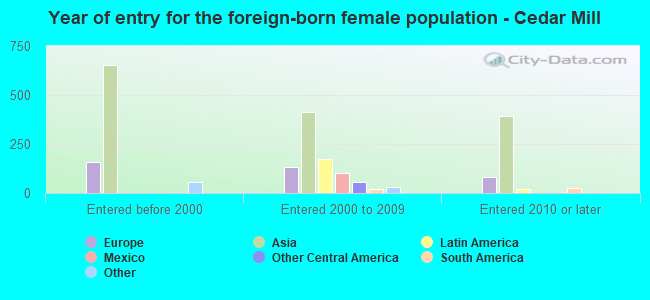
Foreign-born residents in Cedar Mill 4,825 residents are foreign born (14.7% Asia , 6.5% Europe ).
This city:
25.2%Oregon:
9.8%
Marital status for residents in Cedar Mill Marital status - White (Caucasian) population 15 years and over
Males 24.4% Never married65.7% Now married0.0% Separated5.3% Widowed4.6% DivorcedFemales 23.1% Never married60.9% Now married1.1% Separated4.3% Widowed10.7% DivorcedWomen who gave birth in the past 12 months Now married:
88.6% (225)Unmarried:
11.4% (29)
Women who did not give birth in the past 12 months Now married:
57.0% (1,176)Unmarried:
43.0% (887)
Marital status - Black or African American population 15 years and over
Males 43.3% Never married16.7% Now married34.0% Separated0.0% Widowed6.0% DivorcedFemales 0.0% Never married100.0% Now married0.0% Separated0.0% Widowed0.0% DivorcedWomen who did not give birth in the past 12 months Now married:
100.0% (64)Unmarried:
0.0% (0)
Marital status - Asian population 15 years and over
Males 21.8% Never married74.7% Now married0.0% Separated2.7% Widowed0.7% DivorcedFemales 17.2% Never married71.1% Now married0.0% Separated3.7% Widowed8.0% DivorcedWomen who gave birth in the past 12 months Now married:
100.0% (64)Unmarried:
0.0% (0)
Women who did not give birth in the past 12 months Now married:
66.0% (666)Unmarried:
34.0% (343)
Marital status - Other race population 15 years and over
Males 58.6% Never married41.4% Now married0.0% Separated0.0% Widowed0.0% DivorcedFemales 36.5% Never married17.3% Now married22.1% Separated0.0% Widowed24.0% DivorcedWomen who gave birth in the past 12 months Now married:
100.0% (25)Unmarried:
0.0% (0)
Women who did not give birth in the past 12 months Now married:
26.7% (31)Unmarried:
73.3% (86)
Marital status - Two or more races population 15 years and over
Males 42.9% Never married35.5% Now married0.0% Separated0.0% Widowed21.6% DivorcedFemales 53.2% Never married33.6% Now married0.0% Separated0.0% Widowed13.1% DivorcedWomen who gave birth in the past 12 months Now married:
100.0% (40)Unmarried:
0.0% (0)
Women who did not give birth in the past 12 months Now married:
29.8% (132)Unmarried:
70.2% (311)
Marital status - White alone, not Hispanic / Latino population 15 years and over
Males 24.1% Never married65.6% Now married0.0% Separated5.5% Widowed4.7% DivorcedFemales 22.0% Never married61.2% Now married1.1% Separated4.5% Widowed11.2% DivorcedWomen who gave birth in the past 12 months Now married:
88.6% (238)Unmarried:
11.4% (31)
Women who did not give birth in the past 12 months Now married:
57.5% (1,150)Unmarried:
42.5% (849)
Marital status - Hispanic or Latino population 15 years and over
Males 35.9% Never married58.1% Now married0.0% Separated0.0% Widowed6.0% DivorcedFemales 53.2% Never married35.8% Now married4.0% Separated0.0% Widowed7.0% DivorcedWomen who gave birth in the past 12 months Now married:
100.0% (19)Unmarried:
0.0% (0)
Women who did not give birth in the past 12 months Now married:
50.3% (201)Unmarried:
49.7% (199)
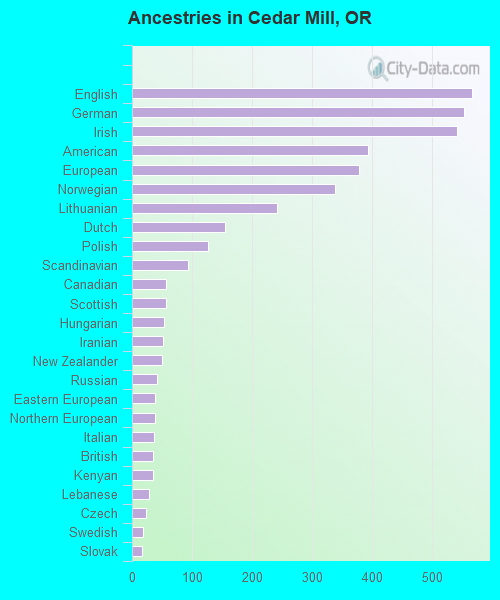
Ancestries in Cedar Mill
567 6.6% English554 6.4% German542 6.3% Irish394 4.6% American379 4.4% European339 3.9% Norwegian242 2.8% Lithuanian155 1.8% Dutch126 1.5% Polish94 1.1% Scandinavian56 0.6% Canadian56 0.6% Scottish53 0.6% Hungarian51 0.6% Iranian50 0.6% New Zealander41 0.5% Russian38 0.4% Eastern European38 0.4% Northern European36 0.4% Italian35 0.4% British35 0.4% Kenyan29 0.3% Lebanese24 0.3% Czech18 0.2% Swedish17 0.2% Slovak13 0.2% Danish13 0.2% Portuguese12 0.1% Scotch-Irish12 0.1% Turkish11 0.1% Egyptian11 0.1% Pennsylvania German10 0.1% Swiss9 0.1% French6 0.07% Belgian5 0.06% South African2 0.02% Welsh1 0.01% African
Geographical mobility in Cedar Mill Same house 1 year ago 9,922 86.6% White (Caucasian)448 87.1% Black or African American60 100.0% American Indian / Alaska Native3,598 91.3% Asian256 98.3% Other race1,982 93.2% Two or more races9,908 86.7% White alone, not Hispanic / Latino1,173 94.0% Hispanic or LatinoMoved within same county 838 7.3% White / Caucasian30 5.8% Black or African American158 4.0% Asian14 0.6% Two or more races854 7.5% White alone, not Hispanic / Latino24 1.9% Hispanic or LatinoMoved within same state 391 3.4% White / Caucasian115 2.9% Asian129 6.1% Two or more races331 2.9% White alone, not Hispanic / Latino37 2.9% Hispanic or LatinoMoved from different state 193 1.7% White / Caucasian43 8.4% Black or African American114 2.9% Asian1 40.5% Native Hawaiian / Pacific Islander32 1.5% Two or more races205 1.8% White alone, not Hispanic / LatinoMoved from abroad 71 0.6% White14 0.4% Asian9 3.3% Other race75 0.7% White alone, not Hispanic / Latino10 0.8% Hispanic or Latino
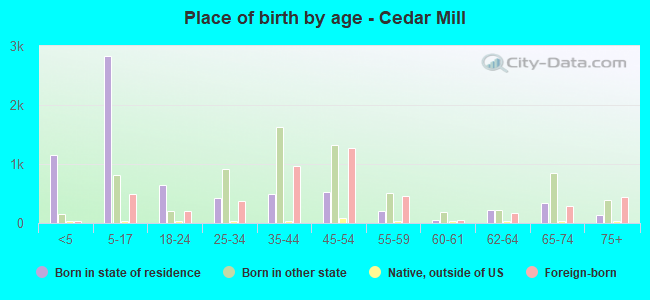
Children Nativity (place of birth) in Cedar Mill
Children under 6 years - Living with two parents Both parents native 1,163 100.0% NativeBoth parents foreign-born 315 100.0% NativeOne native, one foreign-born parent 128 100.0% NativeChildren under 6 years - Living with one parent Native parent 145 100.0% NativeChildren 6 to 17 years - Living with two parents Both parents native 1,601 99.7% Native5 0.3% Foreign-bornBoth parents foreign-born 929 79.7% Native237 20.3% Foreign-bornOne native, one foreign-born parent 219 100.0% NativeChildren 6 to 17 years - Living with one parent Native parent 405 100.0% NativeForeign-born parent 111 63.4% Native64 36.6% Foreign-born
Grandparents responsible for own grandchildren in Cedar Mill
Grandparents (30 to 59 years) White / Caucasian 29 100.0% Not responsible for grandchildrenWhite alone, not Hispanic / Latino 35 100.0% Not responsible for grandchildren
Grandparents (60 years and over) White / Caucasian 6 2.8% Responsible for grandchildren207 97.2% Not responsible for grandchildrenWhite alone, not Hispanic / Latino 6 2.5% Responsible for grandchildren251 97.5% Not responsible for grandchildren