Races in Centereach, New York (NY) Detailed Stats
Data:
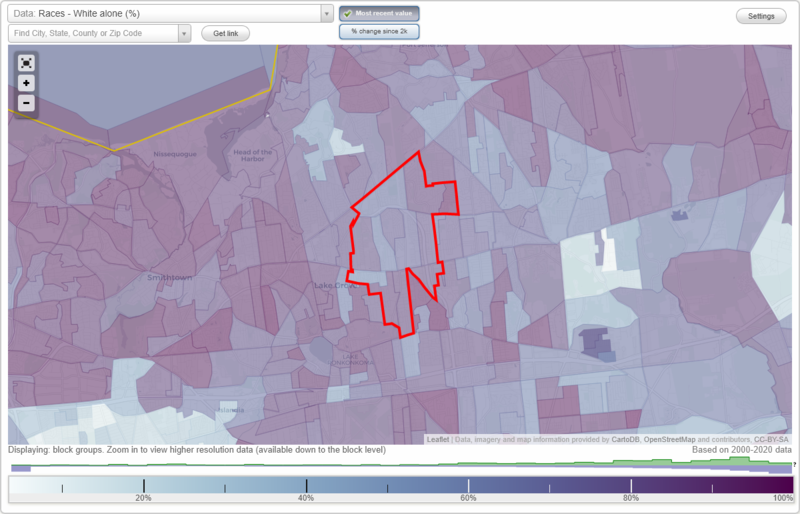
Races - White alone (%)
Races - White alone (% change since 2000)
Races - Black alone (%)
Races - Black alone (% change since 2000)
Races - American Indian alone (%)
Races - American Indian alone (% change since 2000)
Races - Asian alone (%)
Races - Asian alone (% change since 2000)
Races - Hispanic (%)
Races - Hispanic (% change since 2000)
Races - Native Hawaiian and Other Pacific Islander alone (%)
Races - Native Hawaiian and Other Pacific Islander alone (% change since 2000)
Races - Two or more races(%)
Races - Two or more races(% change since 2000)
Races - Other race alone (%)
Races - Other race alone (% change since 2000)
Racial diversity
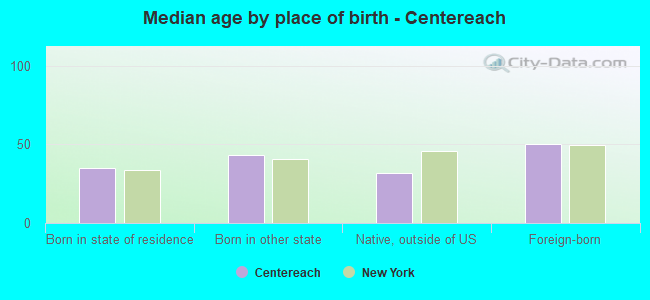
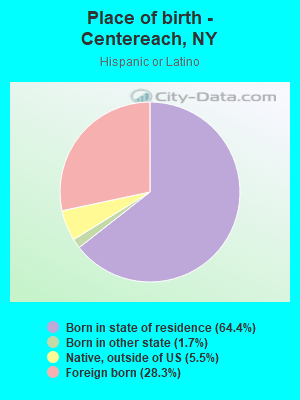
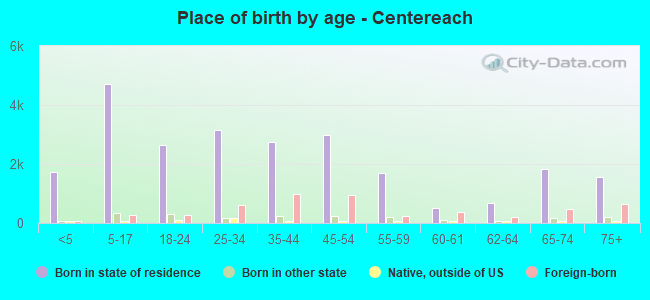
Place of birth - Born in state of residence (%)
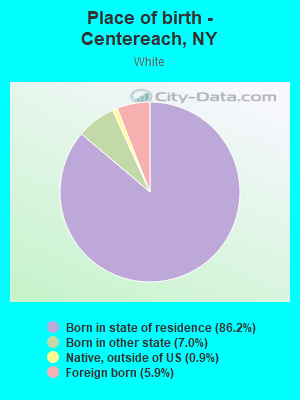
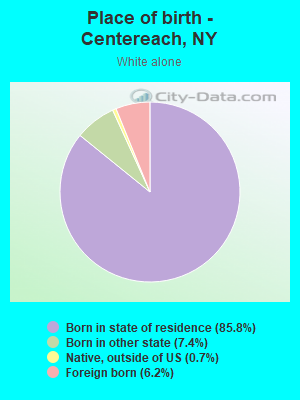
Place of birth - Born in state of residence (%) - White
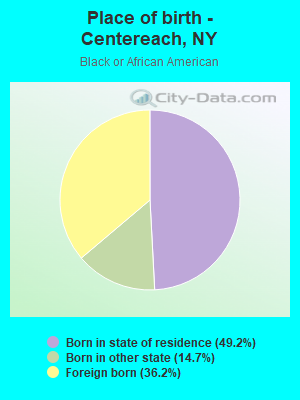
Place of birth - Born in state of residence (%) - Black or African American
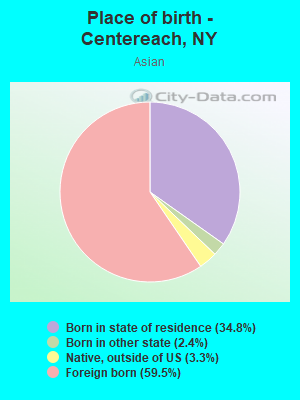
Place of birth - Born in state of residence (%) - Asian
Place of birth - Born in state of residence (%) - Hispanic or Latino
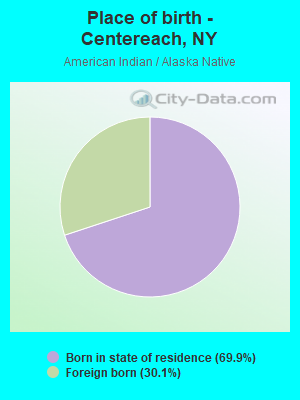
Place of birth - Born in state of residence (%) - American Indian and Alaska Native
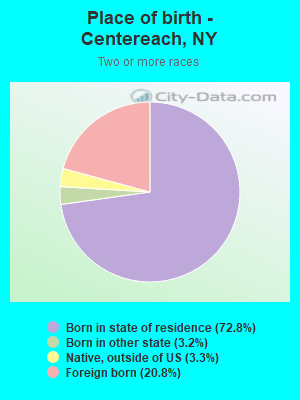
Place of birth - Born in state of residence (%) - Multirace
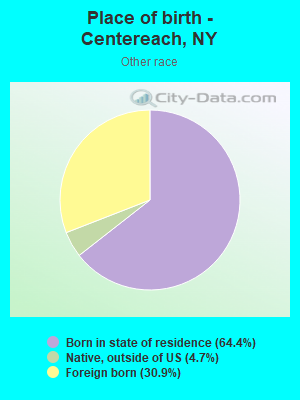
Place of birth - Born in state of residence (%) - Other Race
Place of birth - Born in other state (%)
Place of birth - Born in other state (%) - White
Place of birth - Born in other state (%) - Black or African American
Place of birth - Born in other state (%) - Asian
Place of birth - Born in other state (%) - Hispanic or Latino
Place of birth - Born in other state (%) - American Indian and Alaska Native
Place of birth - Born in other state (%) - Multirace
Place of birth - Born in other state (%) - Other Race
Place of birth - Native, outside of US (%)
Place of birth - Native, outside of US (%) - White
Place of birth - Native, outside of US (%) - Black or African American
Place of birth - Native, outside of US (%) - Asian
Place of birth - Native, outside of US (%) - Hispanic or Latino
Place of birth - Native, outside of US (%) - American Indian and Alaska Native
Place of birth - Native, outside of US (%) - Multirace
Place of birth - Native, outside of US (%) - Other Race
Place of birth - Foreign born (%)
Place of birth - Foreign born (%) - White
Place of birth - Foreign born (%) - Black or African American
Place of birth - Foreign born (%) - Asian
Place of birth - Foreign born (%) - Hispanic or Latino
Place of birth - Foreign born (%) - American Indian and Alaska Native
Place of birth - Foreign born (%) - Multirace
Place of birth - Foreign born (%) - Other Race
Residents speaking English at home (%)
Residents speaking English at home - Born in the United States (%)
Residents speaking English at home - Native, born elsewhere (%)
Residents speaking English at home - Foreign born (%)
Residents speaking Spanish at home (%)
Residents speaking Spanish at home - Born in the United States (%)
Residents speaking Spanish at home - Native, born elsewhere (%)
Residents speaking Spanish at home - Foreign born (%)
Residents speaking other language at home (%)
Residents speaking other language at home - Born in the United States (%)
Residents speaking other language at home - Native, born elsewhere (%)
Residents speaking other language at home - Foreign born (%)
Marital status - Never married (%)
Marital status - Now married (%)
Marital status - Separated (%)
Marital status - Widowed (%)
Marital status - Divorced (%)
Ancestries Reported - Arab (%)
Ancestries Reported - Czech (%)
Ancestries Reported - Danish (%)
Ancestries Reported - Dutch (%)
Ancestries Reported - English (%)
Ancestries Reported - French (%)
Ancestries Reported - French Canadian (%)
Ancestries Reported - German (%)
Ancestries Reported - Greek (%)
Ancestries Reported - Hungarian (%)
Ancestries Reported - Irish (%)
Ancestries Reported - Italian (%)
Ancestries Reported - Lithuanian (%)
Ancestries Reported - Norwegian (%)
Ancestries Reported - Polish (%)
Ancestries Reported - Portuguese (%)
Ancestries Reported - Russian (%)
Ancestries Reported - Scotch-Irish (%)
Ancestries Reported - Scottish (%)
Ancestries Reported - Slovak (%)
Ancestries Reported - Subsaharan African (%)
Ancestries Reported - Swedish (%)
Ancestries Reported - Swiss (%)
Ancestries Reported - Ukrainian (%)
Ancestries Reported - United States (%)
Ancestries Reported - Welsh (%)
Ancestries Reported - West Indian (%)
Ancestries Reported - Other (%)
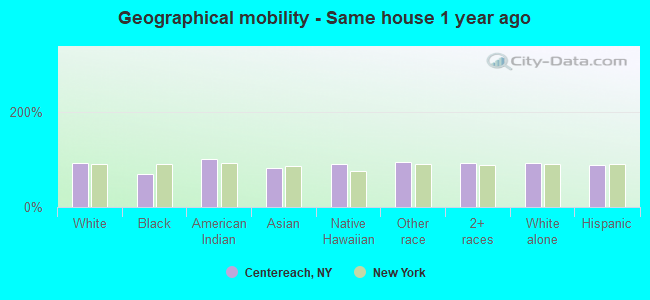
Geographical mobility - Same house 1 year ago (%)
Geographical mobility - Same house 1 year ago (%) - White
Geographical mobility - Same house 1 year ago (%) - Black or African American
Geographical mobility - Same house 1 year ago (%) - Asian
Geographical mobility - Same house 1 year ago (%) - Hispanic or Latino
Geographical mobility - Same house 1 year ago (%) - American Indian and Alaska Native
Geographical mobility - Same house 1 year ago (%) - Multirace
Geographical mobility - Same house 1 year ago (%) - Other Race
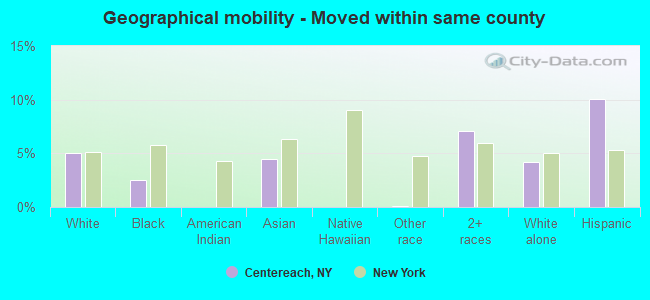
Geographical mobility - Moved within same county (%)
Geographical mobility - Moved within same county (%) - White
Geographical mobility - Moved within same county (%) - Black or African American
Geographical mobility - Moved within same county (%) - Asian
Geographical mobility - Moved within same county (%) - Hispanic or Latino
Geographical mobility - Moved within same county (%) - American Indian and Alaska Native
Geographical mobility - Moved within same county (%) - Multirace
Geographical mobility - Moved within same county (%) - Other Race
Geographical mobility - Moved from different county within same state (%)
Geographical mobility - Moved from different county within same state (%) - White
Geographical mobility - Moved from different county within same state (%) - Black or African American
Geographical mobility - Moved from different county within same state (%) - Asian
Geographical mobility - Moved from different county within same state (%) - Hispanic or Latino
Geographical mobility - Moved from different county within same state (%) - American Indian and Alaska Native
Geographical mobility - Moved from different county within same state (%) - Multirace
Geographical mobility - Moved from different county within same state (%) - Other Race
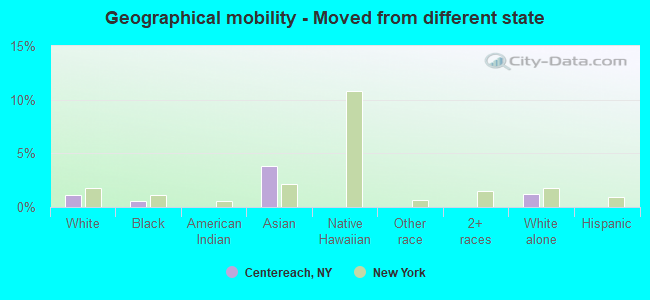
Geographical mobility - Moved from different state (%)
Geographical mobility - Moved from different state (%) - White
Geographical mobility - Moved from different state (%) - Black or African American
Geographical mobility - Moved from different state (%) - Asian
Geographical mobility - Moved from different state (%) - Hispanic or Latino
Geographical mobility - Moved from different state (%) - American Indian and Alaska Native
Geographical mobility - Moved from different state (%) - Multirace
Geographical mobility - Moved from different state (%) - Other Race
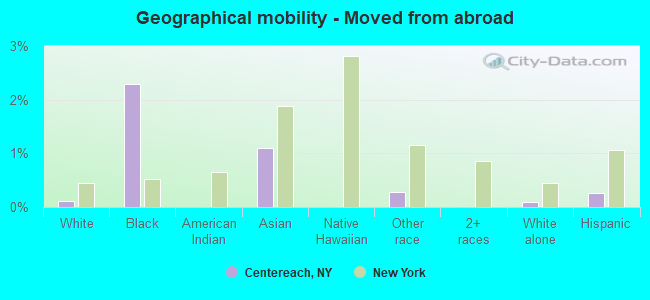
Geographical mobility - Moved from abroad (%)
Geographical mobility - Moved from abroad (%) - White
Geographical mobility - Moved from abroad (%) - Black or African American
Geographical mobility - Moved from abroad (%) - Asian
Geographical mobility - Moved from abroad (%) - Hispanic or Latino
Geographical mobility - Moved from abroad (%) - American Indian and Alaska Native
Geographical mobility - Moved from abroad (%) - Multirace
Geographical mobility - Moved from abroad (%) - Other Race
Place of birth for the foreign-born population - Ireland (%)
Place of birth for the foreign-born population - Denmark (%)
Place of birth for the foreign-born population - Norway (%)
Place of birth for the foreign-born population - Sweden (%)
Place of birth for the foreign-born population - United Kingdom (%)
Place of birth for the foreign-born population - England (%)
Place of birth for the foreign-born population - Scotland (%)
Place of birth for the foreign-born population - Other Northern Europe (%)
Place of birth for the foreign-born population - Austria (%)
Place of birth for the foreign-born population - Belgium (%)
Place of birth for the foreign-born population - France (%)
Place of birth for the foreign-born population - Germany (%)
Place of birth for the foreign-born population - Netherlands (%)
Place of birth for the foreign-born population - Switzerland (%)
Place of birth for the foreign-born population - Other Western Europe (%)
Place of birth for the foreign-born population - Greece (%)
Place of birth for the foreign-born population - Italy (%)
Place of birth for the foreign-born population - Portugal (%)
Place of birth for the foreign-born population - Spain (%)
Place of birth for the foreign-born population - Other Southern Europe (%)
Place of birth for the foreign-born population - Albania (%)
Place of birth for the foreign-born population - Belarus (%)
Place of birth for the foreign-born population - Bosnia and Herzegovina (%)
Place of birth for the foreign-born population - Bulgaria (%)
Place of birth for the foreign-born population - Croatia (%)
Place of birth for the foreign-born population - Czechoslovakia (%)
Place of birth for the foreign-born population - Hungary (%)
Place of birth for the foreign-born population - Latvia (%)
Place of birth for the foreign-born population - Lithuania (%)
Place of birth for the foreign-born population - North Macedonia (Macedonia) (%)
Place of birth for the foreign-born population - Moldova (%)
Place of birth for the foreign-born population - Poland (%)
Place of birth for the foreign-born population - Romania (%)
Place of birth for the foreign-born population - Russia (%)
Place of birth for the foreign-born population - Serbia (%)
Place of birth for the foreign-born population - Ukraine (%)
Place of birth for the foreign-born population - Other Eastern Europe (%)
Place of birth for the foreign-born population - China (%)
Place of birth for the foreign-born population - Hong Kong (%)
Place of birth for the foreign-born population - Taiwan (%)
Place of birth for the foreign-born population - Japan (%)
Place of birth for the foreign-born population - Korea (%)
Place of birth for the foreign-born population - Other Eastern Asia (%)
Place of birth for the foreign-born population - Afghanistan (%)
Place of birth for the foreign-born population - Bangladesh (%)
Place of birth for the foreign-born population - India (%)
Place of birth for the foreign-born population - Iran (%)
Place of birth for the foreign-born population - Kazakhstan (%)
Place of birth for the foreign-born population - Nepal (%)
Place of birth for the foreign-born population - Pakistan (%)
Place of birth for the foreign-born population - Sri Lanka (%)
Place of birth for the foreign-born population - Uzbekistan (%)
Place of birth for the foreign-born population - Other South Central Asia (%)
Place of birth for the foreign-born population - Burma (%)
Place of birth for the foreign-born population - Cambodia (%)
Place of birth for the foreign-born population - Indonesia (%)
Place of birth for the foreign-born population - Laos (%)
Place of birth for the foreign-born population - Malaysia (%)
Place of birth for the foreign-born population - Philippines (%)
Place of birth for the foreign-born population - Singapore (%)
Place of birth for the foreign-born population - Thailand (%)
Place of birth for the foreign-born population - Vietnam (%)
Place of birth for the foreign-born population - Other South Eastern Asia (%)
Place of birth for the foreign-born population - Armenia (%)
Place of birth for the foreign-born population - Iraq (%)
Place of birth for the foreign-born population - Israel (%)
Place of birth for the foreign-born population - Jordan (%)
Place of birth for the foreign-born population - Kuwait (%)
Place of birth for the foreign-born population - Lebanon (%)
Place of birth for the foreign-born population - Saudi Arabia (%)
Place of birth for the foreign-born population - Syria (%)
Place of birth for the foreign-born population - Turkey (%)
Place of birth for the foreign-born population - Yemen (%)
Place of birth for the foreign-born population - Other Western Asia (%)
Place of birth for the foreign-born population - Eritrea (%)
Place of birth for the foreign-born population - Ethiopia (%)
Place of birth for the foreign-born population - Kenya (%)
Place of birth for the foreign-born population - Somalia (%)
Place of birth for the foreign-born population - Uganda (%)
Place of birth for the foreign-born population - Zimbabwe (%)
Place of birth for the foreign-born population - Other Eastern Africa (%)
Place of birth for the foreign-born population - Cameroon (%)
Place of birth for the foreign-born population - Congo (%)
Place of birth for the foreign-born population - Democratic Republic of Congo (Zaire) (%)
Place of birth for the foreign-born population - Other Middle Africa (%)
Place of birth for the foreign-born population - Egypt (%)
Place of birth for the foreign-born population - Morocco (%)
Place of birth for the foreign-born population - Sudan (%)
Place of birth for the foreign-born population - Other Northern Africa (%)
Place of birth for the foreign-born population - South Africa (%)
Place of birth for the foreign-born population - Other Southern Africa (%)
Place of birth for the foreign-born population - Cabo Verde (%)
Place of birth for the foreign-born population - Ghana (%)
Place of birth for the foreign-born population - Liberia (%)
Place of birth for the foreign-born population - Nigeria (%)
Place of birth for the foreign-born population - Senegal (%)
Place of birth for the foreign-born population - Sierra Leone (%)
Place of birth for the foreign-born population - Other Western Africa (%)
Place of birth for the foreign-born population - Australia (%)
Place of birth for the foreign-born population - New Zealand (%)
Place of birth for the foreign-born population - Fiji (%)
Place of birth for the foreign-born population - Micronesia (%)
Place of birth for the foreign-born population - Bahamas (%)
Place of birth for the foreign-born population - Barbados (%)
Place of birth for the foreign-born population - Cuba (%)
Place of birth for the foreign-born population - Dominica (%)
Place of birth for the foreign-born population - Dominican Republic (%)
Place of birth for the foreign-born population - Grenada (%)
Place of birth for the foreign-born population - Haiti (%)
Place of birth for the foreign-born population - Jamaica (%)
Place of birth for the foreign-born population - St. Vincent and the Grenadines (%)
Place of birth for the foreign-born population - Trinidad and Tobago (%)
Place of birth for the foreign-born population - West Indies (%)
Place of birth for the foreign-born population - Other Caribbean (%)
Place of birth for the foreign-born population - Belize (%)
Place of birth for the foreign-born population - Costa Rica (%)
Place of birth for the foreign-born population - El Salvador (%)
Place of birth for the foreign-born population - Guatemala (%)
Place of birth for the foreign-born population - Honduras (%)
Place of birth for the foreign-born population - Mexico (%)
Place of birth for the foreign-born population - Nicaragua (%)
Place of birth for the foreign-born population - Panama (%)
Place of birth for the foreign-born population - Other Central America (%)
Place of birth for the foreign-born population - Argentina (%)
Place of birth for the foreign-born population - Bolivia (%)
Place of birth for the foreign-born population - Brazil (%)
Place of birth for the foreign-born population - Chile (%)
Place of birth for the foreign-born population - Colombia (%)
Place of birth for the foreign-born population - Ecuador (%)
Place of birth for the foreign-born population - Guyana (%)
Place of birth for the foreign-born population - Peru (%)
Place of birth for the foreign-born population - Uruguay (%)
Place of birth for the foreign-born population - Venezuela (%)
Place of birth for the foreign-born population - Other South America (%)
Place of birth for the foreign-born population - Canada (%)
Place of birth for the foreign-born population - Other Northern America (%)
Place of birth for the foreign-born population - Other (%)
Latest news about races in Centereach, NY collected exclusively by city-data.com from local newspapers, TV, and radio stations
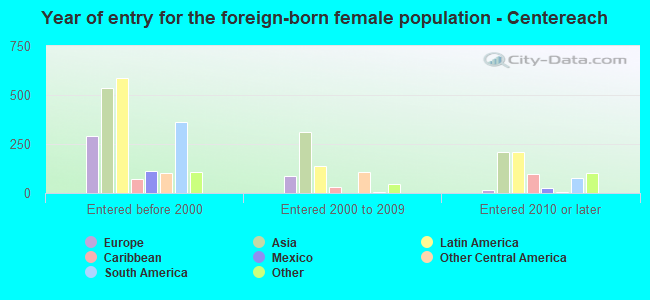
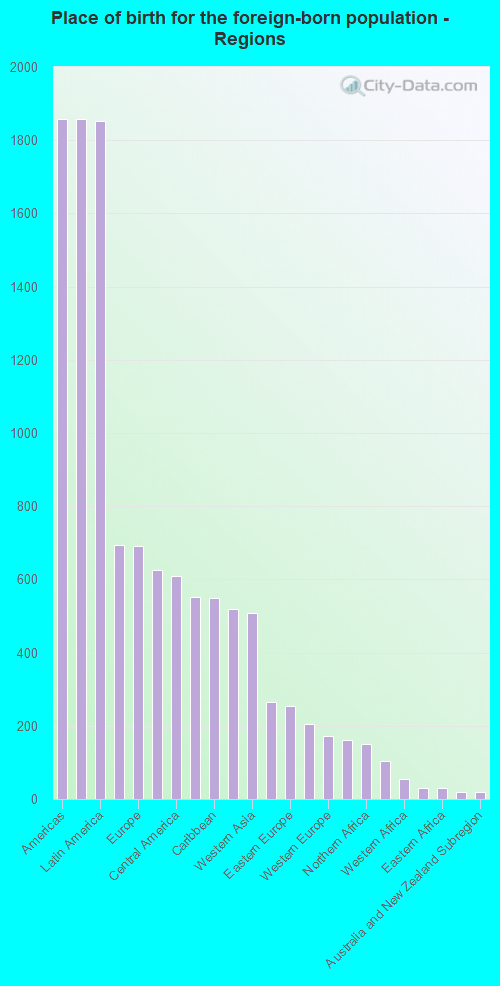
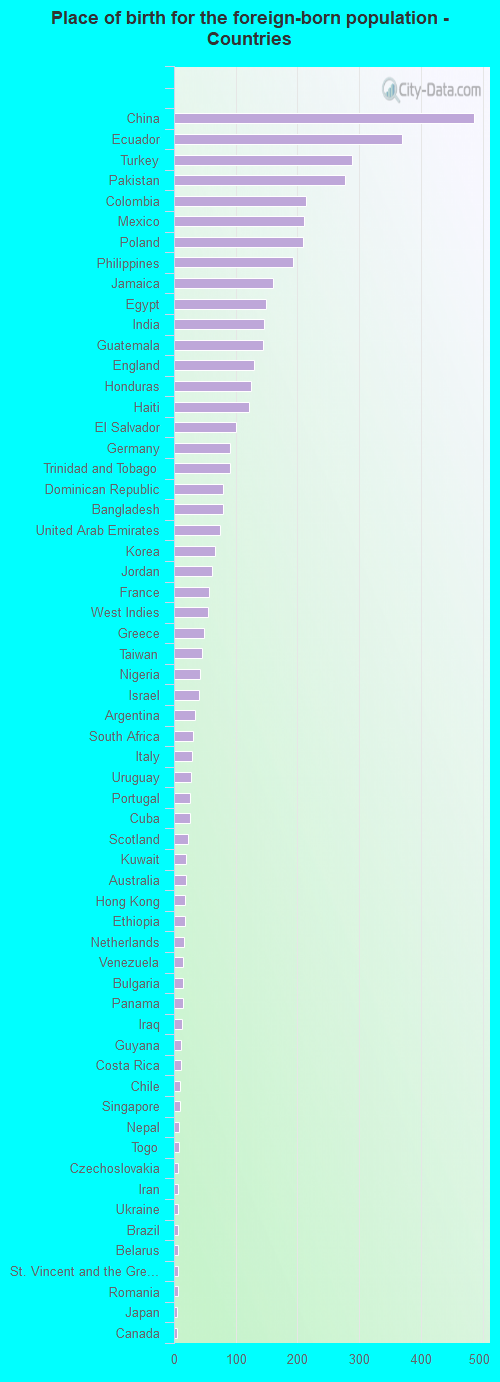
According to 2022 data, the most numerous races in Centereach, NY are White alone (20,992 residents), Hispanic (5,516 residents), and Black alone (1,731 residents). 80.4% of Centereach residents speak English at home. 14.7% of Centereach, NY residents are foreign-born (5.9% born in Asia, 5.9% born in Latin America, 2.2% born in Europe), which is 49.5% less than the foreign-born rate of 22.0% across the entire state of New York.
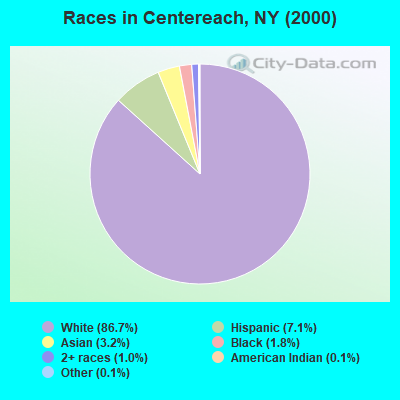
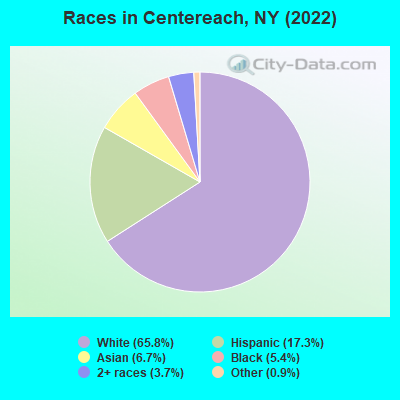
Race distribution in Centereach
2000 2022
11,760,981 62.0% White alone 2,867,583 15.1% Hispanic 2,812,623 14.8% Black alone 1,035,926 5.5% Asian alone 366,116 1.9% Two or more races 75,499 0.4% Other race alone 52,499 0.3% American Indian alone 5,230 0.03% Native Hawaiian and Other
10,408,933 52.9% White alone 3,867,299 19.7% Hispanic 2,633,840 13.4% Black alone 1,776,286 9.0% Asian alone 732,670 3.7% Two or more races 216,110 1.1% Other race alone 35,082 0.2% American Indian alone 6,931 0.04% Native Hawaiian and Other
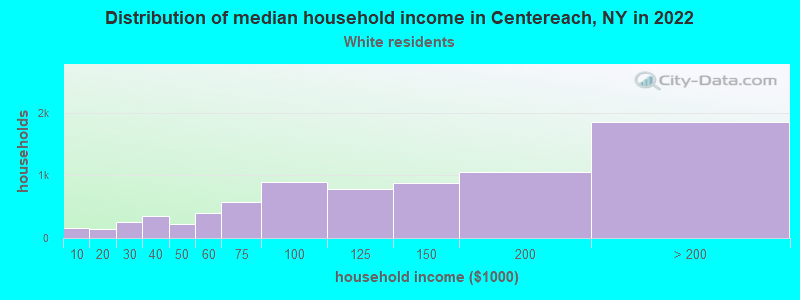
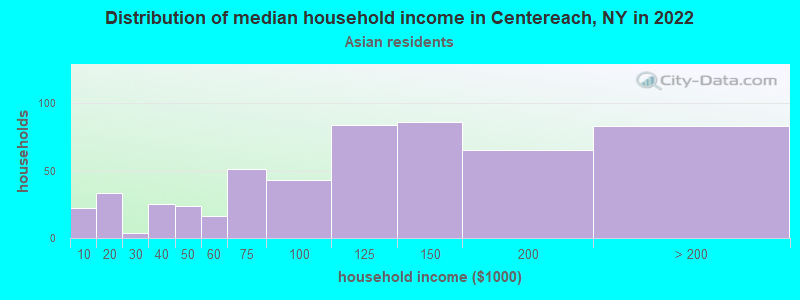
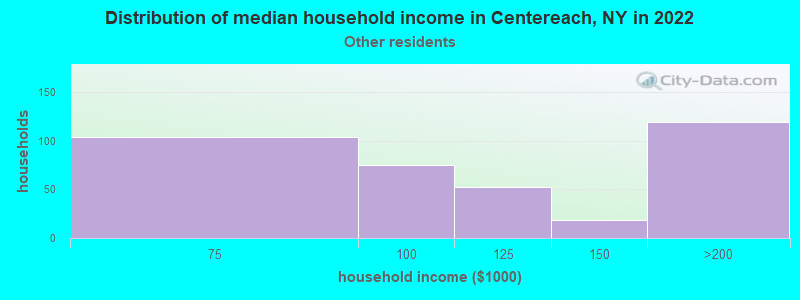
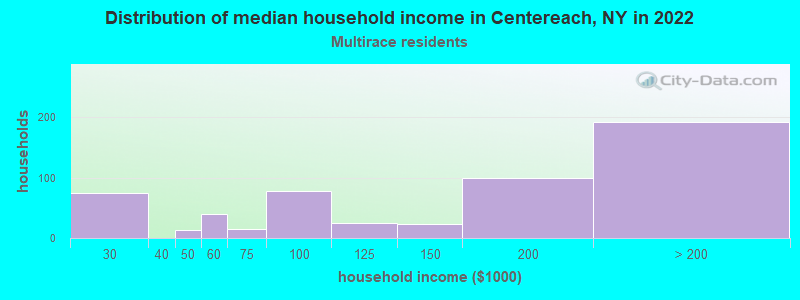
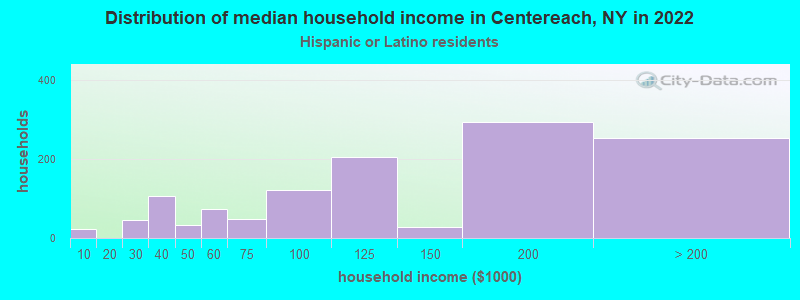
Income and house value in Centereach Median household income in 2022 $125,509 White non-Hispanic householders$123,085 Black householders$109,516 Asian householders$89,073 Some other race householders$172,464 Two or more races householders$117,653 Hispanic or Latino race householdersMedian 2022 house value $488,687 White Non-Hispanic householders$473,300 Black or African American householders$500,073 American Indian or Alaska Native householders $587,471 Asian householders$482,532 Some other race householders$498,535 Two or more races householders$483,763 Hispanic or Latino householders
Median age by race in Centereach
42.2 Median age for White residents40.1 45.5 35.5 Median age for Black or African American residents36.2 34.9 49.0 Median age for American Indian / Alaska Native residents69.1 33.5 36.1 Median age for Asian residents34.2 39.8 -742,816,091.2 Median age for Native Hawaiian / Pacific Islander residents-831,187,409.8 -771,300,447.7 26.8 Median age for Other race residents24.9 29.7 27.3 Median age for Two or more races residents26.1 29.4 42.5 Median age for White alone residents40.3 45.3 30.1 Median age for Hispanic or Latino residents30.6 29.9
Owner/renter occupied households by race in Centereach
House owners and renters - White residents 6,395 84.1% Owner occupied1,208 15.9% Renter occupiedHouse owners and renters - Black or African American residents 447 79.2% Owner occupied117 20.8% Renter occupiedHouse owners and renters - American Indian / Alaska Native residents 21 100.0% Owner occupiedHouse owners and renters - Asian residents 461 83.7% Owner occupied90 16.3% Renter occupiedHouse owners and renters - Other race residents 306 85.8% Owner occupied50 14.2% Renter occupiedHouse owners and renters - Two or more races residents 379 66.4% Owner occupied192 33.6% Renter occupiedHouse owners and renters - White alone residents 6,162 83.8% Owner occupied1,193 16.2% Renter occupiedHouse owners and renters - Hispanic or Latino residents 919 76.2% Owner occupied287 23.8% Renter occupied
Language usage in Centereach
English speakers - Total 80.4% of residents of Centereach speak English at home.
8.2% of residents speak Spanish at home 1,478 59.7% Speak English very well996 40.3% Speak English less than very well11.1% of residents speak other language at home 2,338 70.0% Speak English very well1,002 30.0% Speak English less than very well
English speakers - Born in the United States 92.5% of residents of Centereach speak English at home.
4.9% of residents speak Spanish at home 75 75.0% Speak English very well25 25.0% Speak English less than very well2.0% of residents speak other language at home 40 100.0% Speak English very well
English speakers - Native, born elsewhere 53.8% of residents of Centereach speak English at home.
36.0% of residents speak Spanish at home 166 91.2% Speak English very well16 8.8% Speak English less than very well16.0% of residents speak other language at home 79 97.5% Speak English very well2 2.5% Speak English less than very well
English speakers - Foreign-born 22.2% of residents of Centereach speak English at home.
26.8% of residents speak Spanish at home 450 33.1% Speak English very well909 66.9% Speak English less than very well49.5% of residents speak other language at home 1,527 60.7% Speak English very well990 39.3% Speak English less than very well
White (Caucasian) - Speak only English Native:
98.2% (19,336)Foreign-born:
30.3% (393)
White (Caucasian) - Speak another language Native:
2.7% (528)Foreign-born:
69.9% (905)
Black or African American - Speak only English Native:
93.5% (1,120)Foreign-born:
61.0% (439)
Black or African American - Speak another language Native:
4.7% (57)Foreign-born:
40.3% (290)
American Indian / Alaska Native - Speak another language Native:
53.3% (51)Foreign-born:
100.0% (45)
Asian - Speak only English Native:
50.4% (337)Foreign-born:
7.4% (98)
Asian - Speak another language Native:
48.7% (325)Foreign-born:
95.5% (1,271)
Other race - Speak only English Native:
47.8% (549)Foreign-born:
17.1% (101)
Other race - Speak another language Native:
53.2% (611)Foreign-born:
80.7% (477)
Two or more races - Speak only English Native:
84.5% (1,807)Foreign-born:
17.7% (107)
Two or more races - Speak another language Native:
16.2% (347)Foreign-born:
81.6% (494)
White alone - Speak only English Native:
97.5% (18,406)Foreign-born:
29.8% (386)
White alone - Speak another language Native:
2.3% (441)Foreign-born:
70.2% (908)
Hispanic or Latino - Speak only English Native:
69.7% (2,286)Foreign-born:
10.4% (160)
Hispanic or Latino - Speak another language Native:
31.6% (1,038)Foreign-born:
89.2% (1,366)
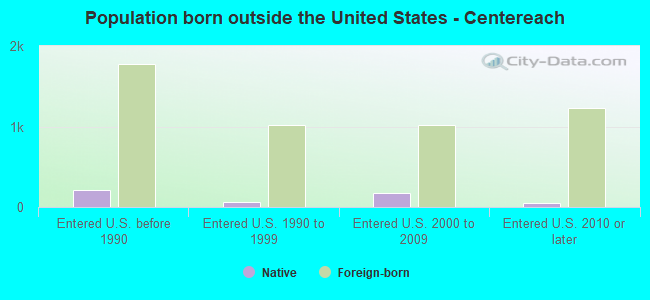
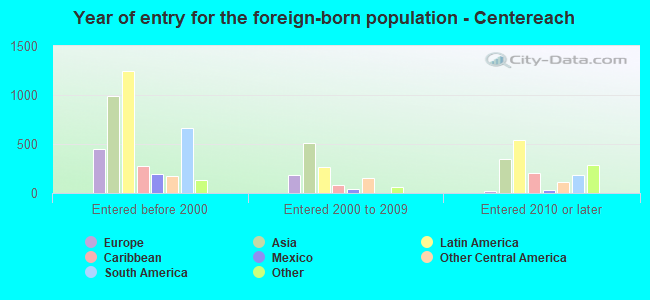
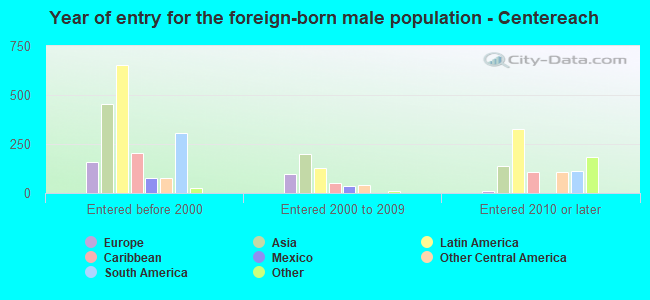
Foreign-born residents in Centereach 4,696 residents are foreign born (5.9% Asia , 5.9% Latin America , 2.2% Europe ).
This city:
14.7%New York:
22.6%
Marital status for residents in Centereach Marital status - White (Caucasian) population 15 years and over
Males 36.4% Never married54.8% Now married0.5% Separated3.4% Widowed5.0% DivorcedFemales 32.5% Never married50.8% Now married1.1% Separated9.1% Widowed6.6% DivorcedWomen who gave birth in the past 12 months Now married:
51.7% (66)Unmarried:
48.3% (62)
Women who did not give birth in the past 12 months Now married:
43.7% (2,130)Unmarried:
56.3% (2,745)
Marital status - Black or African American population 15 years and over
Males 34.0% Never married59.7% Now married3.9% Separated0.0% Widowed2.4% DivorcedFemales 39.8% Never married53.4% Now married0.0% Separated3.6% Widowed3.3% DivorcedWomen who did not give birth in the past 12 months Now married:
61.4% (295)Unmarried:
38.6% (186)
Marital status - American Indian / Alaska Native population 15 years and over
Males 47.5% Never married52.5% Now married0.0% Separated0.0% Widowed0.0% DivorcedFemales 36.5% Never married63.5% Now married0.0% Separated0.0% Widowed0.0% DivorcedWomen who did not give birth in the past 12 months Now married:
42.4% (20)Unmarried:
57.6% (27)
Marital status - Asian population 15 years and over
Males 24.6% Never married74.1% Now married1.1% Separated0.0% Widowed0.3% DivorcedFemales 28.9% Never married63.5% Now married1.5% Separated5.0% Widowed1.2% DivorcedWomen who gave birth in the past 12 months Now married:
100.0% (19)Unmarried:
0.0% (0)
Women who did not give birth in the past 12 months Now married:
53.0% (312)Unmarried:
47.0% (277)
Marital status - Other race population 15 years and over
Males 47.2% Never married49.9% Now married2.9% Separated0.0% Widowed0.0% DivorcedFemales 41.7% Never married43.1% Now married0.0% Separated7.0% Widowed8.2% DivorcedWomen who gave birth in the past 12 months Now married:
100.0% (9)Unmarried:
0.0% (0)
Women who did not give birth in the past 12 months Now married:
37.7% (143)Unmarried:
62.3% (236)
Marital status - Two or more races population 15 years and over
Males 52.6% Never married43.7% Now married0.0% Separated0.0% Widowed3.7% DivorcedFemales 58.2% Never married29.7% Now married2.1% Separated4.8% Widowed5.2% DivorcedWomen who did not give birth in the past 12 months Now married:
22.0% (199)Unmarried:
78.0% (705)
Marital status - White alone, not Hispanic / Latino population 15 years and over
Males 37.1% Never married53.8% Now married0.5% Separated3.6% Widowed5.0% DivorcedFemales 31.6% Never married50.7% Now married1.2% Separated9.6% Widowed6.8% DivorcedWomen who gave birth in the past 12 months Now married:
66.7% (71)Unmarried:
33.3% (36)
Women who did not give birth in the past 12 months Now married:
44.7% (2,150)Unmarried:
55.3% (2,662)
Marital status - Hispanic or Latino population 15 years and over
Males 37.9% Never married57.2% Now married0.6% Separated0.5% Widowed3.8% DivorcedFemales 44.2% Never married43.6% Now married1.0% Separated5.6% Widowed5.6% DivorcedWomen who gave birth in the past 12 months Now married:
15.4% (6)Unmarried:
84.6% (34)
Women who did not give birth in the past 12 months Now married:
34.2% (423)Unmarried:
65.8% (814)
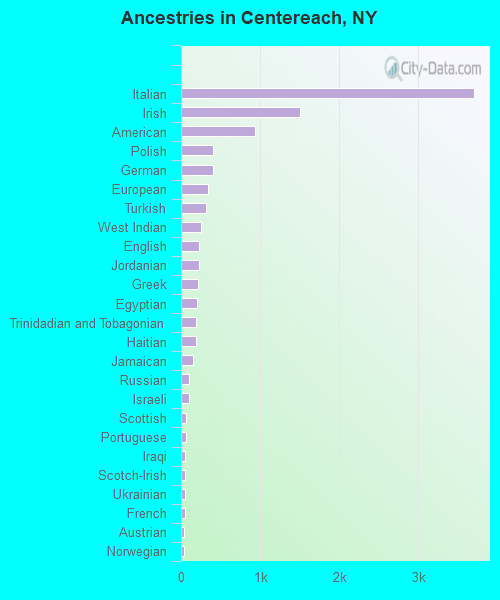
Ancestries in Centereach
3,709 24.6% Italian1,504 10.0% Irish934 6.2% American410 2.7% Polish410 2.7% German344 2.3% European319 2.1% Turkish257 1.7% West Indian229 1.5% English227 1.5% Jordanian218 1.4% Greek203 1.3% Egyptian189 1.3% Trinidadian and Tobagonian185 1.2% Haitian154 1.0% Jamaican106 0.7% Russian103 0.7% Israeli61 0.4% Scottish61 0.4% Portuguese51 0.3% Iraqi51 0.3% Scotch-Irish46 0.3% Ukrainian45 0.3% French43 0.3% Austrian42 0.3% Norwegian39 0.3% Ethiopian30 0.2% Eastern European29 0.2% Hungarian24 0.2% Swedish23 0.2% Dutch14 0.09% Canadian13 0.09% Armenian12 0.08% Croatian12 0.08% Bulgarian11 0.07% Czechoslovakian10 0.07% Iranian10 0.07% British West Indian7 0.05% Czech7 0.05% Ghanaian6 0.04% African5 0.03% Swiss4 0.03% Lithuanian4 0.03% Maltese4 0.03% Slovak3 0.02% British3 0.02% Northern European
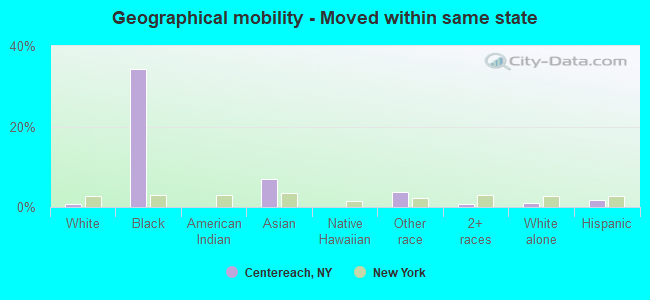
Geographical mobility in Centereach Same house 1 year ago 20,399 92.7% White (Caucasian)1,377 69.3% Black or African American126 100.0% American Indian / Alaska Native1,777 81.4% Asian6 89.7% Native Hawaiian / Pacific Islander1,785 94.3% Other race2,725 92.1% Two or more races19,551 93.4% White alone, not Hispanic / Latino4,870 88.2% Hispanic or LatinoMoved within same county 1,105 5.0% White / Caucasian49 2.5% Black or African American98 4.5% Asian2 0.1% Other race210 7.1% Two or more races870 4.2% White alone, not Hispanic / Latino557 10.1% Hispanic or LatinoMoved within same state 183 0.8% White / Caucasian683 34.3% Black or African American154 7.1% Asian71 3.7% Other race21 0.7% Two or more races192 0.9% White alone, not Hispanic / Latino91 1.6% Hispanic or LatinoMoved from different state 249 1.1% White / Caucasian11 0.6% Black or African American83 3.8% Asian263 1.3% White alone, not Hispanic / LatinoMoved from abroad 26 0.1% White45 2.3% Black or African American24 1.1% Asian5 0.3% Other race20 0.1% White alone, not Hispanic / Latino14 0.3% Hispanic or Latino
Children Nativity (place of birth) in Centereach
Children under 6 years - Living with two parents Both parents native 1,097 100.0% NativeBoth parents foreign-born 121 100.0% NativeOne native, one foreign-born parent 443 100.0% NativeChildren under 6 years - Living with one parent Native parent 88 100.0% NativeForeign-born parent 178 100.0% NativeChildren 6 to 17 years - Living with two parents Both parents native 2,733 99.6% Native11 0.4% Foreign-bornBoth parents foreign-born 449 85.8% Native74 14.2% Foreign-bornOne native, one foreign-born parent 358 100.0% NativeChildren 6 to 17 years - Living with one parent Native parent 699 100.0% NativeForeign-born parent 410 55.6% Native327 44.4% Foreign-born
Grandparents responsible for own grandchildren in Centereach
Grandparents (30 to 59 years) White / Caucasian 13 52.9% Responsible for grandchildren12 47.1% Not responsible for grandchildrenOther race 25 100.0% Not responsible for grandchildrenWhite alone, not Hispanic / Latino 13 100.0% Not responsible for grandchildrenHispanic or Latino 15 37.0% Responsible for grandchildren26 63.0% Not responsible for grandchildrenGrandparents (60 years and over) White / Caucasian 66 30.4% Responsible for grandchildren151 69.6% Not responsible for grandchildrenWhite alone, not Hispanic / Latino 80 34.8% Responsible for grandchildren150 65.2% Not responsible for grandchildrenHispanic or Latino 92 100.0% Not responsible for grandchildren