Races in Centerville, Ohio (OH) Detailed Stats
Data:
Races - White alone (%)
Races - White alone (% change since 2000)
Races - Black alone (%)
Races - Black alone (% change since 2000)
Races - American Indian alone (%)
Races - American Indian alone (% change since 2000)
Races - Asian alone (%)
Races - Asian alone (% change since 2000)
Races - Hispanic (%)
Races - Hispanic (% change since 2000)
Races - Native Hawaiian and Other Pacific Islander alone (%)
Races - Native Hawaiian and Other Pacific Islander alone (% change since 2000)
Races - Two or more races(%)
Races - Two or more races(% change since 2000)
Races - Other race alone (%)
Races - Other race alone (% change since 2000)
Racial diversity
Place of birth - Born in state of residence (%)
Place of birth - Born in state of residence (%) - White
Place of birth - Born in state of residence (%) - Black or African American
Place of birth - Born in state of residence (%) - Asian
Place of birth - Born in state of residence (%) - Hispanic or Latino
Place of birth - Born in state of residence (%) - American Indian and Alaska Native
Place of birth - Born in state of residence (%) - Multirace
Place of birth - Born in state of residence (%) - Other Race
Place of birth - Born in other state (%)
Place of birth - Born in other state (%) - White
Place of birth - Born in other state (%) - Black or African American
Place of birth - Born in other state (%) - Asian
Place of birth - Born in other state (%) - Hispanic or Latino
Place of birth - Born in other state (%) - American Indian and Alaska Native
Place of birth - Born in other state (%) - Multirace
Place of birth - Born in other state (%) - Other Race
Place of birth - Native, outside of US (%)
Place of birth - Native, outside of US (%) - White
Place of birth - Native, outside of US (%) - Black or African American
Place of birth - Native, outside of US (%) - Asian
Place of birth - Native, outside of US (%) - Hispanic or Latino
Place of birth - Native, outside of US (%) - American Indian and Alaska Native
Place of birth - Native, outside of US (%) - Multirace
Place of birth - Native, outside of US (%) - Other Race
Place of birth - Foreign born (%)
Place of birth - Foreign born (%) - White
Place of birth - Foreign born (%) - Black or African American
Place of birth - Foreign born (%) - Asian
Place of birth - Foreign born (%) - Hispanic or Latino
Place of birth - Foreign born (%) - American Indian and Alaska Native
Place of birth - Foreign born (%) - Multirace
Place of birth - Foreign born (%) - Other Race
Residents speaking English at home (%)
Residents speaking English at home - Born in the United States (%)
Residents speaking English at home - Native, born elsewhere (%)
Residents speaking English at home - Foreign born (%)
Residents speaking Spanish at home (%)
Residents speaking Spanish at home - Born in the United States (%)
Residents speaking Spanish at home - Native, born elsewhere (%)
Residents speaking Spanish at home - Foreign born (%)
Residents speaking other language at home (%)
Residents speaking other language at home - Born in the United States (%)
Residents speaking other language at home - Native, born elsewhere (%)
Residents speaking other language at home - Foreign born (%)
Marital status - Never married (%)
Marital status - Now married (%)
Marital status - Separated (%)
Marital status - Widowed (%)
Marital status - Divorced (%)
Ancestries Reported - Arab (%)
Ancestries Reported - Czech (%)
Ancestries Reported - Danish (%)
Ancestries Reported - Dutch (%)
Ancestries Reported - English (%)
Ancestries Reported - French (%)
Ancestries Reported - French Canadian (%)
Ancestries Reported - German (%)
Ancestries Reported - Greek (%)
Ancestries Reported - Hungarian (%)
Ancestries Reported - Irish (%)
Ancestries Reported - Italian (%)
Ancestries Reported - Lithuanian (%)
Ancestries Reported - Norwegian (%)
Ancestries Reported - Polish (%)
Ancestries Reported - Portuguese (%)
Ancestries Reported - Russian (%)
Ancestries Reported - Scotch-Irish (%)
Ancestries Reported - Scottish (%)
Ancestries Reported - Slovak (%)
Ancestries Reported - Subsaharan African (%)
Ancestries Reported - Swedish (%)
Ancestries Reported - Swiss (%)
Ancestries Reported - Ukrainian (%)
Ancestries Reported - United States (%)
Ancestries Reported - Welsh (%)
Ancestries Reported - West Indian (%)
Ancestries Reported - Other (%)
Geographical mobility - Same house 1 year ago (%)
Geographical mobility - Same house 1 year ago (%) - White
Geographical mobility - Same house 1 year ago (%) - Black or African American
Geographical mobility - Same house 1 year ago (%) - Asian
Geographical mobility - Same house 1 year ago (%) - Hispanic or Latino
Geographical mobility - Same house 1 year ago (%) - American Indian and Alaska Native
Geographical mobility - Same house 1 year ago (%) - Multirace
Geographical mobility - Same house 1 year ago (%) - Other Race
Geographical mobility - Moved within same county (%)
Geographical mobility - Moved within same county (%) - White
Geographical mobility - Moved within same county (%) - Black or African American
Geographical mobility - Moved within same county (%) - Asian
Geographical mobility - Moved within same county (%) - Hispanic or Latino
Geographical mobility - Moved within same county (%) - American Indian and Alaska Native
Geographical mobility - Moved within same county (%) - Multirace
Geographical mobility - Moved within same county (%) - Other Race
Geographical mobility - Moved from different county within same state (%)
Geographical mobility - Moved from different county within same state (%) - White
Geographical mobility - Moved from different county within same state (%) - Black or African American
Geographical mobility - Moved from different county within same state (%) - Asian
Geographical mobility - Moved from different county within same state (%) - Hispanic or Latino
Geographical mobility - Moved from different county within same state (%) - American Indian and Alaska Native
Geographical mobility - Moved from different county within same state (%) - Multirace
Geographical mobility - Moved from different county within same state (%) - Other Race
Geographical mobility - Moved from different state (%)
Geographical mobility - Moved from different state (%) - White
Geographical mobility - Moved from different state (%) - Black or African American
Geographical mobility - Moved from different state (%) - Asian
Geographical mobility - Moved from different state (%) - Hispanic or Latino
Geographical mobility - Moved from different state (%) - American Indian and Alaska Native
Geographical mobility - Moved from different state (%) - Multirace
Geographical mobility - Moved from different state (%) - Other Race
Geographical mobility - Moved from abroad (%)
Geographical mobility - Moved from abroad (%) - White
Geographical mobility - Moved from abroad (%) - Black or African American
Geographical mobility - Moved from abroad (%) - Asian
Geographical mobility - Moved from abroad (%) - Hispanic or Latino
Geographical mobility - Moved from abroad (%) - American Indian and Alaska Native
Geographical mobility - Moved from abroad (%) - Multirace
Geographical mobility - Moved from abroad (%) - Other Race
Place of birth for the foreign-born population - Ireland (%)
Place of birth for the foreign-born population - Denmark (%)
Place of birth for the foreign-born population - Norway (%)
Place of birth for the foreign-born population - Sweden (%)
Place of birth for the foreign-born population - United Kingdom (%)
Place of birth for the foreign-born population - England (%)
Place of birth for the foreign-born population - Scotland (%)
Place of birth for the foreign-born population - Other Northern Europe (%)
Place of birth for the foreign-born population - Austria (%)
Place of birth for the foreign-born population - Belgium (%)
Place of birth for the foreign-born population - France (%)
Place of birth for the foreign-born population - Germany (%)
Place of birth for the foreign-born population - Netherlands (%)
Place of birth for the foreign-born population - Switzerland (%)
Place of birth for the foreign-born population - Other Western Europe (%)
Place of birth for the foreign-born population - Greece (%)
Place of birth for the foreign-born population - Italy (%)
Place of birth for the foreign-born population - Portugal (%)
Place of birth for the foreign-born population - Spain (%)
Place of birth for the foreign-born population - Other Southern Europe (%)
Place of birth for the foreign-born population - Albania (%)
Place of birth for the foreign-born population - Belarus (%)
Place of birth for the foreign-born population - Bosnia and Herzegovina (%)
Place of birth for the foreign-born population - Bulgaria (%)
Place of birth for the foreign-born population - Croatia (%)
Place of birth for the foreign-born population - Czechoslovakia (%)
Place of birth for the foreign-born population - Hungary (%)
Place of birth for the foreign-born population - Latvia (%)
Place of birth for the foreign-born population - Lithuania (%)
Place of birth for the foreign-born population - North Macedonia (Macedonia) (%)
Place of birth for the foreign-born population - Moldova (%)
Place of birth for the foreign-born population - Poland (%)
Place of birth for the foreign-born population - Romania (%)
Place of birth for the foreign-born population - Russia (%)
Place of birth for the foreign-born population - Serbia (%)
Place of birth for the foreign-born population - Ukraine (%)
Place of birth for the foreign-born population - Other Eastern Europe (%)
Place of birth for the foreign-born population - China (%)
Place of birth for the foreign-born population - Hong Kong (%)
Place of birth for the foreign-born population - Taiwan (%)
Place of birth for the foreign-born population - Japan (%)
Place of birth for the foreign-born population - Korea (%)
Place of birth for the foreign-born population - Other Eastern Asia (%)
Place of birth for the foreign-born population - Afghanistan (%)
Place of birth for the foreign-born population - Bangladesh (%)
Place of birth for the foreign-born population - India (%)
Place of birth for the foreign-born population - Iran (%)
Place of birth for the foreign-born population - Kazakhstan (%)
Place of birth for the foreign-born population - Nepal (%)
Place of birth for the foreign-born population - Pakistan (%)
Place of birth for the foreign-born population - Sri Lanka (%)
Place of birth for the foreign-born population - Uzbekistan (%)
Place of birth for the foreign-born population - Other South Central Asia (%)
Place of birth for the foreign-born population - Burma (%)
Place of birth for the foreign-born population - Cambodia (%)
Place of birth for the foreign-born population - Indonesia (%)
Place of birth for the foreign-born population - Laos (%)
Place of birth for the foreign-born population - Malaysia (%)
Place of birth for the foreign-born population - Philippines (%)
Place of birth for the foreign-born population - Singapore (%)
Place of birth for the foreign-born population - Thailand (%)
Place of birth for the foreign-born population - Vietnam (%)
Place of birth for the foreign-born population - Other South Eastern Asia (%)
Place of birth for the foreign-born population - Armenia (%)
Place of birth for the foreign-born population - Iraq (%)
Place of birth for the foreign-born population - Israel (%)
Place of birth for the foreign-born population - Jordan (%)
Place of birth for the foreign-born population - Kuwait (%)
Place of birth for the foreign-born population - Lebanon (%)
Place of birth for the foreign-born population - Saudi Arabia (%)
Place of birth for the foreign-born population - Syria (%)
Place of birth for the foreign-born population - Turkey (%)
Place of birth for the foreign-born population - Yemen (%)
Place of birth for the foreign-born population - Other Western Asia (%)
Place of birth for the foreign-born population - Eritrea (%)
Place of birth for the foreign-born population - Ethiopia (%)
Place of birth for the foreign-born population - Kenya (%)
Place of birth for the foreign-born population - Somalia (%)
Place of birth for the foreign-born population - Uganda (%)
Place of birth for the foreign-born population - Zimbabwe (%)
Place of birth for the foreign-born population - Other Eastern Africa (%)
Place of birth for the foreign-born population - Cameroon (%)
Place of birth for the foreign-born population - Congo (%)
Place of birth for the foreign-born population - Democratic Republic of Congo (Zaire) (%)
Place of birth for the foreign-born population - Other Middle Africa (%)
Place of birth for the foreign-born population - Egypt (%)
Place of birth for the foreign-born population - Morocco (%)
Place of birth for the foreign-born population - Sudan (%)
Place of birth for the foreign-born population - Other Northern Africa (%)
Place of birth for the foreign-born population - South Africa (%)
Place of birth for the foreign-born population - Other Southern Africa (%)
Place of birth for the foreign-born population - Cabo Verde (%)
Place of birth for the foreign-born population - Ghana (%)
Place of birth for the foreign-born population - Liberia (%)
Place of birth for the foreign-born population - Nigeria (%)
Place of birth for the foreign-born population - Senegal (%)
Place of birth for the foreign-born population - Sierra Leone (%)
Place of birth for the foreign-born population - Other Western Africa (%)
Place of birth for the foreign-born population - Australia (%)
Place of birth for the foreign-born population - New Zealand (%)
Place of birth for the foreign-born population - Fiji (%)
Place of birth for the foreign-born population - Micronesia (%)
Place of birth for the foreign-born population - Bahamas (%)
Place of birth for the foreign-born population - Barbados (%)
Place of birth for the foreign-born population - Cuba (%)
Place of birth for the foreign-born population - Dominica (%)
Place of birth for the foreign-born population - Dominican Republic (%)
Place of birth for the foreign-born population - Grenada (%)
Place of birth for the foreign-born population - Haiti (%)
Place of birth for the foreign-born population - Jamaica (%)
Place of birth for the foreign-born population - St. Vincent and the Grenadines (%)
Place of birth for the foreign-born population - Trinidad and Tobago (%)
Place of birth for the foreign-born population - West Indies (%)
Place of birth for the foreign-born population - Other Caribbean (%)
Place of birth for the foreign-born population - Belize (%)
Place of birth for the foreign-born population - Costa Rica (%)
Place of birth for the foreign-born population - El Salvador (%)
Place of birth for the foreign-born population - Guatemala (%)
Place of birth for the foreign-born population - Honduras (%)
Place of birth for the foreign-born population - Mexico (%)
Place of birth for the foreign-born population - Nicaragua (%)
Place of birth for the foreign-born population - Panama (%)
Place of birth for the foreign-born population - Other Central America (%)
Place of birth for the foreign-born population - Argentina (%)
Place of birth for the foreign-born population - Bolivia (%)
Place of birth for the foreign-born population - Brazil (%)
Place of birth for the foreign-born population - Chile (%)
Place of birth for the foreign-born population - Colombia (%)
Place of birth for the foreign-born population - Ecuador (%)
Place of birth for the foreign-born population - Guyana (%)
Place of birth for the foreign-born population - Peru (%)
Place of birth for the foreign-born population - Uruguay (%)
Place of birth for the foreign-born population - Venezuela (%)
Place of birth for the foreign-born population - Other South America (%)
Place of birth for the foreign-born population - Canada (%)
Place of birth for the foreign-born population - Other Northern America (%)
Place of birth for the foreign-born population - Other (%)
Latest news about races in Centerville, OH collected exclusively by city-data.com from local newspapers, TV, and radio stations
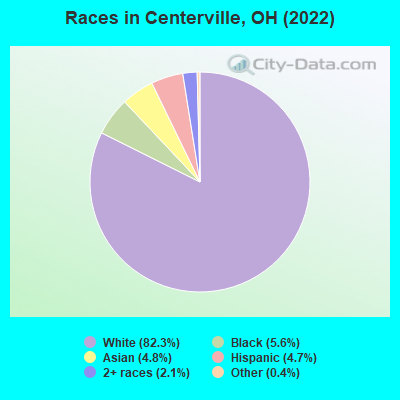
According to 2022 data, the most numerous races in Centerville, OH are White alone (20,086 residents), Black alone (1,365 residents), and Two or more races (513 residents). 89.2% of Centerville residents speak English at home. 8.6% of Centerville, OH residents are foreign-born (3.8% born in Asia, 1.8% born in Europe, 1.4% born in Africa), which is 53.5% greater than the foreign-born rate of 4.0% across the entire state of Ohio.
Race distribution in Centerville
2000 2022
9,538,111 84.0% White alone 1,290,662 11.4% Black alone 217,123 1.9% Hispanic 137,770 1.2% Two or more races 131,670 1.2% Asian alone 21,985 0.2% American Indian alone 13,483 0.1% Other race alone 2,336 0.02% Native Hawaiian and Other
8,948,793 76.1% White alone 1,401,403 11.9% Black alone 529,291 4.5% Two or more races 517,232 4.4% Hispanic 293,387 2.5% Asian alone 52,805 0.4% Other race alone 9,785 0.08% American Indian alone 3,362 0.03% Native Hawaiian and Other
Income and house value in Centerville Median household income in 2022 $84,413 White non-Hispanic householders$91,533 Asian householders$20,738 Some other race householders$37,087 Hispanic or Latino race householdersMedian 2022 house value $286,356 White Non-Hispanic householders$245,090 Black or African American householders $321,451 Asian householders$313,352 Native Hawaiian and other Pacific Islander householders$163,907 Two or more races householders$236,991 Hispanic or Latino householders
Median age by race in Centerville
53.7 Median age for White residents47.0 57.6 27.1 Median age for Black or African American residents24.3 33.2 -1,349,593,494.6 Median age for American Indian / Alaska Native residents-685,185,184.5 -1,438,172,041.6 46.1 Median age for Asian residents39.9 46.1 -800,387,596.1 Median age for Native Hawaiian / Pacific Islander residents-750,242,953.6 -805,394,989.6 31.2 Median age for Other race residents56.0 24.0 22.6 Median age for Two or more races residents19.7 35.6 54.0 Median age for White alone residents48.1 57.4 25.8 Median age for Hispanic or Latino residents17.5 25.9
Owner/renter occupied households by race in Centerville
House owners and renters - White residents 7,665 74.5% Owner occupied2,624 25.5% Renter occupiedHouse owners and renters - Black or African American residents 126 22.1% Owner occupied442 77.9% Renter occupiedHouse owners and renters - American Indian / Alaska Native residents 17 100.0% Renter occupiedHouse owners and renters - Asian residents 241 65.1% Owner occupied129 34.9% Renter occupiedHouse owners and renters - Other race residents 52 13.6% Owner occupied328 86.4% Renter occupiedHouse owners and renters - Two or more races residents 191 57.2% Owner occupied144 42.8% Renter occupiedHouse owners and renters - White alone residents 7,564 74.0% Owner occupied2,659 26.0% Renter occupiedHouse owners and renters - Hispanic or Latino residents 194 40.3% Owner occupied287 59.7% Renter occupied
Language usage in Centerville
English speakers - Total 89.2% of residents of Centerville speak English at home.
2.8% of residents speak Spanish at home 341 52.9% Speak English very well304 47.1% Speak English less than very well8.5% of residents speak other language at home 1,571 79.7% Speak English very well399 20.3% Speak English less than very well
English speakers - Born in the United States 97.7% of residents of Centerville speak English at home.
0.5% of residents speak Spanish at home 33 100.0% Speak English very well1.9% of residents speak other language at home 136 100.0% Speak English very well
English speakers - Native, born elsewhere 59.7% of residents of Centerville speak English at home.
24.8% of residents speak Spanish at home 78 100.0% Speak English very well15.2% of residents speak other language at home 48 100.0% Speak English very well
English speakers - Foreign-born 30.6% of residents of Centerville speak English at home.
12.0% of residents speak Spanish at home 228 95.8% Speak English very well10 4.2% Speak English less than very well61.2% of residents speak other language at home 821 67.5% Speak English very well396 32.5% Speak English less than very well
White (Caucasian) - Speak only English Native:
98.6% (18,074)Foreign-born:
36.3% (302)
White (Caucasian) - Speak another language Native:
1.3% (245)Foreign-born:
63.6% (530)
Black or African American - Speak only English Native:
87.4% (866)Foreign-born:
98.8% (190)
Black or African American - Speak another language Native:
12.1% (120)Foreign-born:
34.6% (66)
Asian - Speak only English Native:
16.5% (66)Foreign-born:
14.5% (109)
Asian - Speak another language Native:
100.0% (401)Foreign-born:
84.8% (637)
Other race - Speak another language Native:
60.2% (244)Foreign-born:
100.0% (9)
Two or more races - Speak another language Native:
33.5% (282)Foreign-born:
100.0% (221)
White alone - Speak only English Native:
98.4% (17,842)Foreign-born:
34.3% (299)
White alone - Speak another language Native:
1.5% (274)Foreign-born:
65.7% (572)
Hispanic or Latino - Speak only English Native:
54.5% (536)Foreign-born:
13.9% (23)
Hispanic or Latino - Speak another language Native:
44.6% (439)Foreign-born:
86.2% (146)
Foreign-born residents in Centerville 2,099 residents are foreign born (3.8% Asia , 1.8% Europe , 1.4% Africa ).
Marital status for residents in Centerville Marital status - White (Caucasian) population 15 years and over
Males 26.4% Never married60.1% Now married1.3% Separated3.7% Widowed8.7% DivorcedFemales 15.4% Never married51.6% Now married0.7% Separated17.7% Widowed14.7% DivorcedWomen who gave birth in the past 12 months Now married:
100.0% (176)Unmarried:
0.0% (0)
Women who did not give birth in the past 12 months Now married:
54.2% (1,668)Unmarried:
45.8% (1,407)
Marital status - Black or African American population 15 years and over
Males 79.1% Never married10.4% Now married9.8% Separated0.6% Widowed0.0% DivorcedFemales 46.7% Never married27.8% Now married0.0% Separated5.4% Widowed20.1% DivorcedWomen who gave birth in the past 12 months Now married:
100.0% (34)Unmarried:
0.0% (0)
Women who did not give birth in the past 12 months Now married:
17.1% (47)Unmarried:
82.9% (230)
Marital status - Asian population 15 years and over
Males 37.1% Never married62.9% Now married0.0% Separated0.0% Widowed0.0% DivorcedFemales 26.9% Never married62.4% Now married0.0% Separated3.8% Widowed7.0% DivorcedWomen who did not give birth in the past 12 months Now married:
46.8% (139)Unmarried:
53.2% (158)
Marital status - Other race population 15 years and over
Males 44.3% Never married55.7% Now married0.0% Separated0.0% Widowed0.0% DivorcedFemales 21.2% Never married1.1% Now married0.0% Separated6.1% Widowed71.6% DivorcedWomen who gave birth in the past 12 months Now married:
0.0% (0)Unmarried:
100.0% (227)
Women who did not give birth in the past 12 months Now married:
5.9% (4)Unmarried:
94.1% (64)
Marital status - Two or more races population 15 years and over
Males 29.7% Never married60.3% Now married4.1% Separated0.0% Widowed5.9% DivorcedFemales 56.2% Never married32.7% Now married0.0% Separated2.5% Widowed8.5% DivorcedWomen who did not give birth in the past 12 months Now married:
24.9% (110)Unmarried:
75.1% (332)
Marital status - White alone, not Hispanic / Latino population 15 years and over
Males 26.0% Never married60.2% Now married1.3% Separated3.7% Widowed8.8% DivorcedFemales 15.0% Never married51.7% Now married0.7% Separated17.8% Widowed14.8% DivorcedWomen who gave birth in the past 12 months Now married:
100.0% (178)Unmarried:
0.0% (0)
Women who did not give birth in the past 12 months Now married:
54.7% (1,665)Unmarried:
45.3% (1,381)
Marital status - Hispanic or Latino population 15 years and over
Males 49.8% Never married46.9% Now married3.3% Separated0.0% Widowed0.0% DivorcedFemales 43.2% Never married17.7% Now married0.0% Separated3.6% Widowed35.5% DivorcedWomen who gave birth in the past 12 months Now married:
0.0% (0)Unmarried:
100.0% (184)
Women who did not give birth in the past 12 months Now married:
23.1% (69)Unmarried:
76.9% (230)
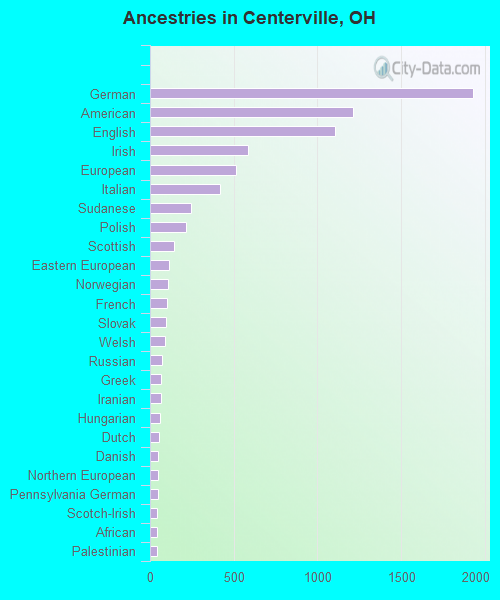
Ancestries in Centerville
1,929 18.9% German1,213 11.9% American1,106 10.8% English585 5.7% Irish511 5.0% European421 4.1% Italian243 2.4% Sudanese214 2.1% Polish143 1.4% Scottish113 1.1% Eastern European110 1.1% Norwegian99 1.0% French95 0.9% Slovak90 0.9% Welsh70 0.7% Russian65 0.6% Greek63 0.6% Iranian61 0.6% Hungarian54 0.5% Dutch50 0.5% Danish46 0.4% Northern European45 0.4% Pennsylvania German44 0.4% Scotch-Irish44 0.4% African42 0.4% Palestinian41 0.4% Iraqi40 0.4% British39 0.4% French Canadian34 0.3% Bulgarian29 0.3% Ukrainian26 0.3% Swedish24 0.2% Lebanese24 0.2% Scandinavian18 0.2% Lithuanian16 0.2% Czechoslovakian15 0.1% Belgian13 0.1% Czech9 0.09% Romanian8 0.08% Austrian8 0.08% Slovene
Geographical mobility in Centerville Same house 1 year ago 17,265 85.6% White (Caucasian)1,140 82.6% Black or African American16 100.0% American Indian / Alaska Native1,060 90.1% Asian20 100.0% Native Hawaiian / Pacific Islander348 86.5% Other race1,047 93.9% Two or more races17,139 85.8% White alone, not Hispanic / Latino1,012 87.8% Hispanic or LatinoMoved within same county 1,112 5.5% White / Caucasian125 9.1% Black or African American14 3.5% Other race1,112 5.6% White alone, not Hispanic / Latino11 0.9% Hispanic or LatinoMoved within same state 809 4.0% White / Caucasian71 5.1% Black or African American44 11.0% Other race29 2.6% Two or more races781 3.9% White alone, not Hispanic / Latino140 12.2% Hispanic or LatinoMoved from different state 1,106 5.5% White / Caucasian33 2.4% Black or African American58 4.9% Asian60 5.4% Two or more races1,047 5.2% White alone, not Hispanic / Latino88 7.7% Hispanic or LatinoMoved from abroad 28 0.1% White30 0.1% White alone, not Hispanic / Latino
Children Nativity (place of birth) in Centerville
Children under 6 years - Living with two parents Both parents native 896 100.0% NativeBoth parents foreign-born 149 100.0% NativeOne native, one foreign-born parent 22 100.0% NativeChildren under 6 years - Living with one parent Native parent 311 100.0% NativeForeign-born parent 31 100.0% NativeChildren 6 to 17 years - Living with two parents Both parents native 1,904 97.4% Native51 2.6% Foreign-bornBoth parents foreign-born 258 90.3% Native28 9.7% Foreign-bornOne native, one foreign-born parent 230 100.0% NativeChildren 6 to 17 years - Living with one parent Native parent 577 97.3% Native16 2.7% Foreign-bornForeign-born parent 13 100.0% Native
Grandparents responsible for own grandchildren in Centerville
Grandparents (30 to 59 years) White / Caucasian 94 100.0% Not responsible for grandchildrenBlack or African American 61 100.0% Not responsible for grandchildrenWhite alone, not Hispanic / Latino 95 100.0% Not responsible for grandchildrenGrandparents (60 years and over) White / Caucasian 24 42.2% Responsible for grandchildren33 57.8% Not responsible for grandchildrenWhite alone, not Hispanic / Latino 24 41.7% Responsible for grandchildren33 58.3% Not responsible for grandchildren