Races in Centerville, Utah (UT) Detailed Stats
Data:
Races - White alone (%)
Races - White alone (% change since 2000)
Races - Black alone (%)
Races - Black alone (% change since 2000)
Races - American Indian alone (%)
Races - American Indian alone (% change since 2000)
Races - Asian alone (%)
Races - Asian alone (% change since 2000)
Races - Hispanic (%)
Races - Hispanic (% change since 2000)
Races - Native Hawaiian and Other Pacific Islander alone (%)
Races - Native Hawaiian and Other Pacific Islander alone (% change since 2000)
Races - Two or more races(%)
Races - Two or more races(% change since 2000)
Races - Other race alone (%)
Races - Other race alone (% change since 2000)
Racial diversity
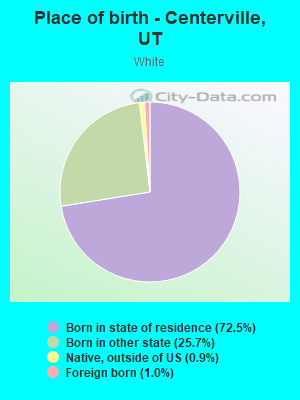
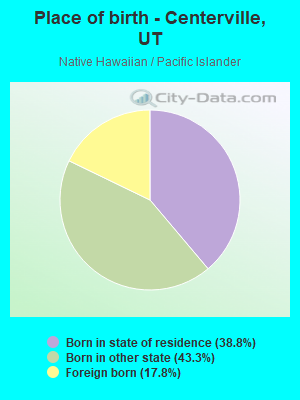
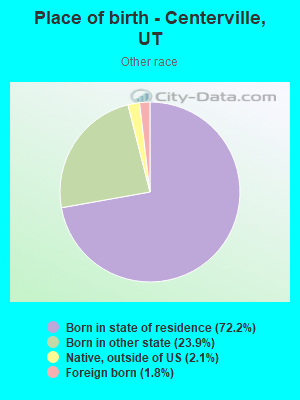
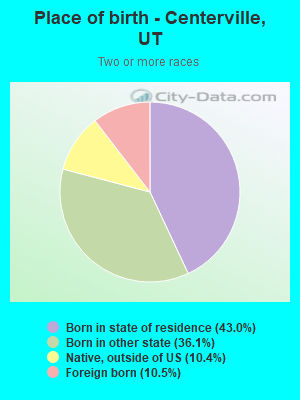
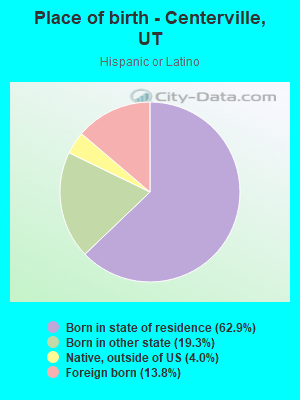
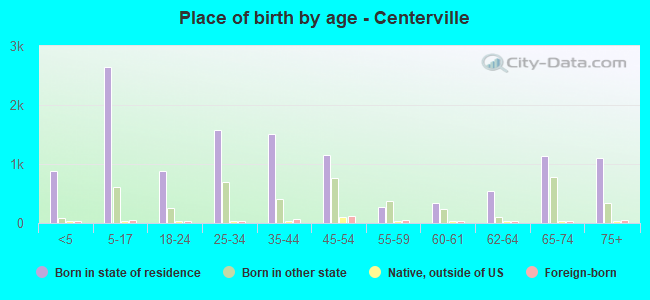
Place of birth - Born in state of residence (%)
Place of birth - Born in state of residence (%) - White
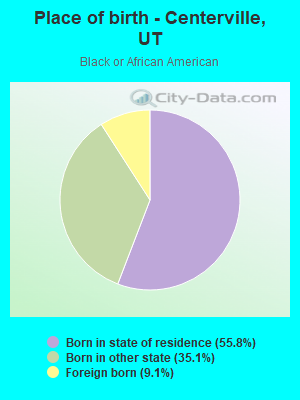
Place of birth - Born in state of residence (%) - Black or African American
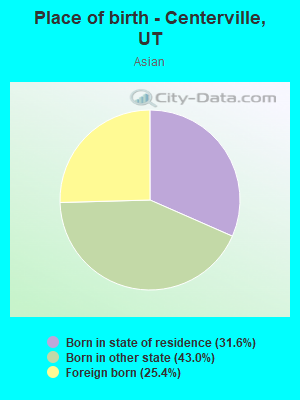
Place of birth - Born in state of residence (%) - Asian
Place of birth - Born in state of residence (%) - Hispanic or Latino
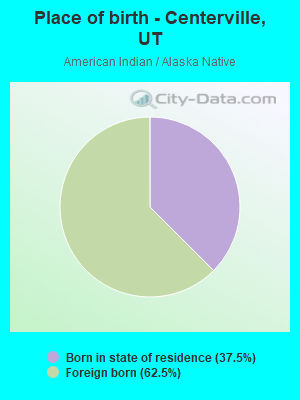
Place of birth - Born in state of residence (%) - American Indian and Alaska Native
Place of birth - Born in state of residence (%) - Multirace
Place of birth - Born in state of residence (%) - Other Race
Place of birth - Born in other state (%)
Place of birth - Born in other state (%) - White
Place of birth - Born in other state (%) - Black or African American
Place of birth - Born in other state (%) - Asian
Place of birth - Born in other state (%) - Hispanic or Latino
Place of birth - Born in other state (%) - American Indian and Alaska Native
Place of birth - Born in other state (%) - Multirace
Place of birth - Born in other state (%) - Other Race
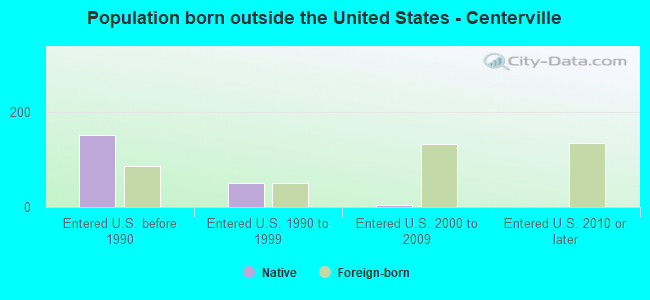
Place of birth - Native, outside of US (%)
Place of birth - Native, outside of US (%) - White
Place of birth - Native, outside of US (%) - Black or African American
Place of birth - Native, outside of US (%) - Asian
Place of birth - Native, outside of US (%) - Hispanic or Latino
Place of birth - Native, outside of US (%) - American Indian and Alaska Native
Place of birth - Native, outside of US (%) - Multirace
Place of birth - Native, outside of US (%) - Other Race
Place of birth - Foreign born (%)
Place of birth - Foreign born (%) - White
Place of birth - Foreign born (%) - Black or African American
Place of birth - Foreign born (%) - Asian
Place of birth - Foreign born (%) - Hispanic or Latino
Place of birth - Foreign born (%) - American Indian and Alaska Native
Place of birth - Foreign born (%) - Multirace
Place of birth - Foreign born (%) - Other Race
Residents speaking English at home (%)
Residents speaking English at home - Born in the United States (%)
Residents speaking English at home - Native, born elsewhere (%)
Residents speaking English at home - Foreign born (%)
Residents speaking Spanish at home (%)
Residents speaking Spanish at home - Born in the United States (%)
Residents speaking Spanish at home - Native, born elsewhere (%)
Residents speaking Spanish at home - Foreign born (%)
Residents speaking other language at home (%)
Residents speaking other language at home - Born in the United States (%)
Residents speaking other language at home - Native, born elsewhere (%)
Residents speaking other language at home - Foreign born (%)
Marital status - Never married (%)
Marital status - Now married (%)
Marital status - Separated (%)
Marital status - Widowed (%)
Marital status - Divorced (%)
Ancestries Reported - Arab (%)
Ancestries Reported - Czech (%)
Ancestries Reported - Danish (%)
Ancestries Reported - Dutch (%)
Ancestries Reported - English (%)
Ancestries Reported - French (%)
Ancestries Reported - French Canadian (%)
Ancestries Reported - German (%)
Ancestries Reported - Greek (%)
Ancestries Reported - Hungarian (%)
Ancestries Reported - Irish (%)
Ancestries Reported - Italian (%)
Ancestries Reported - Lithuanian (%)
Ancestries Reported - Norwegian (%)
Ancestries Reported - Polish (%)
Ancestries Reported - Portuguese (%)
Ancestries Reported - Russian (%)
Ancestries Reported - Scotch-Irish (%)
Ancestries Reported - Scottish (%)
Ancestries Reported - Slovak (%)
Ancestries Reported - Subsaharan African (%)
Ancestries Reported - Swedish (%)
Ancestries Reported - Swiss (%)
Ancestries Reported - Ukrainian (%)
Ancestries Reported - United States (%)
Ancestries Reported - Welsh (%)
Ancestries Reported - West Indian (%)
Ancestries Reported - Other (%)
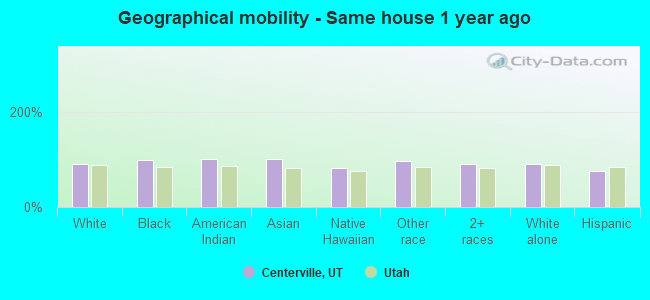
Geographical mobility - Same house 1 year ago (%)
Geographical mobility - Same house 1 year ago (%) - White
Geographical mobility - Same house 1 year ago (%) - Black or African American
Geographical mobility - Same house 1 year ago (%) - Asian
Geographical mobility - Same house 1 year ago (%) - Hispanic or Latino
Geographical mobility - Same house 1 year ago (%) - American Indian and Alaska Native
Geographical mobility - Same house 1 year ago (%) - Multirace
Geographical mobility - Same house 1 year ago (%) - Other Race
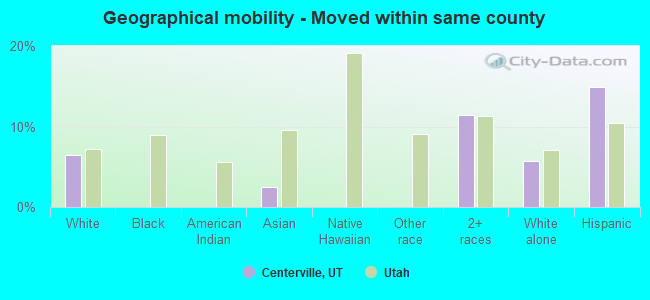
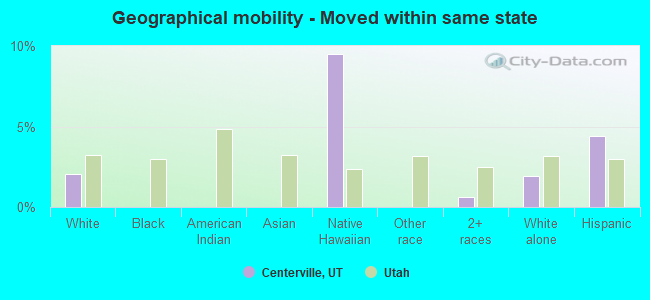
Geographical mobility - Moved within same county (%)
Geographical mobility - Moved within same county (%) - White
Geographical mobility - Moved within same county (%) - Black or African American
Geographical mobility - Moved within same county (%) - Asian
Geographical mobility - Moved within same county (%) - Hispanic or Latino
Geographical mobility - Moved within same county (%) - American Indian and Alaska Native
Geographical mobility - Moved within same county (%) - Multirace
Geographical mobility - Moved within same county (%) - Other Race
Geographical mobility - Moved from different county within same state (%)
Geographical mobility - Moved from different county within same state (%) - White
Geographical mobility - Moved from different county within same state (%) - Black or African American
Geographical mobility - Moved from different county within same state (%) - Asian
Geographical mobility - Moved from different county within same state (%) - Hispanic or Latino
Geographical mobility - Moved from different county within same state (%) - American Indian and Alaska Native
Geographical mobility - Moved from different county within same state (%) - Multirace
Geographical mobility - Moved from different county within same state (%) - Other Race
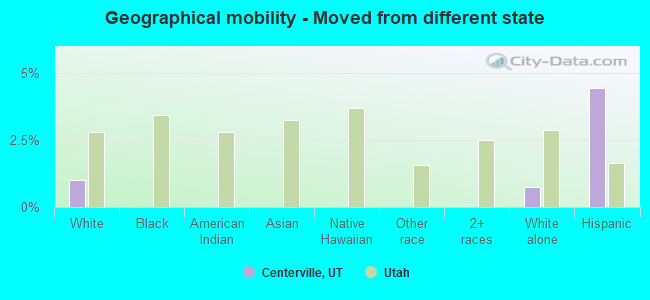
Geographical mobility - Moved from different state (%)
Geographical mobility - Moved from different state (%) - White
Geographical mobility - Moved from different state (%) - Black or African American
Geographical mobility - Moved from different state (%) - Asian
Geographical mobility - Moved from different state (%) - Hispanic or Latino
Geographical mobility - Moved from different state (%) - American Indian and Alaska Native
Geographical mobility - Moved from different state (%) - Multirace
Geographical mobility - Moved from different state (%) - Other Race
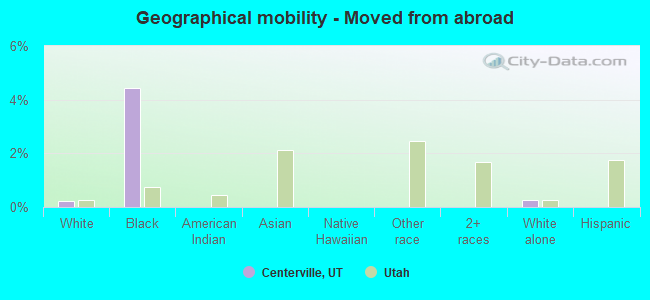
Geographical mobility - Moved from abroad (%)
Geographical mobility - Moved from abroad (%) - White
Geographical mobility - Moved from abroad (%) - Black or African American
Geographical mobility - Moved from abroad (%) - Asian
Geographical mobility - Moved from abroad (%) - Hispanic or Latino
Geographical mobility - Moved from abroad (%) - American Indian and Alaska Native
Geographical mobility - Moved from abroad (%) - Multirace
Geographical mobility - Moved from abroad (%) - Other Race
Place of birth for the foreign-born population - Ireland (%)
Place of birth for the foreign-born population - Denmark (%)
Place of birth for the foreign-born population - Norway (%)
Place of birth for the foreign-born population - Sweden (%)
Place of birth for the foreign-born population - United Kingdom (%)
Place of birth for the foreign-born population - England (%)
Place of birth for the foreign-born population - Scotland (%)
Place of birth for the foreign-born population - Other Northern Europe (%)
Place of birth for the foreign-born population - Austria (%)
Place of birth for the foreign-born population - Belgium (%)
Place of birth for the foreign-born population - France (%)
Place of birth for the foreign-born population - Germany (%)
Place of birth for the foreign-born population - Netherlands (%)
Place of birth for the foreign-born population - Switzerland (%)
Place of birth for the foreign-born population - Other Western Europe (%)
Place of birth for the foreign-born population - Greece (%)
Place of birth for the foreign-born population - Italy (%)
Place of birth for the foreign-born population - Portugal (%)
Place of birth for the foreign-born population - Spain (%)
Place of birth for the foreign-born population - Other Southern Europe (%)
Place of birth for the foreign-born population - Albania (%)
Place of birth for the foreign-born population - Belarus (%)
Place of birth for the foreign-born population - Bosnia and Herzegovina (%)
Place of birth for the foreign-born population - Bulgaria (%)
Place of birth for the foreign-born population - Croatia (%)
Place of birth for the foreign-born population - Czechoslovakia (%)
Place of birth for the foreign-born population - Hungary (%)
Place of birth for the foreign-born population - Latvia (%)
Place of birth for the foreign-born population - Lithuania (%)
Place of birth for the foreign-born population - North Macedonia (Macedonia) (%)
Place of birth for the foreign-born population - Moldova (%)
Place of birth for the foreign-born population - Poland (%)
Place of birth for the foreign-born population - Romania (%)
Place of birth for the foreign-born population - Russia (%)
Place of birth for the foreign-born population - Serbia (%)
Place of birth for the foreign-born population - Ukraine (%)
Place of birth for the foreign-born population - Other Eastern Europe (%)
Place of birth for the foreign-born population - China (%)
Place of birth for the foreign-born population - Hong Kong (%)
Place of birth for the foreign-born population - Taiwan (%)
Place of birth for the foreign-born population - Japan (%)
Place of birth for the foreign-born population - Korea (%)
Place of birth for the foreign-born population - Other Eastern Asia (%)
Place of birth for the foreign-born population - Afghanistan (%)
Place of birth for the foreign-born population - Bangladesh (%)
Place of birth for the foreign-born population - India (%)
Place of birth for the foreign-born population - Iran (%)
Place of birth for the foreign-born population - Kazakhstan (%)
Place of birth for the foreign-born population - Nepal (%)
Place of birth for the foreign-born population - Pakistan (%)
Place of birth for the foreign-born population - Sri Lanka (%)
Place of birth for the foreign-born population - Uzbekistan (%)
Place of birth for the foreign-born population - Other South Central Asia (%)
Place of birth for the foreign-born population - Burma (%)
Place of birth for the foreign-born population - Cambodia (%)
Place of birth for the foreign-born population - Indonesia (%)
Place of birth for the foreign-born population - Laos (%)
Place of birth for the foreign-born population - Malaysia (%)
Place of birth for the foreign-born population - Philippines (%)
Place of birth for the foreign-born population - Singapore (%)
Place of birth for the foreign-born population - Thailand (%)
Place of birth for the foreign-born population - Vietnam (%)
Place of birth for the foreign-born population - Other South Eastern Asia (%)
Place of birth for the foreign-born population - Armenia (%)
Place of birth for the foreign-born population - Iraq (%)
Place of birth for the foreign-born population - Israel (%)
Place of birth for the foreign-born population - Jordan (%)
Place of birth for the foreign-born population - Kuwait (%)
Place of birth for the foreign-born population - Lebanon (%)
Place of birth for the foreign-born population - Saudi Arabia (%)
Place of birth for the foreign-born population - Syria (%)
Place of birth for the foreign-born population - Turkey (%)
Place of birth for the foreign-born population - Yemen (%)
Place of birth for the foreign-born population - Other Western Asia (%)
Place of birth for the foreign-born population - Eritrea (%)
Place of birth for the foreign-born population - Ethiopia (%)
Place of birth for the foreign-born population - Kenya (%)
Place of birth for the foreign-born population - Somalia (%)
Place of birth for the foreign-born population - Uganda (%)
Place of birth for the foreign-born population - Zimbabwe (%)
Place of birth for the foreign-born population - Other Eastern Africa (%)
Place of birth for the foreign-born population - Cameroon (%)
Place of birth for the foreign-born population - Congo (%)
Place of birth for the foreign-born population - Democratic Republic of Congo (Zaire) (%)
Place of birth for the foreign-born population - Other Middle Africa (%)
Place of birth for the foreign-born population - Egypt (%)
Place of birth for the foreign-born population - Morocco (%)
Place of birth for the foreign-born population - Sudan (%)
Place of birth for the foreign-born population - Other Northern Africa (%)
Place of birth for the foreign-born population - South Africa (%)
Place of birth for the foreign-born population - Other Southern Africa (%)
Place of birth for the foreign-born population - Cabo Verde (%)
Place of birth for the foreign-born population - Ghana (%)
Place of birth for the foreign-born population - Liberia (%)
Place of birth for the foreign-born population - Nigeria (%)
Place of birth for the foreign-born population - Senegal (%)
Place of birth for the foreign-born population - Sierra Leone (%)
Place of birth for the foreign-born population - Other Western Africa (%)
Place of birth for the foreign-born population - Australia (%)
Place of birth for the foreign-born population - New Zealand (%)
Place of birth for the foreign-born population - Fiji (%)
Place of birth for the foreign-born population - Micronesia (%)
Place of birth for the foreign-born population - Bahamas (%)
Place of birth for the foreign-born population - Barbados (%)
Place of birth for the foreign-born population - Cuba (%)
Place of birth for the foreign-born population - Dominica (%)
Place of birth for the foreign-born population - Dominican Republic (%)
Place of birth for the foreign-born population - Grenada (%)
Place of birth for the foreign-born population - Haiti (%)
Place of birth for the foreign-born population - Jamaica (%)
Place of birth for the foreign-born population - St. Vincent and the Grenadines (%)
Place of birth for the foreign-born population - Trinidad and Tobago (%)
Place of birth for the foreign-born population - West Indies (%)
Place of birth for the foreign-born population - Other Caribbean (%)
Place of birth for the foreign-born population - Belize (%)
Place of birth for the foreign-born population - Costa Rica (%)
Place of birth for the foreign-born population - El Salvador (%)
Place of birth for the foreign-born population - Guatemala (%)
Place of birth for the foreign-born population - Honduras (%)
Place of birth for the foreign-born population - Mexico (%)
Place of birth for the foreign-born population - Nicaragua (%)
Place of birth for the foreign-born population - Panama (%)
Place of birth for the foreign-born population - Other Central America (%)
Place of birth for the foreign-born population - Argentina (%)
Place of birth for the foreign-born population - Bolivia (%)
Place of birth for the foreign-born population - Brazil (%)
Place of birth for the foreign-born population - Chile (%)
Place of birth for the foreign-born population - Colombia (%)
Place of birth for the foreign-born population - Ecuador (%)
Place of birth for the foreign-born population - Guyana (%)
Place of birth for the foreign-born population - Peru (%)
Place of birth for the foreign-born population - Uruguay (%)
Place of birth for the foreign-born population - Venezuela (%)
Place of birth for the foreign-born population - Other South America (%)
Place of birth for the foreign-born population - Canada (%)
Place of birth for the foreign-born population - Other Northern America (%)
Place of birth for the foreign-born population - Other (%)
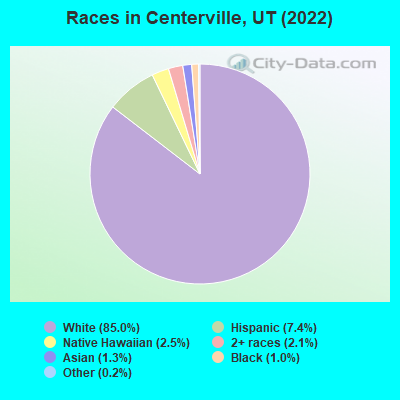
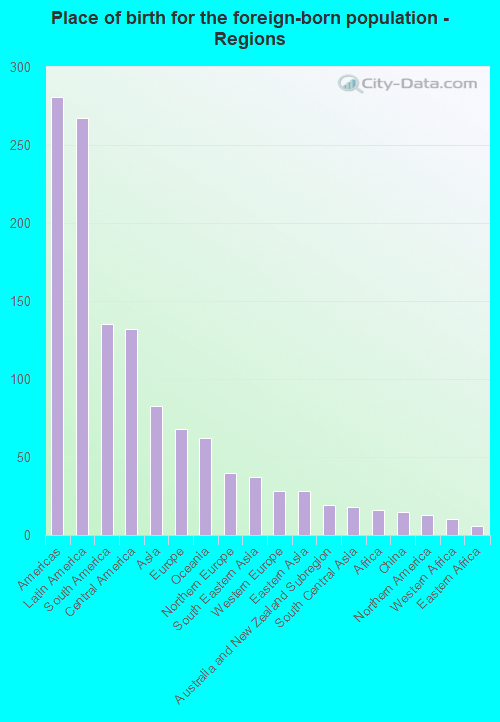
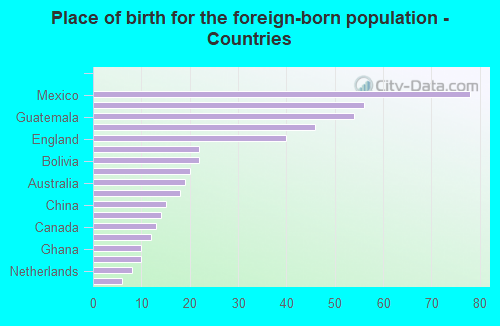
According to 2022 data, the most numerous races in Centerville, UT are White alone (14,502 residents), Hispanic (1,262 residents), and Two or more races (362 residents). 91.9% of Centerville residents speak English at home. 3.0% of Centerville, UT residents are foreign-born (1.5% born in Latin America, 0.5% born in Asia, 0.4% born in Europe, 0.4% born in Oceania), which is 166.0% less than the foreign-born rate of 8.0% across the entire state of Utah.
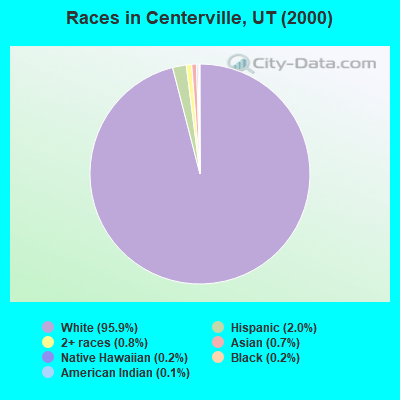
Race distribution in Centerville
2000 2022
1,904,265 85.3% White alone 201,559 9.0% Hispanic 36,483 1.6% Asian alone 31,308 1.4% Two or more races 26,663 1.2% American Indian alone 14,806 0.7% Native Hawaiian and Other 16,137 0.7% Black alone 1,948 0.09% Other race alone
2,557,466 75.6% White alone 512,086 15.1% Hispanic 119,308 3.5% Two or more races 82,388 2.4% Asian alone 36,978 1.1% Native Hawaiian and Other 34,873 1.0% Black alone 22,803 0.7% American Indian alone 14,898 0.4% Other race alone
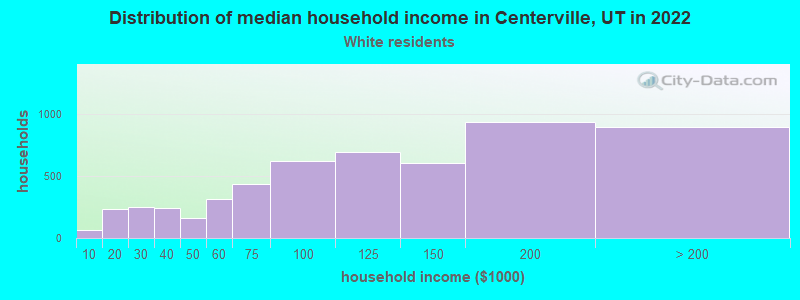
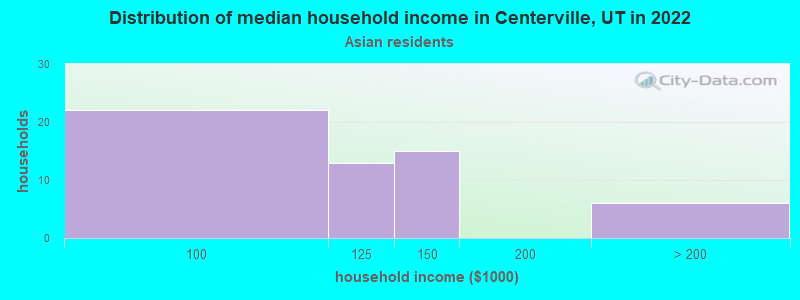
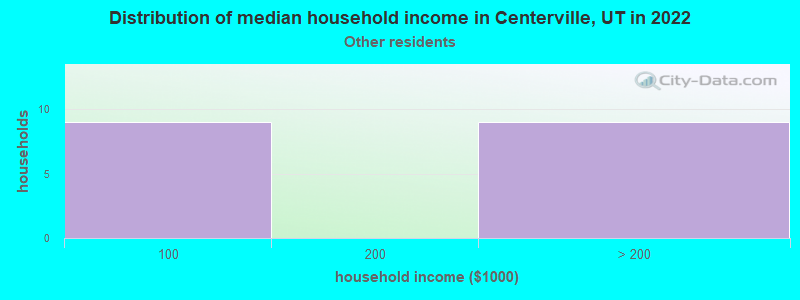
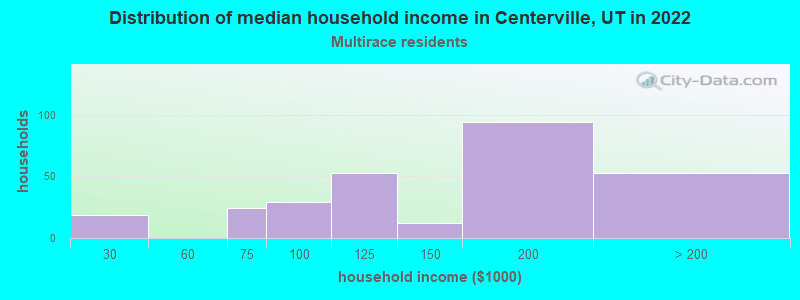
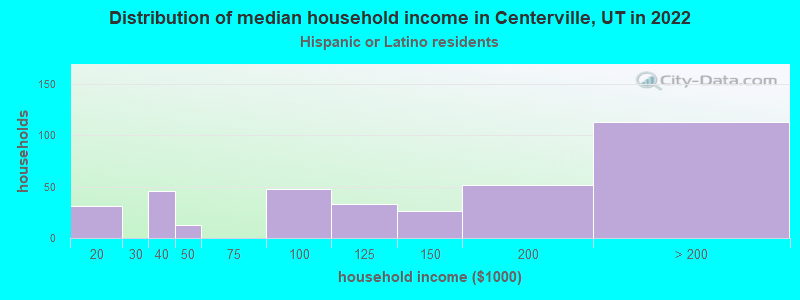
Income and house value in Centerville Median household income in 2022 $116,554 White non-Hispanic householders$106,529 Asian householdersover $200,000 Two or more races householders$110,443 Hispanic or Latino race householdersMedian 2022 house value $592,873 White Non-Hispanic householders $515,651 Asian householdersover $1,000,000 Some other race householders$433,386 Two or more races householders$493,273 Hispanic or Latino householders
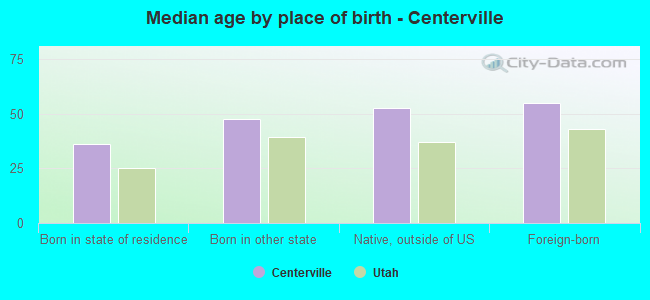
Median age by race in Centerville
41.6 Median age for White residents40.1 43.3 17.3 Median age for Black or African American residents18.7 17.8 -564,430,244.4 Median age for American Indian / Alaska Native residents-686,346,862.8 -386,961,093.2 41.3 Median age for Asian residents25.9 40.9 13.7 Median age for Native Hawaiian / Pacific Islander residents11.5 20.8 23.8 Median age for Other race residents23.9 24.1 28.8 Median age for Two or more races residents31.2 16.1 42.9 Median age for White alone residents41.1 43.7 25.3 Median age for Hispanic or Latino residents28.1 16.2
Owner/renter occupied households by race in Centerville
House owners and renters - White residents 4,795 87.2% Owner occupied703 12.8% Renter occupiedHouse owners and renters - Black or African American residents 9 100.0% Owner occupiedHouse owners and renters - Asian residents 31 55.4% Owner occupied25 44.6% Renter occupiedHouse owners and renters - Native Hawaiian / Pacific Islander residents 58 100.0% Owner occupiedHouse owners and renters - Other race residents 20 100.0% Owner occupiedHouse owners and renters - Two or more races residents 177 75.0% Owner occupied59 25.0% Renter occupiedHouse owners and renters - White alone residents 4,708 88.8% Owner occupied591 11.2% Renter occupiedHouse owners and renters - Hispanic or Latino residents 202 56.0% Owner occupied159 44.0% Renter occupied
Language usage in Centerville
English speakers - Total 91.9% of residents of Centerville speak English at home.
5.3% of residents speak Spanish at home 802 93.7% Speak English very well54 6.3% Speak English less than very well3.2% of residents speak other language at home 492 95.5% Speak English very well23 4.5% Speak English less than very well
English speakers - Born in the United States 90.5% of residents of Centerville speak English at home.
5.0% of residents speak Spanish at home 212 94.2% Speak English very well13 5.8% Speak English less than very well4.2% of residents speak other language at home 175 93.1% Speak English very well13 6.9% Speak English less than very well
English speakers - Native, born elsewhere 52.2% of residents of Centerville speak English at home.
57.6% of residents speak Spanish at home 117 100.0% Speak English very well
English speakers - Foreign-born 24.4% of residents of Centerville speak English at home.
55.4% of residents speak Spanish at home 197 89.5% Speak English very well23 10.5% Speak English less than very well21.7% of residents speak other language at home 83 96.5% Speak English very well3 3.5% Speak English less than very well
White (Caucasian) - Speak only English Native:
95.9% (13,810)Foreign-born:
25.7% (39)
White (Caucasian) - Speak another language Native:
4.0% (582)Foreign-born:
73.1% (110)
Black or African American - Speak only English Native:
91.5% (126)Foreign-born:
100.0% (14)
Asian - Speak only English Native:
57.2% (106)Foreign-born:
12.8% (8)
Asian - Speak another language Native:
51.9% (96)Foreign-born:
81.8% (50)
Native Hawaiian / Pacific Islander - Speak only English Native:
69.3% (156)Foreign-born:
36.1% (33)
Native Hawaiian / Pacific Islander - Speak another language Native:
29.9% (67)Foreign-born:
55.8% (51)
Other race - Speak another language Native:
77.6% (236)Foreign-born:
90.7% (5)
Two or more races - Speak only English Native:
75.3% (376)Foreign-born:
12.3% (9)
Two or more races - Speak another language Native:
24.9% (124)Foreign-born:
87.8% (64)
White alone - Speak only English Native:
96.0% (13,277)Foreign-born:
72.1% (45)
White alone - Speak another language Native:
4.0% (557)Foreign-born:
16.7% (11)
Hispanic or Latino - Speak another language Native:
31.4% (323)Foreign-born:
100.0% (172)
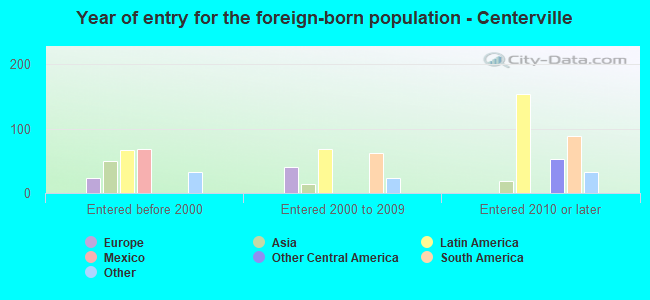
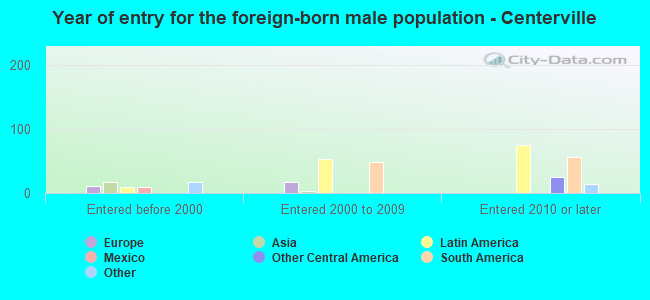
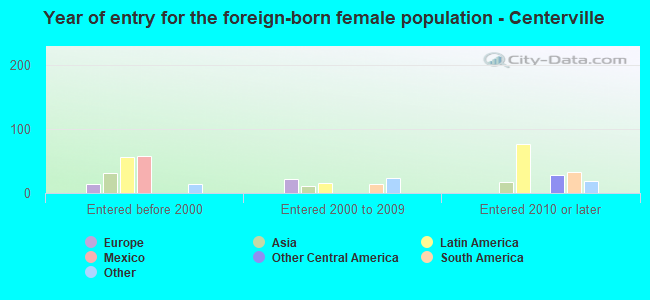
Foreign-born residents in Centerville 513 residents are foreign born (1.5% Latin America , 0.5% Asia , 0.4% Europe , 0.4% Oceania ).
Marital status for residents in Centerville Marital status - White (Caucasian) population 15 years and over
Males 22.8% Never married67.9% Now married1.5% Separated3.4% Widowed4.4% DivorcedFemales 20.0% Never married60.6% Now married0.6% Separated7.0% Widowed11.8% DivorcedWomen who gave birth in the past 12 months Now married:
88.0% (126)Unmarried:
12.0% (17)
Women who did not give birth in the past 12 months Now married:
57.0% (1,824)Unmarried:
43.0% (1,377)
Marital status - Black or African American population 15 years and over
Males 56.4% Never married43.6% Now married0.0% Separated0.0% Widowed0.0% DivorcedFemales 76.7% Never married23.3% Now married0.0% Separated0.0% Widowed0.0% DivorcedWomen who did not give birth in the past 12 months Now married:
0.0% (0)Unmarried:
100.0% (37)
Marital status - Asian population 15 years and over
Males 26.2% Never married64.3% Now married0.0% Separated0.0% Widowed9.5% DivorcedFemales 14.1% Never married65.6% Now married9.4% Separated0.0% Widowed10.9% DivorcedWomen who did not give birth in the past 12 months Now married:
64.0% (63)Unmarried:
36.0% (36)
Marital status - Native Hawaiian / Pacific Islander population 15 years and over
Males 28.6% Never married47.1% Now married0.0% Separated24.3% Widowed0.0% DivorcedFemales 0.0% Never married64.0% Now married0.0% Separated14.9% Widowed21.1% DivorcedWomen who gave birth in the past 12 months Now married:
100.0% (9)Unmarried:
0.0% (0)
Women who did not give birth in the past 12 months Now married:
55.6% (37)Unmarried:
44.4% (30)
Marital status - Other race population 15 years and over
Males 58.9% Never married41.1% Now married0.0% Separated0.0% Widowed0.0% DivorcedFemales 16.4% Never married83.6% Now married0.0% Separated0.0% Widowed0.0% DivorcedWomen who did not give birth in the past 12 months Now married:
83.6% (48)Unmarried:
16.4% (9)
Marital status - Two or more races population 15 years and over
Males 42.6% Never married49.6% Now married0.0% Separated0.0% Widowed7.8% DivorcedFemales 38.7% Never married61.3% Now married0.0% Separated0.0% Widowed0.0% DivorcedWomen who did not give birth in the past 12 months Now married:
45.5% (53)Unmarried:
54.5% (64)
Marital status - White alone, not Hispanic / Latino population 15 years and over
Males 21.2% Never married69.5% Now married1.6% Separated3.5% Widowed4.2% DivorcedFemales 19.3% Never married61.7% Now married0.6% Separated7.3% Widowed11.1% DivorcedWomen who gave birth in the past 12 months Now married:
87.3% (118)Unmarried:
12.7% (17)
Women who did not give birth in the past 12 months Now married:
58.4% (1,807)Unmarried:
41.6% (1,287)
Marital status - Hispanic or Latino population 15 years and over
Males 59.7% Never married31.7% Now married0.0% Separated0.0% Widowed8.6% DivorcedFemales 35.9% Never married42.0% Now married0.0% Separated0.0% Widowed22.2% DivorcedWomen who gave birth in the past 12 months Now married:
100.0% (8)Unmarried:
0.0% (0)
Women who did not give birth in the past 12 months Now married:
42.0% (93)Unmarried:
58.0% (129)
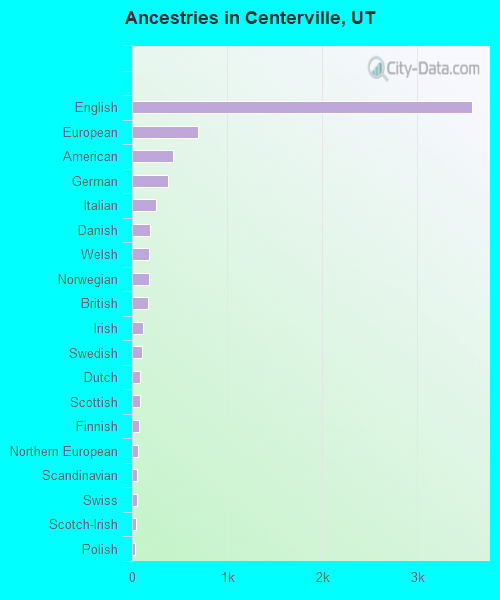
Ancestries in Centerville
3,577 43.9% English696 8.5% European429 5.3% American377 4.6% German253 3.1% Italian189 2.3% Danish178 2.2% Welsh175 2.1% Norwegian171 2.1% British112 1.4% Irish102 1.3% Swedish86 1.1% Dutch82 1.0% Scottish78 1.0% Finnish58 0.7% Northern European52 0.6% Scandinavian49 0.6% Swiss42 0.5% Scotch-Irish33 0.4% Polish29 0.4% Pennsylvania German26 0.3% Lebanese22 0.3% Australian14 0.2% Croatian14 0.2% French10 0.1% Czech6 0.07% Ethiopian6 0.07% African
Children Nativity (place of birth) in Centerville
Children under 6 years - Living with two parents Both parents native 1,032 100.0% NativeBoth parents foreign-born 4 100.0% NativeOne native, one foreign-born parent 49 100.0% NativeChildren under 6 years - Living with one parent Native parent 94 100.0% NativeChildren 6 to 17 years - Living with two parents Both parents native 2,750 99.9% Native2 0.1% Foreign-bornBoth parents foreign-born 18 23.7% Native57 76.3% Foreign-bornOne native, one foreign-born parent 48 100.0% NativeChildren 6 to 17 years - Living with one parent Native parent 266 85.1% Native47 14.9% Foreign-born
Grandparents responsible for own grandchildren in Centerville
Grandparents (30 to 59 years) White / Caucasian 79 100.0% Not responsible for grandchildrenWhite alone, not Hispanic / Latino 73 100.0% Not responsible for grandchildren
Grandparents (60 years and over) White / Caucasian 200 100.0% Not responsible for grandchildrenWhite alone, not Hispanic / Latino 202 100.0% Not responsible for grandchildren