Races in Central Islip, New York (NY) Detailed Stats
Data:
Races - White alone (%)
Races - White alone (% change since 2000)
Races - Black alone (%)
Races - Black alone (% change since 2000)
Races - American Indian alone (%)
Races - American Indian alone (% change since 2000)
Races - Asian alone (%)
Races - Asian alone (% change since 2000)
Races - Hispanic (%)
Races - Hispanic (% change since 2000)
Races - Native Hawaiian and Other Pacific Islander alone (%)
Races - Native Hawaiian and Other Pacific Islander alone (% change since 2000)
Races - Two or more races(%)
Races - Two or more races(% change since 2000)
Races - Other race alone (%)
Races - Other race alone (% change since 2000)
Racial diversity
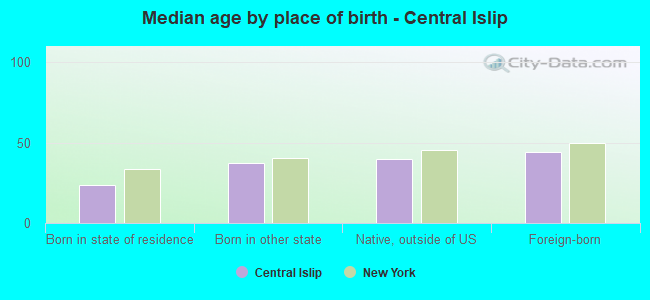
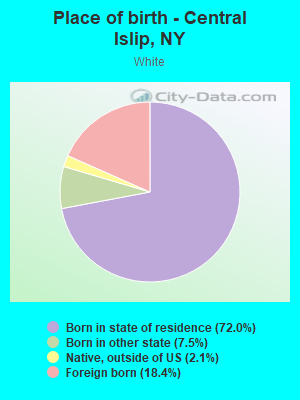
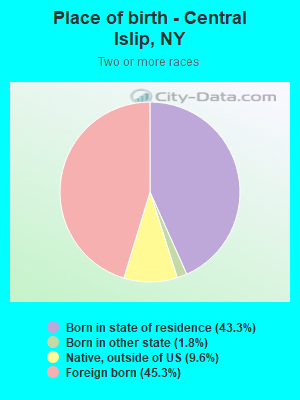
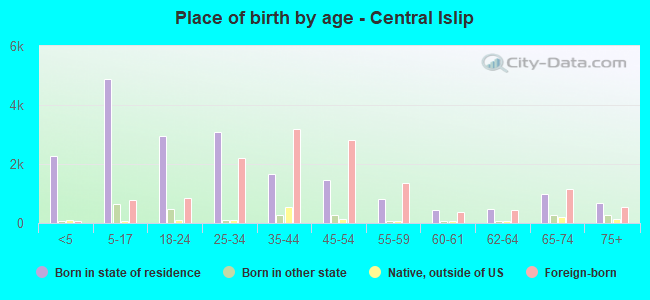
Place of birth - Born in state of residence (%)
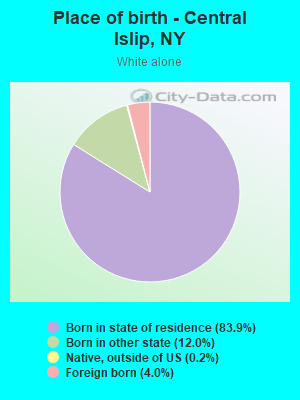
Place of birth - Born in state of residence (%) - White
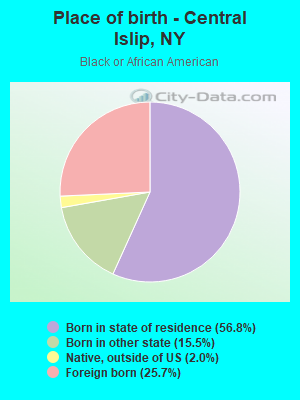
Place of birth - Born in state of residence (%) - Black or African American
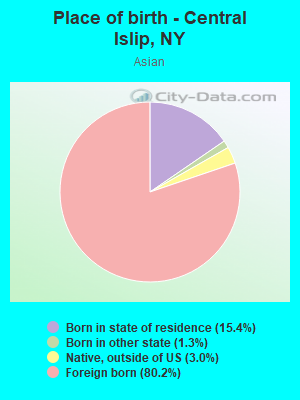
Place of birth - Born in state of residence (%) - Asian
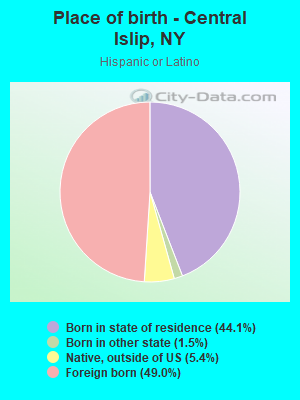
Place of birth - Born in state of residence (%) - Hispanic or Latino
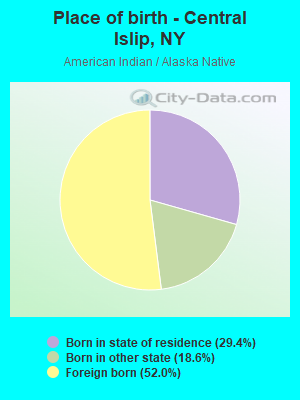
Place of birth - Born in state of residence (%) - American Indian and Alaska Native
Place of birth - Born in state of residence (%) - Multirace
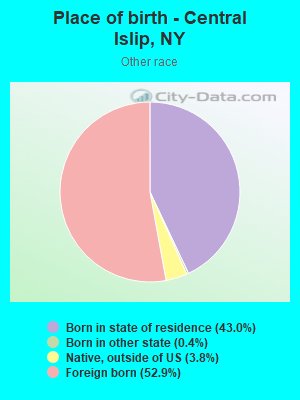
Place of birth - Born in state of residence (%) - Other Race
Place of birth - Born in other state (%)
Place of birth - Born in other state (%) - White
Place of birth - Born in other state (%) - Black or African American
Place of birth - Born in other state (%) - Asian
Place of birth - Born in other state (%) - Hispanic or Latino
Place of birth - Born in other state (%) - American Indian and Alaska Native
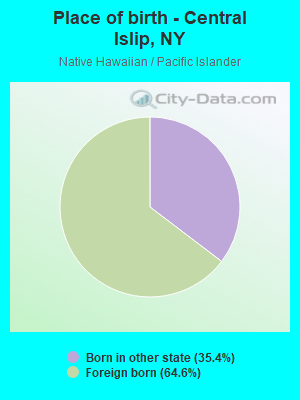
Place of birth - Born in other state (%) - Multirace
Place of birth - Born in other state (%) - Other Race
Place of birth - Native, outside of US (%)
Place of birth - Native, outside of US (%) - White
Place of birth - Native, outside of US (%) - Black or African American
Place of birth - Native, outside of US (%) - Asian
Place of birth - Native, outside of US (%) - Hispanic or Latino
Place of birth - Native, outside of US (%) - American Indian and Alaska Native
Place of birth - Native, outside of US (%) - Multirace
Place of birth - Native, outside of US (%) - Other Race
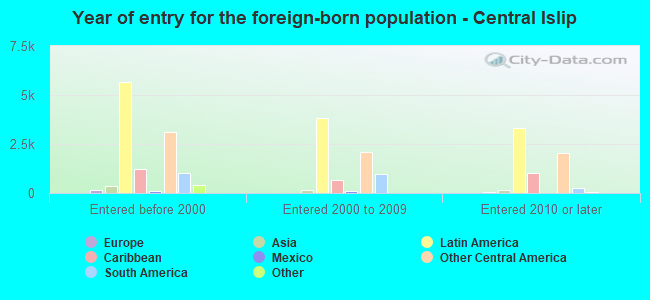
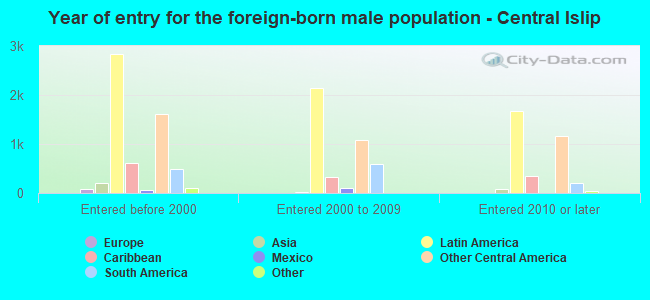
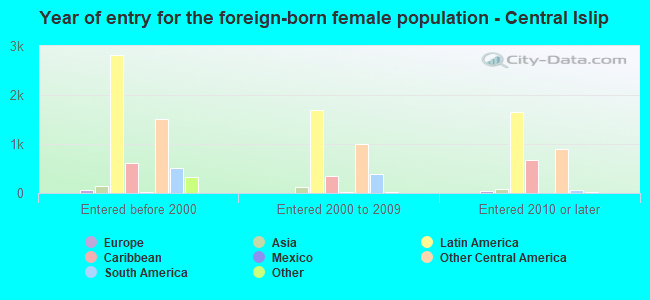
Place of birth - Foreign born (%)
Place of birth - Foreign born (%) - White
Place of birth - Foreign born (%) - Black or African American
Place of birth - Foreign born (%) - Asian
Place of birth - Foreign born (%) - Hispanic or Latino
Place of birth - Foreign born (%) - American Indian and Alaska Native
Place of birth - Foreign born (%) - Multirace
Place of birth - Foreign born (%) - Other Race
Residents speaking English at home (%)
Residents speaking English at home - Born in the United States (%)
Residents speaking English at home - Native, born elsewhere (%)
Residents speaking English at home - Foreign born (%)
Residents speaking Spanish at home (%)
Residents speaking Spanish at home - Born in the United States (%)
Residents speaking Spanish at home - Native, born elsewhere (%)
Residents speaking Spanish at home - Foreign born (%)
Residents speaking other language at home (%)
Residents speaking other language at home - Born in the United States (%)
Residents speaking other language at home - Native, born elsewhere (%)
Residents speaking other language at home - Foreign born (%)
Marital status - Never married (%)
Marital status - Now married (%)
Marital status - Separated (%)
Marital status - Widowed (%)
Marital status - Divorced (%)
Ancestries Reported - Arab (%)
Ancestries Reported - Czech (%)
Ancestries Reported - Danish (%)
Ancestries Reported - Dutch (%)
Ancestries Reported - English (%)
Ancestries Reported - French (%)
Ancestries Reported - French Canadian (%)
Ancestries Reported - German (%)
Ancestries Reported - Greek (%)
Ancestries Reported - Hungarian (%)
Ancestries Reported - Irish (%)
Ancestries Reported - Italian (%)
Ancestries Reported - Lithuanian (%)
Ancestries Reported - Norwegian (%)
Ancestries Reported - Polish (%)
Ancestries Reported - Portuguese (%)
Ancestries Reported - Russian (%)
Ancestries Reported - Scotch-Irish (%)
Ancestries Reported - Scottish (%)
Ancestries Reported - Slovak (%)
Ancestries Reported - Subsaharan African (%)
Ancestries Reported - Swedish (%)
Ancestries Reported - Swiss (%)
Ancestries Reported - Ukrainian (%)
Ancestries Reported - United States (%)
Ancestries Reported - Welsh (%)
Ancestries Reported - West Indian (%)
Ancestries Reported - Other (%)
Geographical mobility - Same house 1 year ago (%)
Geographical mobility - Same house 1 year ago (%) - White
Geographical mobility - Same house 1 year ago (%) - Black or African American
Geographical mobility - Same house 1 year ago (%) - Asian
Geographical mobility - Same house 1 year ago (%) - Hispanic or Latino
Geographical mobility - Same house 1 year ago (%) - American Indian and Alaska Native
Geographical mobility - Same house 1 year ago (%) - Multirace
Geographical mobility - Same house 1 year ago (%) - Other Race
Geographical mobility - Moved within same county (%)
Geographical mobility - Moved within same county (%) - White
Geographical mobility - Moved within same county (%) - Black or African American
Geographical mobility - Moved within same county (%) - Asian
Geographical mobility - Moved within same county (%) - Hispanic or Latino
Geographical mobility - Moved within same county (%) - American Indian and Alaska Native
Geographical mobility - Moved within same county (%) - Multirace
Geographical mobility - Moved within same county (%) - Other Race
Geographical mobility - Moved from different county within same state (%)
Geographical mobility - Moved from different county within same state (%) - White
Geographical mobility - Moved from different county within same state (%) - Black or African American
Geographical mobility - Moved from different county within same state (%) - Asian
Geographical mobility - Moved from different county within same state (%) - Hispanic or Latino
Geographical mobility - Moved from different county within same state (%) - American Indian and Alaska Native
Geographical mobility - Moved from different county within same state (%) - Multirace
Geographical mobility - Moved from different county within same state (%) - Other Race
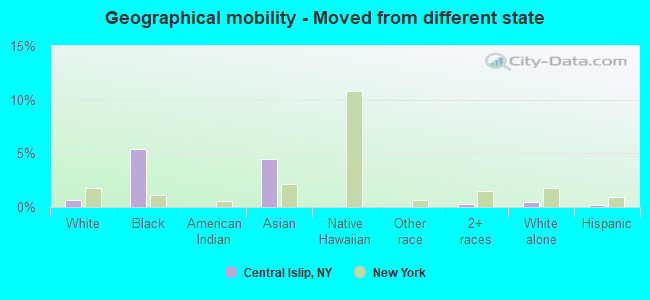
Geographical mobility - Moved from different state (%)
Geographical mobility - Moved from different state (%) - White
Geographical mobility - Moved from different state (%) - Black or African American
Geographical mobility - Moved from different state (%) - Asian
Geographical mobility - Moved from different state (%) - Hispanic or Latino
Geographical mobility - Moved from different state (%) - American Indian and Alaska Native
Geographical mobility - Moved from different state (%) - Multirace
Geographical mobility - Moved from different state (%) - Other Race
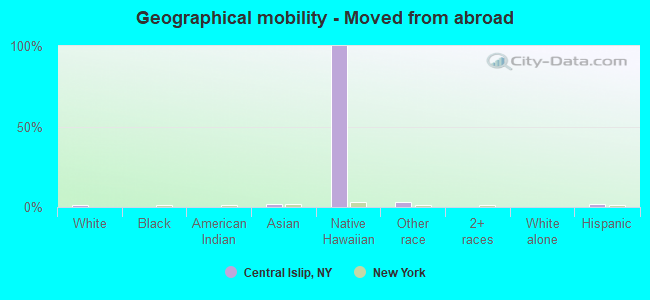
Geographical mobility - Moved from abroad (%)
Geographical mobility - Moved from abroad (%) - White
Geographical mobility - Moved from abroad (%) - Black or African American
Geographical mobility - Moved from abroad (%) - Asian
Geographical mobility - Moved from abroad (%) - Hispanic or Latino
Geographical mobility - Moved from abroad (%) - American Indian and Alaska Native
Geographical mobility - Moved from abroad (%) - Multirace
Geographical mobility - Moved from abroad (%) - Other Race
Place of birth for the foreign-born population - Ireland (%)
Place of birth for the foreign-born population - Denmark (%)
Place of birth for the foreign-born population - Norway (%)
Place of birth for the foreign-born population - Sweden (%)
Place of birth for the foreign-born population - United Kingdom (%)
Place of birth for the foreign-born population - England (%)
Place of birth for the foreign-born population - Scotland (%)
Place of birth for the foreign-born population - Other Northern Europe (%)
Place of birth for the foreign-born population - Austria (%)
Place of birth for the foreign-born population - Belgium (%)
Place of birth for the foreign-born population - France (%)
Place of birth for the foreign-born population - Germany (%)
Place of birth for the foreign-born population - Netherlands (%)
Place of birth for the foreign-born population - Switzerland (%)
Place of birth for the foreign-born population - Other Western Europe (%)
Place of birth for the foreign-born population - Greece (%)
Place of birth for the foreign-born population - Italy (%)
Place of birth for the foreign-born population - Portugal (%)
Place of birth for the foreign-born population - Spain (%)
Place of birth for the foreign-born population - Other Southern Europe (%)
Place of birth for the foreign-born population - Albania (%)
Place of birth for the foreign-born population - Belarus (%)
Place of birth for the foreign-born population - Bosnia and Herzegovina (%)
Place of birth for the foreign-born population - Bulgaria (%)
Place of birth for the foreign-born population - Croatia (%)
Place of birth for the foreign-born population - Czechoslovakia (%)
Place of birth for the foreign-born population - Hungary (%)
Place of birth for the foreign-born population - Latvia (%)
Place of birth for the foreign-born population - Lithuania (%)
Place of birth for the foreign-born population - North Macedonia (Macedonia) (%)
Place of birth for the foreign-born population - Moldova (%)
Place of birth for the foreign-born population - Poland (%)
Place of birth for the foreign-born population - Romania (%)
Place of birth for the foreign-born population - Russia (%)
Place of birth for the foreign-born population - Serbia (%)
Place of birth for the foreign-born population - Ukraine (%)
Place of birth for the foreign-born population - Other Eastern Europe (%)
Place of birth for the foreign-born population - China (%)
Place of birth for the foreign-born population - Hong Kong (%)
Place of birth for the foreign-born population - Taiwan (%)
Place of birth for the foreign-born population - Japan (%)
Place of birth for the foreign-born population - Korea (%)
Place of birth for the foreign-born population - Other Eastern Asia (%)
Place of birth for the foreign-born population - Afghanistan (%)
Place of birth for the foreign-born population - Bangladesh (%)
Place of birth for the foreign-born population - India (%)
Place of birth for the foreign-born population - Iran (%)
Place of birth for the foreign-born population - Kazakhstan (%)
Place of birth for the foreign-born population - Nepal (%)
Place of birth for the foreign-born population - Pakistan (%)
Place of birth for the foreign-born population - Sri Lanka (%)
Place of birth for the foreign-born population - Uzbekistan (%)
Place of birth for the foreign-born population - Other South Central Asia (%)
Place of birth for the foreign-born population - Burma (%)
Place of birth for the foreign-born population - Cambodia (%)
Place of birth for the foreign-born population - Indonesia (%)
Place of birth for the foreign-born population - Laos (%)
Place of birth for the foreign-born population - Malaysia (%)
Place of birth for the foreign-born population - Philippines (%)
Place of birth for the foreign-born population - Singapore (%)
Place of birth for the foreign-born population - Thailand (%)
Place of birth for the foreign-born population - Vietnam (%)
Place of birth for the foreign-born population - Other South Eastern Asia (%)
Place of birth for the foreign-born population - Armenia (%)
Place of birth for the foreign-born population - Iraq (%)
Place of birth for the foreign-born population - Israel (%)
Place of birth for the foreign-born population - Jordan (%)
Place of birth for the foreign-born population - Kuwait (%)
Place of birth for the foreign-born population - Lebanon (%)
Place of birth for the foreign-born population - Saudi Arabia (%)
Place of birth for the foreign-born population - Syria (%)
Place of birth for the foreign-born population - Turkey (%)
Place of birth for the foreign-born population - Yemen (%)
Place of birth for the foreign-born population - Other Western Asia (%)
Place of birth for the foreign-born population - Eritrea (%)
Place of birth for the foreign-born population - Ethiopia (%)
Place of birth for the foreign-born population - Kenya (%)
Place of birth for the foreign-born population - Somalia (%)
Place of birth for the foreign-born population - Uganda (%)
Place of birth for the foreign-born population - Zimbabwe (%)
Place of birth for the foreign-born population - Other Eastern Africa (%)
Place of birth for the foreign-born population - Cameroon (%)
Place of birth for the foreign-born population - Congo (%)
Place of birth for the foreign-born population - Democratic Republic of Congo (Zaire) (%)
Place of birth for the foreign-born population - Other Middle Africa (%)
Place of birth for the foreign-born population - Egypt (%)
Place of birth for the foreign-born population - Morocco (%)
Place of birth for the foreign-born population - Sudan (%)
Place of birth for the foreign-born population - Other Northern Africa (%)
Place of birth for the foreign-born population - South Africa (%)
Place of birth for the foreign-born population - Other Southern Africa (%)
Place of birth for the foreign-born population - Cabo Verde (%)
Place of birth for the foreign-born population - Ghana (%)
Place of birth for the foreign-born population - Liberia (%)
Place of birth for the foreign-born population - Nigeria (%)
Place of birth for the foreign-born population - Senegal (%)
Place of birth for the foreign-born population - Sierra Leone (%)
Place of birth for the foreign-born population - Other Western Africa (%)
Place of birth for the foreign-born population - Australia (%)
Place of birth for the foreign-born population - New Zealand (%)
Place of birth for the foreign-born population - Fiji (%)
Place of birth for the foreign-born population - Micronesia (%)
Place of birth for the foreign-born population - Bahamas (%)
Place of birth for the foreign-born population - Barbados (%)
Place of birth for the foreign-born population - Cuba (%)
Place of birth for the foreign-born population - Dominica (%)
Place of birth for the foreign-born population - Dominican Republic (%)
Place of birth for the foreign-born population - Grenada (%)
Place of birth for the foreign-born population - Haiti (%)
Place of birth for the foreign-born population - Jamaica (%)
Place of birth for the foreign-born population - St. Vincent and the Grenadines (%)
Place of birth for the foreign-born population - Trinidad and Tobago (%)
Place of birth for the foreign-born population - West Indies (%)
Place of birth for the foreign-born population - Other Caribbean (%)
Place of birth for the foreign-born population - Belize (%)
Place of birth for the foreign-born population - Costa Rica (%)
Place of birth for the foreign-born population - El Salvador (%)
Place of birth for the foreign-born population - Guatemala (%)
Place of birth for the foreign-born population - Honduras (%)
Place of birth for the foreign-born population - Mexico (%)
Place of birth for the foreign-born population - Nicaragua (%)
Place of birth for the foreign-born population - Panama (%)
Place of birth for the foreign-born population - Other Central America (%)
Place of birth for the foreign-born population - Argentina (%)
Place of birth for the foreign-born population - Bolivia (%)
Place of birth for the foreign-born population - Brazil (%)
Place of birth for the foreign-born population - Chile (%)
Place of birth for the foreign-born population - Colombia (%)
Place of birth for the foreign-born population - Ecuador (%)
Place of birth for the foreign-born population - Guyana (%)
Place of birth for the foreign-born population - Peru (%)
Place of birth for the foreign-born population - Uruguay (%)
Place of birth for the foreign-born population - Venezuela (%)
Place of birth for the foreign-born population - Other South America (%)
Place of birth for the foreign-born population - Canada (%)
Place of birth for the foreign-born population - Other Northern America (%)
Place of birth for the foreign-born population - Other (%)
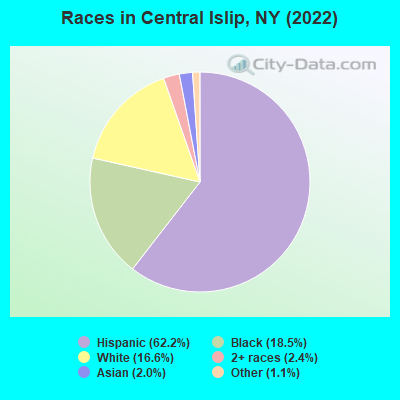
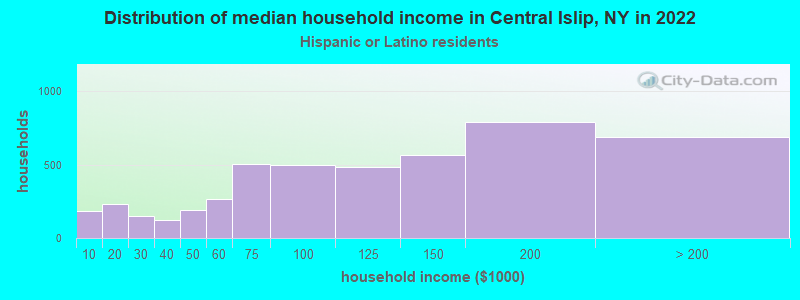
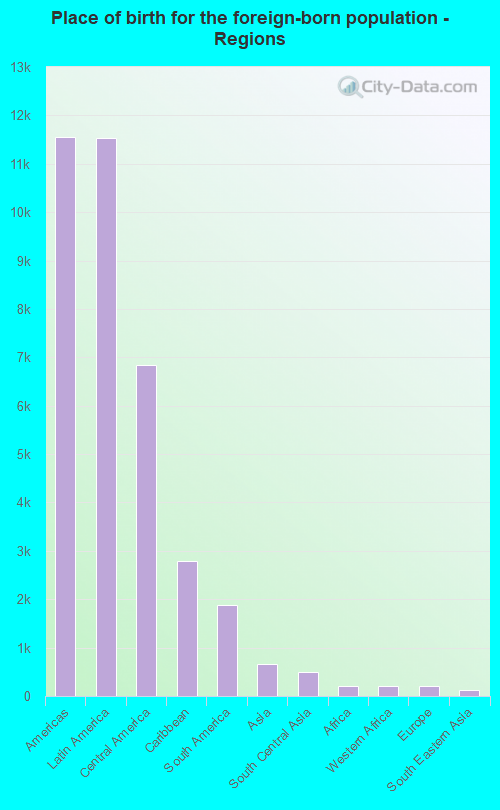
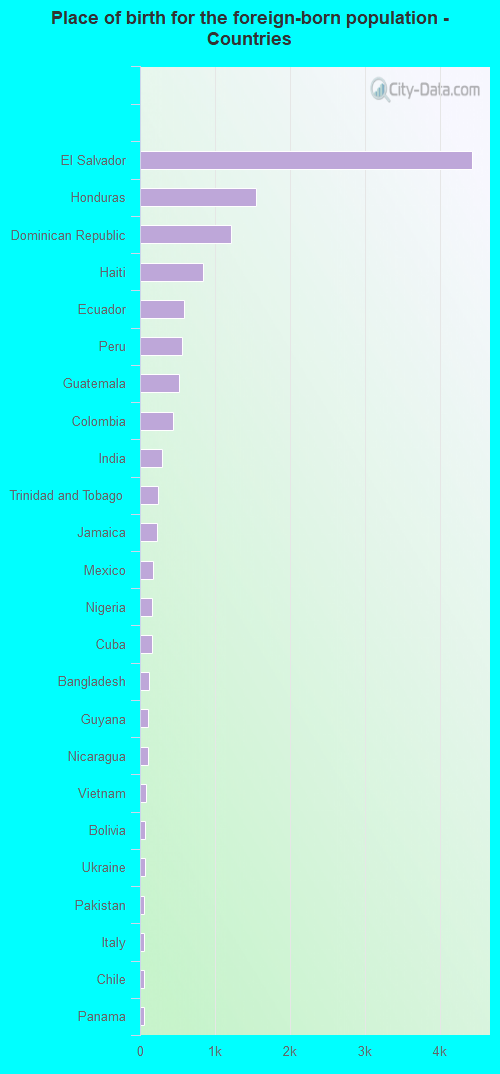
According to 2022 data, the most numerous races in Central Islip, NY are White alone (6,053 residents), Hispanic (22,719 residents), and Black alone (6,762 residents). 41.7% of Central Islip residents speak English at home. 34.6% of Central Islip, NY residents are foreign-born (31.9% born in Latin America), which is 36.5% greater than the foreign-born rate of 22.0% across the entire state of New York.
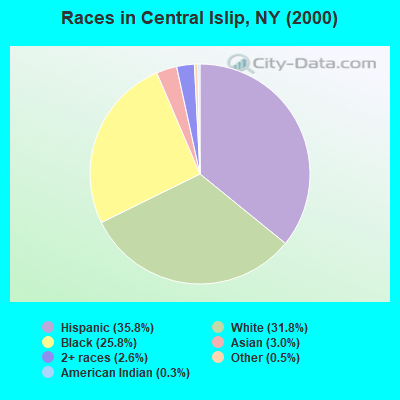
Race distribution in Central Islip
2000 2022
11,760,981 62.0% White alone 2,867,583 15.1% Hispanic 2,812,623 14.8% Black alone 1,035,926 5.5% Asian alone 366,116 1.9% Two or more races 75,499 0.4% Other race alone 52,499 0.3% American Indian alone 5,230 0.03% Native Hawaiian and Other
10,408,933 52.9% White alone 3,867,299 19.7% Hispanic 2,633,840 13.4% Black alone 1,776,286 9.0% Asian alone 732,670 3.7% Two or more races 216,110 1.1% Other race alone 35,082 0.2% American Indian alone 6,931 0.04% Native Hawaiian and Other
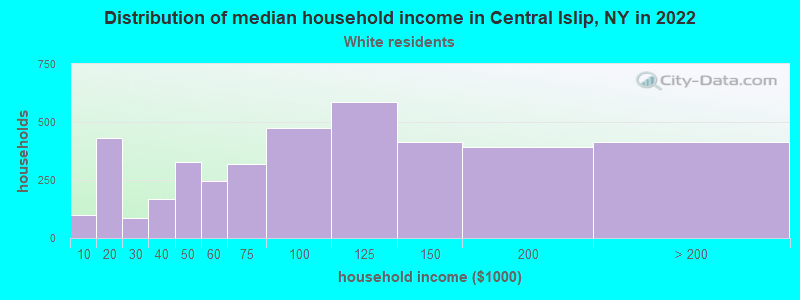
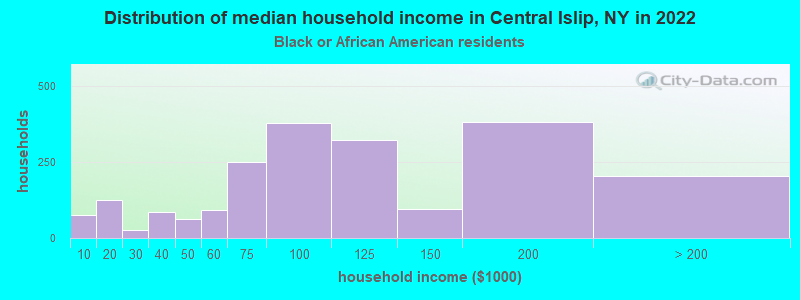
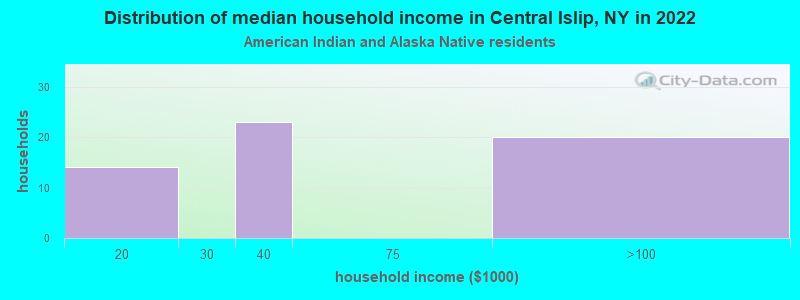
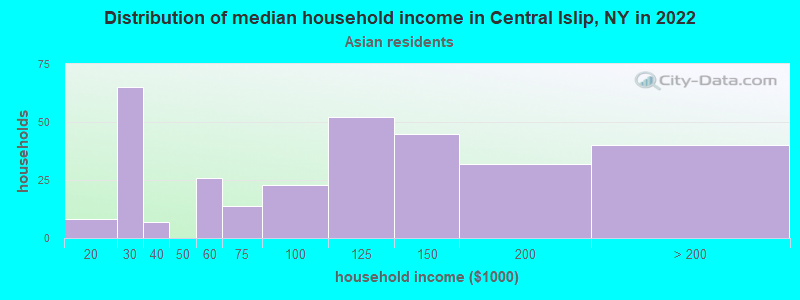
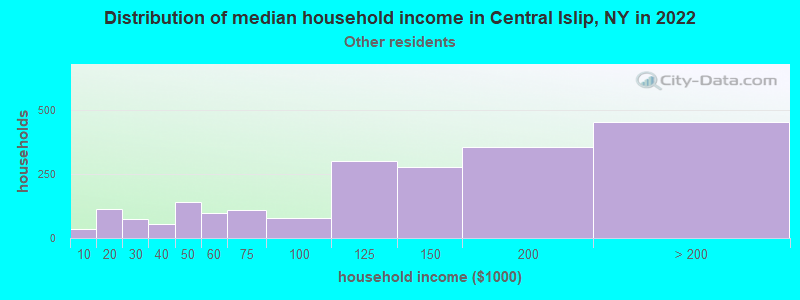
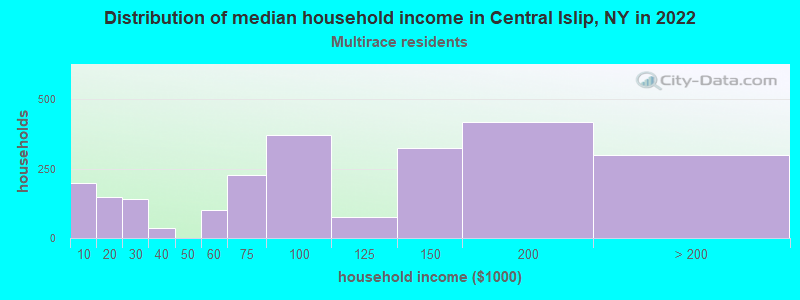
Income and house value in Central Islip Median household income in 2022 $85,539 White non-Hispanic householders$99,894 Black householders$87,552 Asian householders$136,035 Some other race householders$89,793 Two or more races householders$113,108 Hispanic or Latino race householdersMedian 2022 house value $391,188 White Non-Hispanic householders$425,652 Black or African American householders$256,963 American Indian or Alaska Native householders $426,256 Asian householders$415,675 Native Hawaiian and other Pacific Islander householders$412,652 Some other race householders$421,117 Two or more races householders$405,094 Hispanic or Latino householders
Median age by race in Central Islip
38.6 Median age for White residents36.4 41.3 34.3 Median age for Black or African American residents32.3 37.1 50.0 Median age for American Indian / Alaska Native residents62.2 11.5 53.8 Median age for Asian residents53.2 54.5 -742,816,091.2 Median age for Native Hawaiian / Pacific Islander residents-831,187,409.8 -771,300,447.7 30.8 Median age for Other race residents30.2 31.8 34.6 Median age for Two or more races residents28.9 42.6 51.1 Median age for White alone residents38.2 60.0 31.8 Median age for Hispanic or Latino residents31.1 32.8
Owner/renter occupied households by race in Central Islip
House owners and renters - White residents 3,069 77.2% Owner occupied906 22.8% Renter occupiedHouse owners and renters - Black or African American residents 1,436 70.1% Owner occupied612 29.9% Renter occupiedHouse owners and renters - American Indian / Alaska Native residents 31 50.5% Owner occupied30 49.5% Renter occupiedHouse owners and renters - Asian residents 267 80.4% Owner occupied65 19.6% Renter occupiedHouse owners and renters - Native Hawaiian / Pacific Islander residents 16 100.0% Owner occupiedHouse owners and renters - Other race residents 1,601 78.2% Owner occupied446 21.8% Renter occupiedHouse owners and renters - Two or more races residents 1,573 66.8% Owner occupied780 33.2% Renter occupiedHouse owners and renters - White alone residents 2,075 78.4% Owner occupied571 21.6% Renter occupiedHouse owners and renters - Hispanic or Latino residents 3,377 71.5% Owner occupied1,347 28.5% Renter occupied
Language usage in Central Islip
English speakers - Total 41.7% of residents of Central Islip speak English at home.
54.5% of residents speak Spanish at home 9,585 51.5% Speak English very well9,022 48.5% Speak English less than very well6.2% of residents speak other language at home 1,324 62.6% Speak English very well791 37.4% Speak English less than very well
English speakers - Born in the United States 78.0% of residents of Central Islip speak English at home.
19.0% of residents speak Spanish at home 424 97.2% Speak English very well12 2.8% Speak English less than very well0.9% of residents speak other language at home 21 100.0% Speak English very well
English speakers - Native, born elsewhere 27.6% of residents of Central Islip speak English at home.
61.8% of residents speak Spanish at home 403 44.8% Speak English very well497 55.2% Speak English less than very well1.8% of residents speak other language at home 26 100.0% Speak English very well
English speakers - Foreign-born 13.5% of residents of Central Islip speak English at home.
77.3% of residents speak Spanish at home 2,903 27.4% Speak English very well7,706 72.6% Speak English less than very well12.1% of residents speak other language at home 868 52.3% Speak English very well793 47.7% Speak English less than very well
White (Caucasian) - Speak only English Native:
61.7% (5,437)Foreign-born:
18.8% (393)
White (Caucasian) - Speak another language Native:
29.5% (2,597)Foreign-born:
77.9% (1,624)
Black or African American - Speak only English Native:
94.8% (4,949)Foreign-born:
50.1% (957)
Black or African American - Speak another language Native:
3.0% (155)Foreign-born:
49.1% (938)
American Indian / Alaska Native - Speak another language Native:
54.6% (55)Foreign-born:
100.0% (128)
Asian - Speak only English Native:
45.4% (57)Foreign-born:
15.2% (90)
Asian - Speak another language Native:
54.7% (68)Foreign-born:
82.3% (486)
Other race - Speak only English Native:
27.8% (1,311)Foreign-born:
6.8% (441)
Other race - Speak another language Native:
70.9% (3,343)Foreign-born:
93.4% (6,084)
Two or more races - Speak only English Native:
27.4% (1,156)Foreign-born:
3.1% (133)
Two or more races - Speak another language Native:
71.2% (3,000)Foreign-born:
98.1% (4,201)
White alone - Speak only English Native:
82.8% (4,730)Foreign-born:
26.3% (64)
White alone - Speak another language Native:
18.1% (1,036)Foreign-born:
73.7% (178)
Hispanic or Latino - Speak only English Native:
25.4% (2,495)Foreign-born:
7.3% (814)
Hispanic or Latino - Speak another language Native:
73.1% (7,177)Foreign-born:
92.7% (10,405)
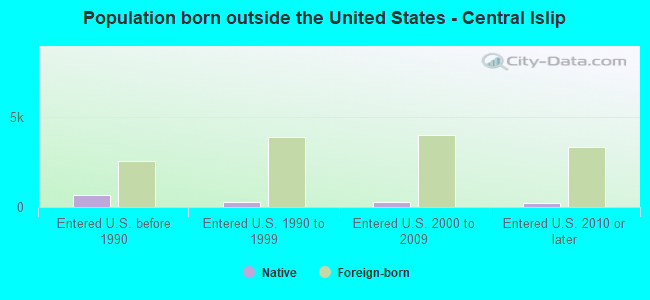
Foreign-born residents in Central Islip 12,653 residents are foreign born (31.9% Latin America ).
This city:
34.6%New York:
22.6%
Marital status for residents in Central Islip Marital status - White (Caucasian) population 15 years and over
Males 51.4% Never married34.5% Now married1.9% Separated1.3% Widowed10.9% DivorcedFemales 42.0% Never married31.1% Now married3.0% Separated9.3% Widowed14.6% DivorcedWomen who gave birth in the past 12 months Now married:
65.3% (67)Unmarried:
34.7% (36)
Women who did not give birth in the past 12 months Now married:
30.3% (748)Unmarried:
69.7% (1,723)
Marital status - Black or African American population 15 years and over
Males 55.2% Never married30.6% Now married3.2% Separated2.7% Widowed8.4% DivorcedFemales 53.2% Never married20.4% Now married4.9% Separated4.1% Widowed17.5% DivorcedWomen who gave birth in the past 12 months Now married:
12.2% (27)Unmarried:
87.8% (193)
Women who did not give birth in the past 12 months Now married:
19.1% (352)Unmarried:
80.9% (1,492)
Marital status - American Indian / Alaska Native population 15 years and over
Males 13.6% Never married30.7% Now married39.8% Separated0.0% Widowed15.9% DivorcedFemales 0.0% Never married100.0% Now married0.0% Separated0.0% Widowed0.0% DivorcedWomen who did not give birth in the past 12 months Now married:
100.0% (33)Unmarried:
0.0% (0)
Marital status - Asian population 15 years and over
Males 42.9% Never married44.0% Now married2.4% Separated4.5% Widowed6.2% DivorcedFemales 23.5% Never married47.6% Now married0.0% Separated14.4% Widowed14.4% DivorcedWomen who gave birth in the past 12 months Now married:
100.0% (6)Unmarried:
0.0% (0)
Women who did not give birth in the past 12 months Now married:
44.2% (76)Unmarried:
55.8% (96)
Marital status - Native Hawaiian / Pacific Islander population 15 years and over
Males 0.0% Never married0.0% Now married0.0% Separated0.0% Widowed100.0% DivorcedFemales 0.0% Never married0.0% Now married0.0% Separated100.0% Widowed0.0% DivorcedMarital status - Other race population 15 years and over
Males 43.7% Never married39.3% Now married2.5% Separated0.0% Widowed14.5% DivorcedFemales 46.5% Never married35.7% Now married1.9% Separated4.7% Widowed11.1% DivorcedWomen who gave birth in the past 12 months Now married:
84.5% (88)Unmarried:
15.5% (16)
Women who did not give birth in the past 12 months Now married:
28.7% (993)Unmarried:
71.3% (2,471)
Marital status - Two or more races population 15 years and over
Males 52.8% Never married40.1% Now married3.2% Separated0.0% Widowed3.8% DivorcedFemales 38.5% Never married46.7% Now married0.6% Separated0.9% Widowed13.3% DivorcedWomen who gave birth in the past 12 months Now married:
100.0% (6)Unmarried:
0.0% (0)
Women who did not give birth in the past 12 months Now married:
34.8% (751)Unmarried:
65.2% (1,408)
Marital status - White alone, not Hispanic / Latino population 15 years and over
Males 54.5% Never married28.7% Now married1.2% Separated2.4% Widowed13.2% DivorcedFemales 39.3% Never married25.6% Now married1.6% Separated14.1% Widowed19.4% DivorcedWomen who gave birth in the past 12 months Now married:
44.0% (10)Unmarried:
56.0% (13)
Women who did not give birth in the past 12 months Now married:
24.4% (242)Unmarried:
75.6% (750)
Marital status - Hispanic or Latino population 15 years and over
Males 49.7% Never married39.2% Now married2.7% Separated0.0% Widowed8.3% DivorcedFemales 44.1% Never married39.3% Now married2.5% Separated3.5% Widowed10.7% DivorcedWomen who gave birth in the past 12 months Now married:
77.4% (134)Unmarried:
22.6% (39)
Women who did not give birth in the past 12 months Now married:
31.5% (1,795)Unmarried:
68.5% (3,902)
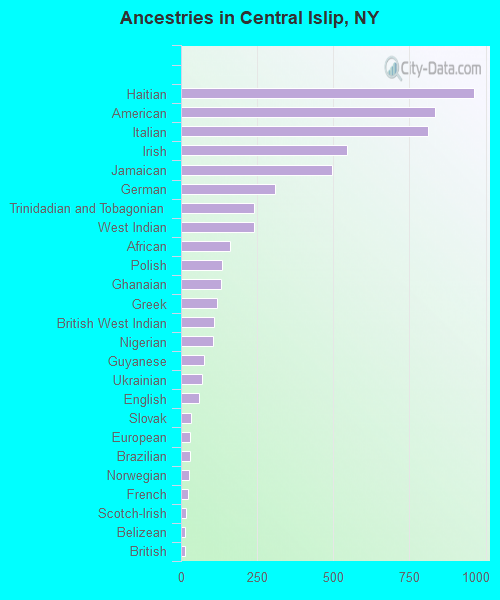
Ancestries in Central Islip
963 4.2% Haitian834 3.6% American811 3.5% Italian544 2.4% Irish496 2.2% Jamaican308 1.3% German241 1.1% Trinidadian and Tobagonian240 1.0% West Indian161 0.7% African134 0.6% Polish132 0.6% Ghanaian118 0.5% Greek109 0.5% British West Indian105 0.5% Nigerian77 0.3% Guyanese68 0.3% Ukrainian58 0.3% English33 0.1% Slovak31 0.1% European28 0.1% Brazilian26 0.1% Norwegian24 0.1% French15 0.07% Scotch-Irish14 0.06% Belizean13 0.06% British11 0.05% French Canadian7 0.03% Lebanese7 0.03% Czech6 0.03% Hungarian4 0.02% Barbadian
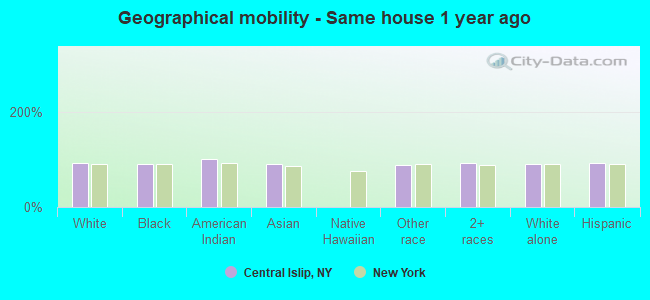
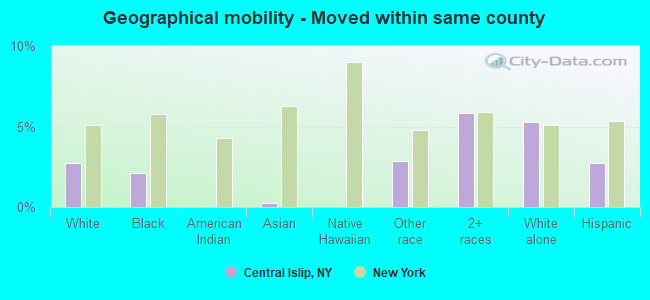
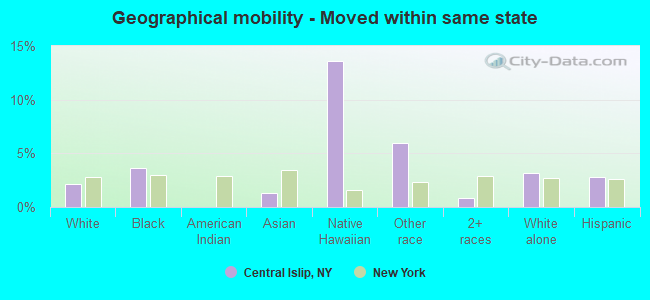
Geographical mobility in Central Islip Same house 1 year ago 11,000 93.0% White (Caucasian)6,608 89.6% Black or African American186 100.0% American Indian / Alaska Native670 89.7% Asian10,620 88.7% Other race8,676 93.2% Two or more races5,511 91.1% White alone, not Hispanic / Latino20,734 92.5% Hispanic or LatinoMoved within same county 324 2.7% White / Caucasian155 2.1% Black or African American2 0.2% Asian340 2.8% Other race541 5.8% Two or more races318 5.3% White alone, not Hispanic / Latino619 2.8% Hispanic or LatinoMoved within same state 256 2.2% White / Caucasian271 3.7% Black or African American10 1.3% Asian3 13.6% Native Hawaiian / Pacific Islander715 6.0% Other race79 0.9% Two or more races193 3.2% White alone, not Hispanic / Latino634 2.8% Hispanic or LatinoMoved from different state 76 0.6% White / Caucasian401 5.4% Black or African American33 4.5% Asian22 0.2% Two or more races26 0.4% White alone, not Hispanic / Latino34 0.2% Hispanic or LatinoMoved from abroad 160 1.4% White19 2.5% Asian30 100.0% Native Hawaiian / Pacific Islander305 2.5% Other race6 0.1% Two or more races340 1.5% Hispanic or Latino
Children Nativity (place of birth) in Central Islip
Children under 6 years - Living with two parents Both parents native 277 100.0% NativeBoth parents foreign-born 547 100.0% NativeOne native, one foreign-born parent 161 100.0% NativeChildren under 6 years - Living with one parent Native parent 342 100.0% NativeForeign-born parent 914 100.0% NativeChildren 6 to 17 years - Living with two parents Both parents native 191 99.8% Native0 0.2% Foreign-bornBoth parents foreign-born 1,571 91.6% Native144 8.4% Foreign-bornOne native, one foreign-born parent 579 100.0% NativeChildren 6 to 17 years - Living with one parent Native parent 1,110 100.0% NativeForeign-born parent 1,481 56.5% Native1,141 43.5% Foreign-born
Grandparents responsible for own grandchildren in Central Islip
Grandparents (30 to 59 years) White / Caucasian 4 2.3% Responsible for grandchildren171 97.7% Not responsible for grandchildrenBlack or African American 13 13.3% Responsible for grandchildren88 86.7% Not responsible for grandchildrenAsian 7 61.0% Responsible for grandchildren5 39.0% Not responsible for grandchildrenOther race 47 17.4% Responsible for grandchildren222 82.6% Not responsible for grandchildrenTwo or more races 125 100.0% Not responsible for grandchildrenWhite alone, not Hispanic / Latino 8 100.0% Not responsible for grandchildrenHispanic or Latino 58 10.2% Responsible for grandchildren509 89.8% Not responsible for grandchildrenGrandparents (60 years and over) White / Caucasian 58 27.3% Responsible for grandchildren155 72.7% Not responsible for grandchildrenBlack or African American 41 19.4% Responsible for grandchildren171 80.6% Not responsible for grandchildrenAsian 3 100.0% Not responsible for grandchildrenOther race 17 4.9% Responsible for grandchildren330 95.1% Not responsible for grandchildrenTwo or more races 7 8.5% Responsible for grandchildren73 91.5% Not responsible for grandchildrenWhite alone, not Hispanic / Latino 70 51.1% Responsible for grandchildren67 48.9% Not responsible for grandchildrenHispanic or Latino 12 2.5% Responsible for grandchildren461 97.5% Not responsible for grandchildren