Races in Chambersburg, Pennsylvania (PA) Detailed Stats
Data:
Races - White alone (%)
Races - White alone (% change since 2000)
Races - Black alone (%)
Races - Black alone (% change since 2000)
Races - American Indian alone (%)
Races - American Indian alone (% change since 2000)
Races - Asian alone (%)
Races - Asian alone (% change since 2000)
Races - Hispanic (%)
Races - Hispanic (% change since 2000)
Races - Native Hawaiian and Other Pacific Islander alone (%)
Races - Native Hawaiian and Other Pacific Islander alone (% change since 2000)
Races - Two or more races(%)
Races - Two or more races(% change since 2000)
Races - Other race alone (%)
Races - Other race alone (% change since 2000)
Racial diversity
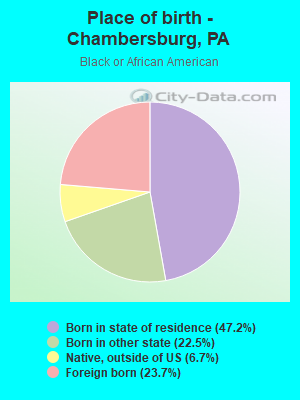
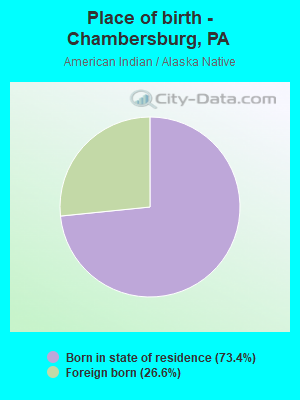
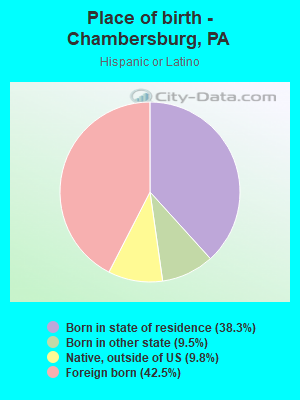
Place of birth - Born in state of residence (%)
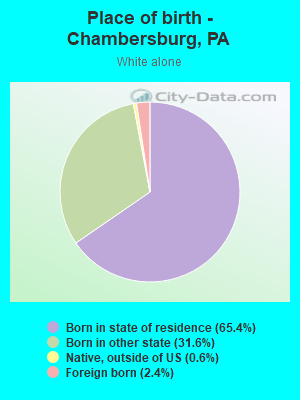
Place of birth - Born in state of residence (%) - White
Place of birth - Born in state of residence (%) - Black or African American
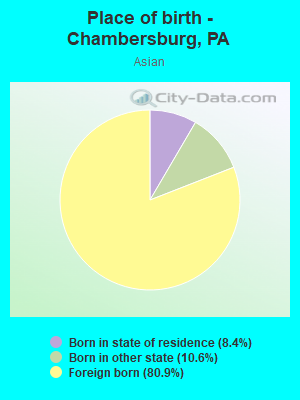
Place of birth - Born in state of residence (%) - Asian
Place of birth - Born in state of residence (%) - Hispanic or Latino
Place of birth - Born in state of residence (%) - American Indian and Alaska Native
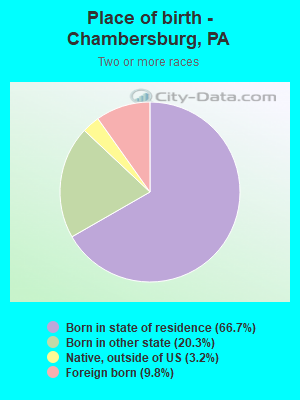
Place of birth - Born in state of residence (%) - Multirace
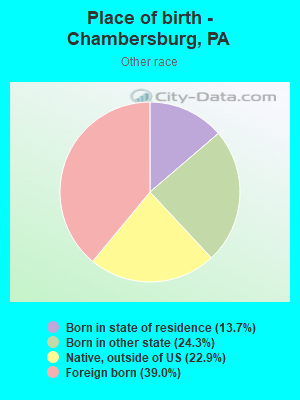
Place of birth - Born in state of residence (%) - Other Race
Place of birth - Born in other state (%)
Place of birth - Born in other state (%) - White
Place of birth - Born in other state (%) - Black or African American
Place of birth - Born in other state (%) - Asian
Place of birth - Born in other state (%) - Hispanic or Latino
Place of birth - Born in other state (%) - American Indian and Alaska Native
Place of birth - Born in other state (%) - Multirace
Place of birth - Born in other state (%) - Other Race
Place of birth - Native, outside of US (%)
Place of birth - Native, outside of US (%) - White
Place of birth - Native, outside of US (%) - Black or African American
Place of birth - Native, outside of US (%) - Asian
Place of birth - Native, outside of US (%) - Hispanic or Latino
Place of birth - Native, outside of US (%) - American Indian and Alaska Native
Place of birth - Native, outside of US (%) - Multirace
Place of birth - Native, outside of US (%) - Other Race
Place of birth - Foreign born (%)
Place of birth - Foreign born (%) - White
Place of birth - Foreign born (%) - Black or African American
Place of birth - Foreign born (%) - Asian
Place of birth - Foreign born (%) - Hispanic or Latino
Place of birth - Foreign born (%) - American Indian and Alaska Native
Place of birth - Foreign born (%) - Multirace
Place of birth - Foreign born (%) - Other Race
Residents speaking English at home (%)
Residents speaking English at home - Born in the United States (%)
Residents speaking English at home - Native, born elsewhere (%)
Residents speaking English at home - Foreign born (%)
Residents speaking Spanish at home (%)
Residents speaking Spanish at home - Born in the United States (%)
Residents speaking Spanish at home - Native, born elsewhere (%)
Residents speaking Spanish at home - Foreign born (%)
Residents speaking other language at home (%)
Residents speaking other language at home - Born in the United States (%)
Residents speaking other language at home - Native, born elsewhere (%)
Residents speaking other language at home - Foreign born (%)
Marital status - Never married (%)
Marital status - Now married (%)
Marital status - Separated (%)
Marital status - Widowed (%)
Marital status - Divorced (%)
Ancestries Reported - Arab (%)
Ancestries Reported - Czech (%)
Ancestries Reported - Danish (%)
Ancestries Reported - Dutch (%)
Ancestries Reported - English (%)
Ancestries Reported - French (%)
Ancestries Reported - French Canadian (%)
Ancestries Reported - German (%)
Ancestries Reported - Greek (%)
Ancestries Reported - Hungarian (%)
Ancestries Reported - Irish (%)
Ancestries Reported - Italian (%)
Ancestries Reported - Lithuanian (%)
Ancestries Reported - Norwegian (%)
Ancestries Reported - Polish (%)
Ancestries Reported - Portuguese (%)
Ancestries Reported - Russian (%)
Ancestries Reported - Scotch-Irish (%)
Ancestries Reported - Scottish (%)
Ancestries Reported - Slovak (%)
Ancestries Reported - Subsaharan African (%)
Ancestries Reported - Swedish (%)
Ancestries Reported - Swiss (%)
Ancestries Reported - Ukrainian (%)
Ancestries Reported - United States (%)
Ancestries Reported - Welsh (%)
Ancestries Reported - West Indian (%)
Ancestries Reported - Other (%)
Geographical mobility - Same house 1 year ago (%)
Geographical mobility - Same house 1 year ago (%) - White
Geographical mobility - Same house 1 year ago (%) - Black or African American
Geographical mobility - Same house 1 year ago (%) - Asian
Geographical mobility - Same house 1 year ago (%) - Hispanic or Latino
Geographical mobility - Same house 1 year ago (%) - American Indian and Alaska Native
Geographical mobility - Same house 1 year ago (%) - Multirace
Geographical mobility - Same house 1 year ago (%) - Other Race
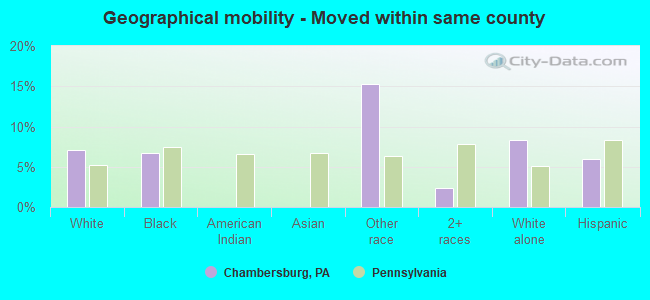
Geographical mobility - Moved within same county (%)
Geographical mobility - Moved within same county (%) - White
Geographical mobility - Moved within same county (%) - Black or African American
Geographical mobility - Moved within same county (%) - Asian
Geographical mobility - Moved within same county (%) - Hispanic or Latino
Geographical mobility - Moved within same county (%) - American Indian and Alaska Native
Geographical mobility - Moved within same county (%) - Multirace
Geographical mobility - Moved within same county (%) - Other Race
Geographical mobility - Moved from different county within same state (%)
Geographical mobility - Moved from different county within same state (%) - White
Geographical mobility - Moved from different county within same state (%) - Black or African American
Geographical mobility - Moved from different county within same state (%) - Asian
Geographical mobility - Moved from different county within same state (%) - Hispanic or Latino
Geographical mobility - Moved from different county within same state (%) - American Indian and Alaska Native
Geographical mobility - Moved from different county within same state (%) - Multirace
Geographical mobility - Moved from different county within same state (%) - Other Race
Geographical mobility - Moved from different state (%)
Geographical mobility - Moved from different state (%) - White
Geographical mobility - Moved from different state (%) - Black or African American
Geographical mobility - Moved from different state (%) - Asian
Geographical mobility - Moved from different state (%) - Hispanic or Latino
Geographical mobility - Moved from different state (%) - American Indian and Alaska Native
Geographical mobility - Moved from different state (%) - Multirace
Geographical mobility - Moved from different state (%) - Other Race
Geographical mobility - Moved from abroad (%)
Geographical mobility - Moved from abroad (%) - White
Geographical mobility - Moved from abroad (%) - Black or African American
Geographical mobility - Moved from abroad (%) - Asian
Geographical mobility - Moved from abroad (%) - Hispanic or Latino
Geographical mobility - Moved from abroad (%) - American Indian and Alaska Native
Geographical mobility - Moved from abroad (%) - Multirace
Geographical mobility - Moved from abroad (%) - Other Race
Place of birth for the foreign-born population - Ireland (%)
Place of birth for the foreign-born population - Denmark (%)
Place of birth for the foreign-born population - Norway (%)
Place of birth for the foreign-born population - Sweden (%)
Place of birth for the foreign-born population - United Kingdom (%)
Place of birth for the foreign-born population - England (%)
Place of birth for the foreign-born population - Scotland (%)
Place of birth for the foreign-born population - Other Northern Europe (%)
Place of birth for the foreign-born population - Austria (%)
Place of birth for the foreign-born population - Belgium (%)
Place of birth for the foreign-born population - France (%)
Place of birth for the foreign-born population - Germany (%)
Place of birth for the foreign-born population - Netherlands (%)
Place of birth for the foreign-born population - Switzerland (%)
Place of birth for the foreign-born population - Other Western Europe (%)
Place of birth for the foreign-born population - Greece (%)
Place of birth for the foreign-born population - Italy (%)
Place of birth for the foreign-born population - Portugal (%)
Place of birth for the foreign-born population - Spain (%)
Place of birth for the foreign-born population - Other Southern Europe (%)
Place of birth for the foreign-born population - Albania (%)
Place of birth for the foreign-born population - Belarus (%)
Place of birth for the foreign-born population - Bosnia and Herzegovina (%)
Place of birth for the foreign-born population - Bulgaria (%)
Place of birth for the foreign-born population - Croatia (%)
Place of birth for the foreign-born population - Czechoslovakia (%)
Place of birth for the foreign-born population - Hungary (%)
Place of birth for the foreign-born population - Latvia (%)
Place of birth for the foreign-born population - Lithuania (%)
Place of birth for the foreign-born population - North Macedonia (Macedonia) (%)
Place of birth for the foreign-born population - Moldova (%)
Place of birth for the foreign-born population - Poland (%)
Place of birth for the foreign-born population - Romania (%)
Place of birth for the foreign-born population - Russia (%)
Place of birth for the foreign-born population - Serbia (%)
Place of birth for the foreign-born population - Ukraine (%)
Place of birth for the foreign-born population - Other Eastern Europe (%)
Place of birth for the foreign-born population - China (%)
Place of birth for the foreign-born population - Hong Kong (%)
Place of birth for the foreign-born population - Taiwan (%)
Place of birth for the foreign-born population - Japan (%)
Place of birth for the foreign-born population - Korea (%)
Place of birth for the foreign-born population - Other Eastern Asia (%)
Place of birth for the foreign-born population - Afghanistan (%)
Place of birth for the foreign-born population - Bangladesh (%)
Place of birth for the foreign-born population - India (%)
Place of birth for the foreign-born population - Iran (%)
Place of birth for the foreign-born population - Kazakhstan (%)
Place of birth for the foreign-born population - Nepal (%)
Place of birth for the foreign-born population - Pakistan (%)
Place of birth for the foreign-born population - Sri Lanka (%)
Place of birth for the foreign-born population - Uzbekistan (%)
Place of birth for the foreign-born population - Other South Central Asia (%)
Place of birth for the foreign-born population - Burma (%)
Place of birth for the foreign-born population - Cambodia (%)
Place of birth for the foreign-born population - Indonesia (%)
Place of birth for the foreign-born population - Laos (%)
Place of birth for the foreign-born population - Malaysia (%)
Place of birth for the foreign-born population - Philippines (%)
Place of birth for the foreign-born population - Singapore (%)
Place of birth for the foreign-born population - Thailand (%)
Place of birth for the foreign-born population - Vietnam (%)
Place of birth for the foreign-born population - Other South Eastern Asia (%)
Place of birth for the foreign-born population - Armenia (%)
Place of birth for the foreign-born population - Iraq (%)
Place of birth for the foreign-born population - Israel (%)
Place of birth for the foreign-born population - Jordan (%)
Place of birth for the foreign-born population - Kuwait (%)
Place of birth for the foreign-born population - Lebanon (%)
Place of birth for the foreign-born population - Saudi Arabia (%)
Place of birth for the foreign-born population - Syria (%)
Place of birth for the foreign-born population - Turkey (%)
Place of birth for the foreign-born population - Yemen (%)
Place of birth for the foreign-born population - Other Western Asia (%)
Place of birth for the foreign-born population - Eritrea (%)
Place of birth for the foreign-born population - Ethiopia (%)
Place of birth for the foreign-born population - Kenya (%)
Place of birth for the foreign-born population - Somalia (%)
Place of birth for the foreign-born population - Uganda (%)
Place of birth for the foreign-born population - Zimbabwe (%)
Place of birth for the foreign-born population - Other Eastern Africa (%)
Place of birth for the foreign-born population - Cameroon (%)
Place of birth for the foreign-born population - Congo (%)
Place of birth for the foreign-born population - Democratic Republic of Congo (Zaire) (%)
Place of birth for the foreign-born population - Other Middle Africa (%)
Place of birth for the foreign-born population - Egypt (%)
Place of birth for the foreign-born population - Morocco (%)
Place of birth for the foreign-born population - Sudan (%)
Place of birth for the foreign-born population - Other Northern Africa (%)
Place of birth for the foreign-born population - South Africa (%)
Place of birth for the foreign-born population - Other Southern Africa (%)
Place of birth for the foreign-born population - Cabo Verde (%)
Place of birth for the foreign-born population - Ghana (%)
Place of birth for the foreign-born population - Liberia (%)
Place of birth for the foreign-born population - Nigeria (%)
Place of birth for the foreign-born population - Senegal (%)
Place of birth for the foreign-born population - Sierra Leone (%)
Place of birth for the foreign-born population - Other Western Africa (%)
Place of birth for the foreign-born population - Australia (%)
Place of birth for the foreign-born population - New Zealand (%)
Place of birth for the foreign-born population - Fiji (%)
Place of birth for the foreign-born population - Micronesia (%)
Place of birth for the foreign-born population - Bahamas (%)
Place of birth for the foreign-born population - Barbados (%)
Place of birth for the foreign-born population - Cuba (%)
Place of birth for the foreign-born population - Dominica (%)
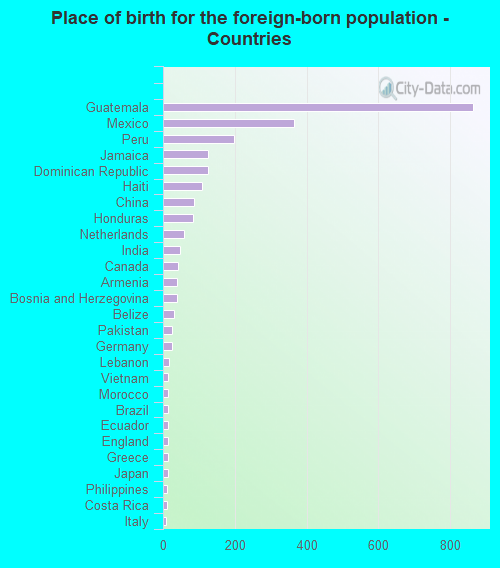
Place of birth for the foreign-born population - Dominican Republic (%)
Place of birth for the foreign-born population - Grenada (%)
Place of birth for the foreign-born population - Haiti (%)
Place of birth for the foreign-born population - Jamaica (%)
Place of birth for the foreign-born population - St. Vincent and the Grenadines (%)
Place of birth for the foreign-born population - Trinidad and Tobago (%)
Place of birth for the foreign-born population - West Indies (%)
Place of birth for the foreign-born population - Other Caribbean (%)
Place of birth for the foreign-born population - Belize (%)
Place of birth for the foreign-born population - Costa Rica (%)
Place of birth for the foreign-born population - El Salvador (%)
Place of birth for the foreign-born population - Guatemala (%)
Place of birth for the foreign-born population - Honduras (%)
Place of birth for the foreign-born population - Mexico (%)
Place of birth for the foreign-born population - Nicaragua (%)
Place of birth for the foreign-born population - Panama (%)
Place of birth for the foreign-born population - Other Central America (%)
Place of birth for the foreign-born population - Argentina (%)
Place of birth for the foreign-born population - Bolivia (%)
Place of birth for the foreign-born population - Brazil (%)
Place of birth for the foreign-born population - Chile (%)
Place of birth for the foreign-born population - Colombia (%)
Place of birth for the foreign-born population - Ecuador (%)
Place of birth for the foreign-born population - Guyana (%)
Place of birth for the foreign-born population - Peru (%)
Place of birth for the foreign-born population - Uruguay (%)
Place of birth for the foreign-born population - Venezuela (%)
Place of birth for the foreign-born population - Other South America (%)
Place of birth for the foreign-born population - Canada (%)
Place of birth for the foreign-born population - Other Northern America (%)
Place of birth for the foreign-born population - Other (%)
Latest news about races in Chambersburg, PA collected exclusively by city-data.com from local newspapers, TV, and radio stations
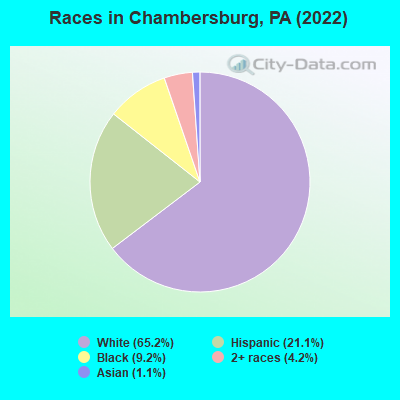
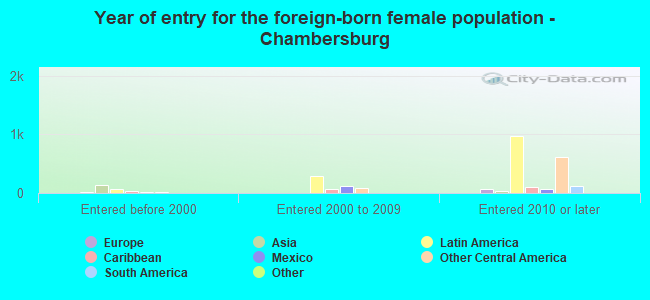
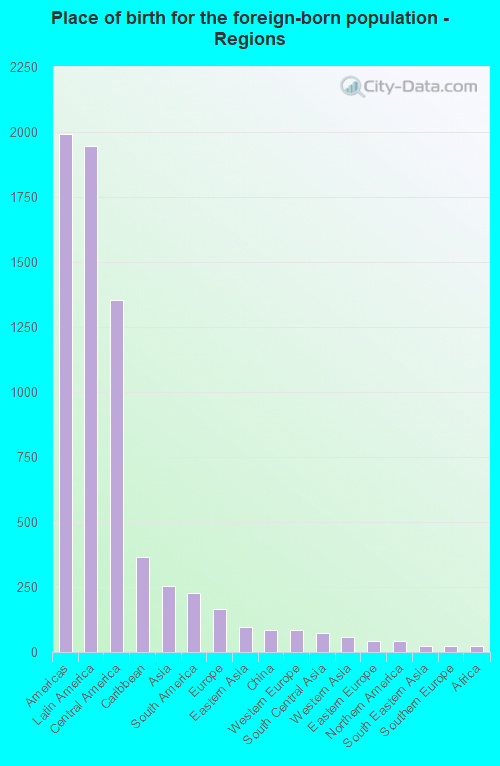
According to 2022 data, the most numerous races in Chambersburg, PA are White alone (14,362 residents), Black alone (2,036 residents), and Hispanic (4,652 residents). 82.3% of Chambersburg residents speak English at home. 11.0% of Chambersburg, PA residents are foreign-born (8.6% born in Latin America, 1.1% born in Asia), which is 36.6% greater than the foreign-born rate of 7.0% across the entire state of Pennsylvania.
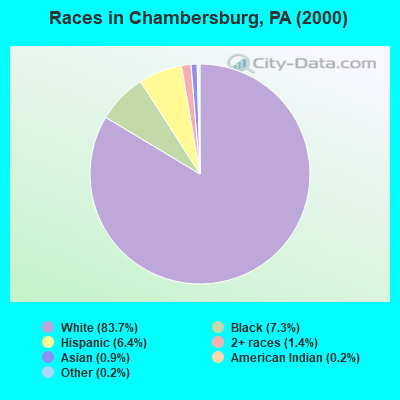
Race distribution in Chambersburg
2000 2022
10,322,455 84.1% White alone 1,202,437 9.8% Black alone 394,088 3.2% Hispanic 218,296 1.8% Asian alone 113,097 0.9% Two or more races 13,086 0.1% Other race alone 14,904 0.1% American Indian alone 2,691 0.02% Native Hawaiian and Other
9,487,228 73.1% White alone 1,311,581 10.1% Black alone 1,115,997 8.6% Hispanic 493,942 3.8% Two or more races 487,124 3.8% Asian alone 63,582 0.5% Other race alone 10,130 0.08% American Indian alone 2,424 0.02% Native Hawaiian and Other
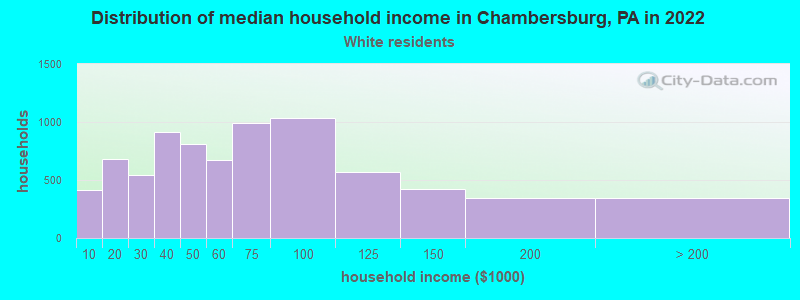
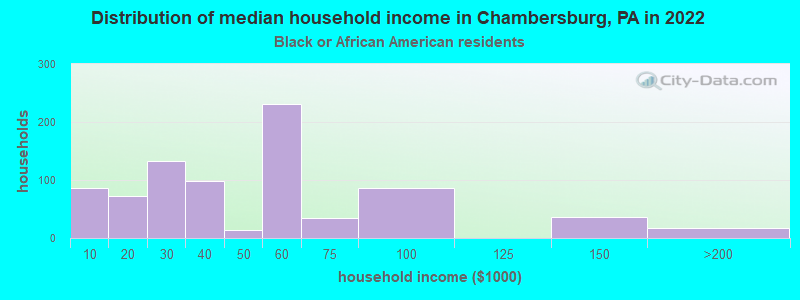
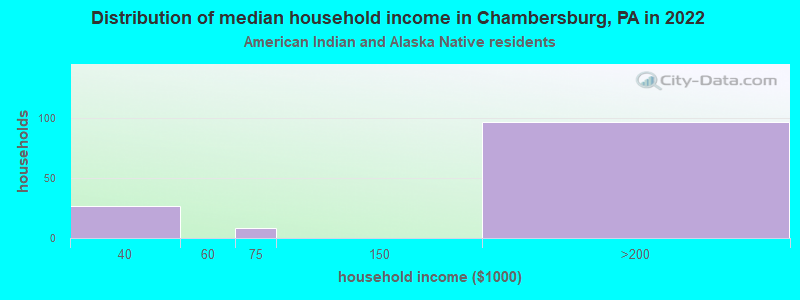
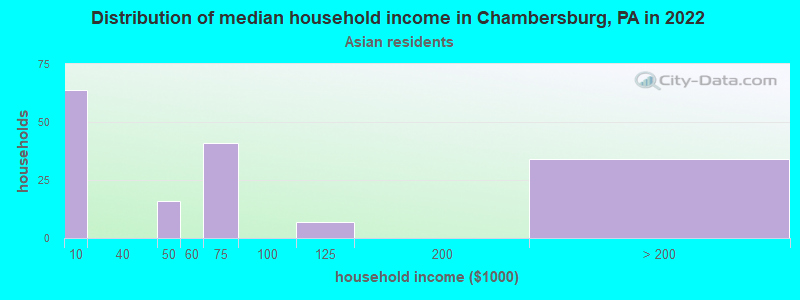
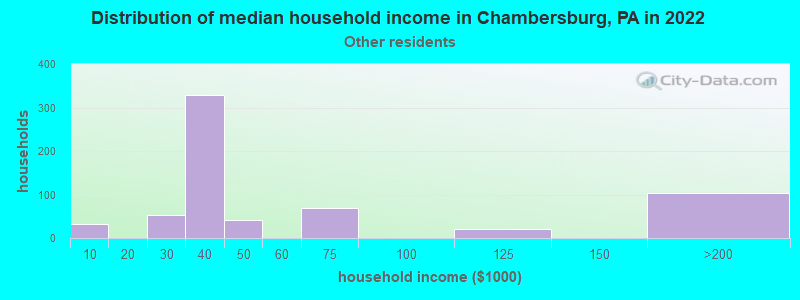
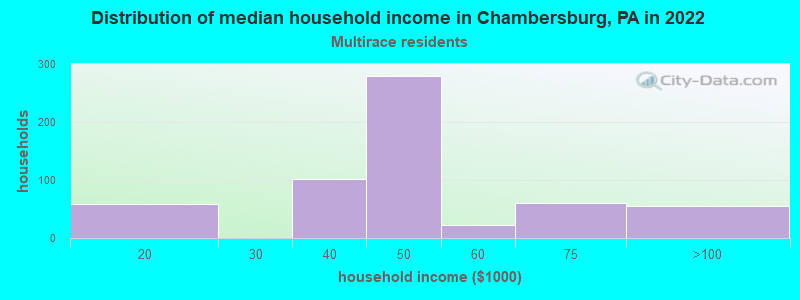
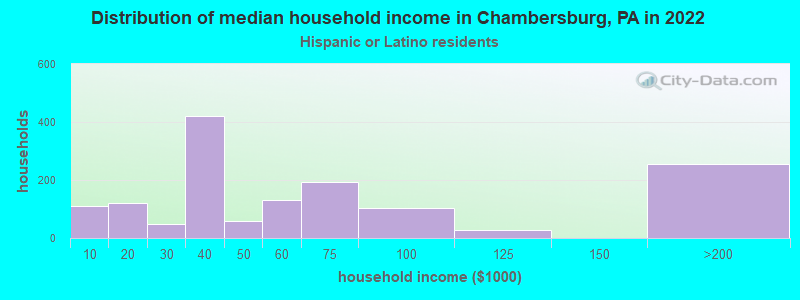
Income and house value in Chambersburg Median household income in 2022 $57,412 White non-Hispanic householders$68,129 Black householders$168,303 American Indian and Alaska Native householders$53,371 Some other race householders$46,266 Two or more races householders$55,148 Hispanic or Latino race householdersMedian 2022 house value $198,424 White Non-Hispanic householders$183,877 Black or African American householders $227,290 Asian householders$102,280 Some other race householders$106,599 Two or more races householders$108,417 Hispanic or Latino householders
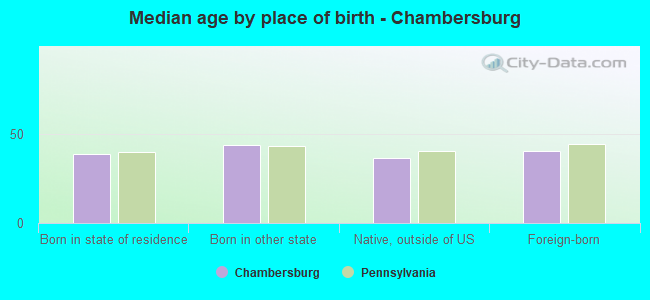
Median age by race in Chambersburg
45.9 Median age for White residents44.1 47.3 32.2 Median age for Black or African American residents50.3 23.8 13.5 Median age for American Indian / Alaska Native residents29.4 27.7 49.5 Median age for Asian residents38.0 37.8 -666,666,666.0 Median age for Native Hawaiian / Pacific Islander residents-666,666,666.0 -666,666,666.0 30.5 Median age for Other race residents15.4 44.5 23.2 Median age for Two or more races residents20.2 45.1 47.3 Median age for White alone residents45.9 49.5 23.3 Median age for Hispanic or Latino residents20.2 34.0
Owner/renter occupied households by race in Chambersburg
House owners and renters - White residents 3,869 49.7% Owner occupied3,920 50.3% Renter occupiedHouse owners and renters - Black or African American residents 122 14.1% Owner occupied746 85.9% Renter occupiedHouse owners and renters - American Indian / Alaska Native residents 349 100.0% Renter occupiedHouse owners and renters - Asian residents 47 29.2% Owner occupied113 70.8% Renter occupiedHouse owners and renters - Other race residents 64 10.8% Owner occupied529 89.2% Renter occupiedHouse owners and renters - Two or more races residents 256 42.9% Owner occupied341 57.1% Renter occupiedHouse owners and renters - White alone residents 3,733 50.4% Owner occupied3,668 49.6% Renter occupiedHouse owners and renters - Hispanic or Latino residents 457 37.6% Owner occupied757 62.4% Renter occupied
Language usage in Chambersburg
English speakers - Total 82.3% of residents of Chambersburg speak English at home.
13.3% of residents speak Spanish at home 1,265 45.8% Speak English very well1,500 54.2% Speak English less than very well3.7% of residents speak other language at home 520 67.4% Speak English very well252 32.6% Speak English less than very well
English speakers - Born in the United States 92.1% of residents of Chambersburg speak English at home.
5.1% of residents speak Spanish at home 243 82.4% Speak English very well52 17.6% Speak English less than very well1.9% of residents speak other language at home 100 88.5% Speak English very well13 11.5% Speak English less than very well
English speakers - Native, born elsewhere 65.2% of residents of Chambersburg speak English at home.
81.6% of residents speak Spanish at home 261 67.1% Speak English very well128 32.9% Speak English less than very well
English speakers - Foreign-born 13.6% of residents of Chambersburg speak English at home.
58.5% of residents speak Spanish at home 537 29.1% Speak English very well1,309 70.9% Speak English less than very well20.6% of residents speak other language at home 374 57.5% Speak English very well276 42.5% Speak English less than very well
White (Caucasian) - Speak only English Native:
96.0% (13,619)Foreign-born:
23.8% (165)
White (Caucasian) - Speak another language Native:
3.0% (432)Foreign-born:
100.0% (694)
Black or African American - Speak only English Native:
97.1% (1,601)Foreign-born:
43.9% (96)
Black or African American - Speak another language Native:
3.0% (49)Foreign-born:
55.2% (120)
American Indian / Alaska Native - Speak another language Native:
100.0% (424)Foreign-born:
100.0% (192)
Asian - Speak only English Native:
96.6% (49)Foreign-born:
15.9% (34)
Other race - Speak another language Native:
74.6% (566)Foreign-born:
100.0% (624)
Two or more races - Speak only English Native:
87.6% (1,585)Foreign-born:
33.2% (75)
Two or more races - Speak another language Native:
11.7% (212)Foreign-born:
61.9% (139)
White alone - Speak only English Native:
98.2% (13,295)Foreign-born:
35.8% (122)
White alone - Speak another language Native:
1.6% (215)Foreign-born:
90.4% (309)
Hispanic or Latino - Speak only English Native:
58.6% (1,347)Foreign-born:
3.1% (70)
Hispanic or Latino - Speak another language Native:
41.5% (953)Foreign-born:
80.8% (1,794)
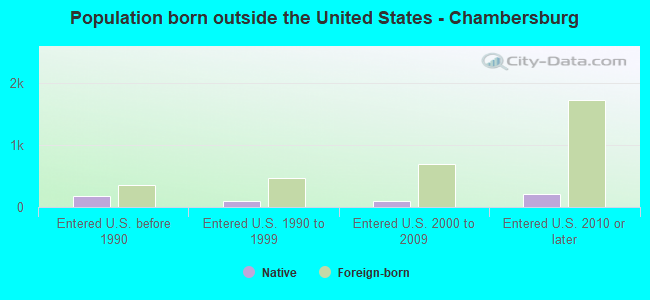
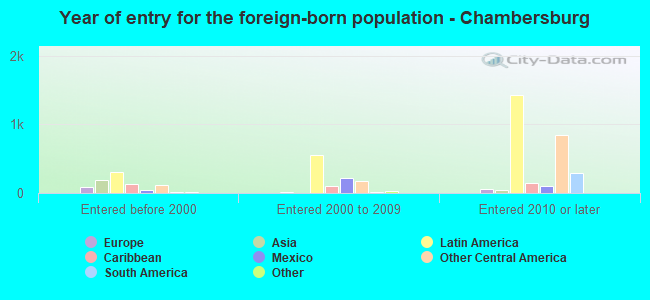
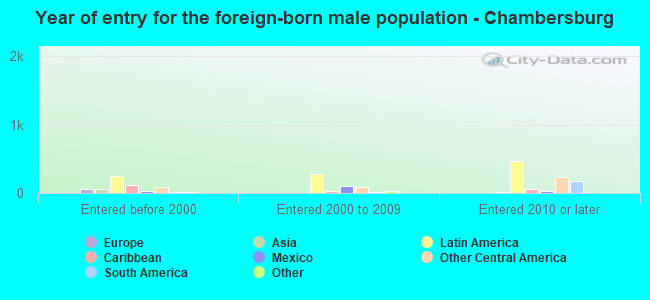
Foreign-born residents in Chambersburg 2,434 residents are foreign born (8.6% Latin America , 1.1% Asia ).
This city:
11.0%Pennsylvania:
7.3%
Marital status for residents in Chambersburg Marital status - White (Caucasian) population 15 years and over
Males 36.2% Never married46.9% Now married1.3% Separated2.9% Widowed12.7% DivorcedFemales 27.1% Never married35.9% Now married3.9% Separated12.6% Widowed20.5% DivorcedWomen who gave birth in the past 12 months Now married:
84.8% (107)Unmarried:
15.2% (19)
Women who did not give birth in the past 12 months Now married:
40.9% (1,464)Unmarried:
59.1% (2,117)
Marital status - Black or African American population 15 years and over
Males 41.5% Never married23.7% Now married4.3% Separated9.1% Widowed21.4% DivorcedFemales 64.7% Never married22.1% Now married0.0% Separated5.2% Widowed8.0% DivorcedWomen who gave birth in the past 12 months Now married:
31.2% (14)Unmarried:
68.8% (32)
Women who did not give birth in the past 12 months Now married:
13.6% (58)Unmarried:
86.4% (366)
Marital status - American Indian / Alaska Native population 15 years and over
Males 81.6% Never married18.4% Now married0.0% Separated0.0% Widowed0.0% DivorcedFemales 0.0% Never married100.0% Now married0.0% Separated0.0% Widowed0.0% DivorcedWomen who did not give birth in the past 12 months Now married:
100.0% (75)Unmarried:
0.0% (0)
Marital status - Asian population 15 years and over
Males 21.4% Never married78.6% Now married0.0% Separated0.0% Widowed0.0% DivorcedFemales 48.8% Never married15.3% Now married0.0% Separated35.9% Widowed0.0% DivorcedWomen who did not give birth in the past 12 months Now married:
8.8% (8)Unmarried:
91.2% (85)
Marital status - Other race population 15 years and over
Males 70.0% Never married30.0% Now married0.0% Separated0.0% Widowed0.0% DivorcedFemales 36.4% Never married20.4% Now married12.1% Separated26.9% Widowed4.3% DivorcedWomen who gave birth in the past 12 months Now married:
0.0% (0)Unmarried:
100.0% (16)
Women who did not give birth in the past 12 months Now married:
27.1% (119)Unmarried:
72.9% (320)
Marital status - Two or more races population 15 years and over
Males 91.0% Never married7.1% Now married0.5% Separated0.0% Widowed1.4% DivorcedFemales 28.8% Never married25.0% Now married32.2% Separated4.3% Widowed9.7% DivorcedWomen who did not give birth in the past 12 months Now married:
44.4% (185)Unmarried:
55.6% (232)
Marital status - White alone, not Hispanic / Latino population 15 years and over
Males 36.3% Never married45.6% Now married1.4% Separated3.1% Widowed13.6% DivorcedFemales 26.0% Never married36.1% Now married3.0% Separated12.8% Widowed22.2% DivorcedWomen who gave birth in the past 12 months Now married:
100.0% (45)Unmarried:
0.0% (0)
Women who did not give birth in the past 12 months Now married:
40.8% (1,346)Unmarried:
59.2% (1,949)
Marital status - Hispanic or Latino population 15 years and over
Males 68.1% Never married31.9% Now married0.0% Separated0.0% Widowed0.0% DivorcedFemales 38.6% Never married34.3% Now married11.3% Separated14.2% Widowed1.6% DivorcedWomen who gave birth in the past 12 months Now married:
66.7% (70)Unmarried:
33.3% (35)
Women who did not give birth in the past 12 months Now married:
40.4% (387)Unmarried:
59.6% (570)
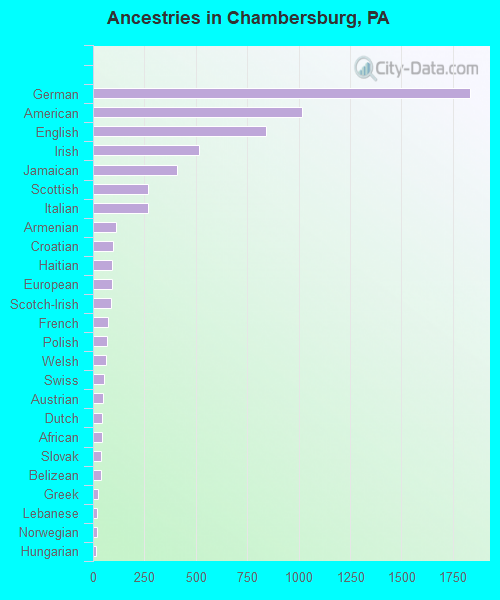
Ancestries in Chambersburg
1,834 17.4% German1,018 9.6% American842 8.0% English517 4.9% Irish408 3.9% Jamaican269 2.5% Scottish267 2.5% Italian111 1.1% Armenian97 0.9% Croatian92 0.9% Haitian91 0.9% European86 0.8% Scotch-Irish71 0.7% French68 0.6% Polish63 0.6% Welsh53 0.5% Swiss49 0.5% Austrian46 0.4% Dutch43 0.4% African41 0.4% Slovak40 0.4% Belizean26 0.2% Greek21 0.2% Lebanese18 0.2% Norwegian17 0.2% Hungarian15 0.1% Iranian14 0.1% Moroccan13 0.1% West Indian13 0.1% Trinidadian and Tobagonian10 0.09% Eastern European9 0.09% Swedish9 0.09% Pennsylvania German8 0.08% Ukrainian8 0.08% Czechoslovakian8 0.08% Bulgarian7 0.07% Brazilian6 0.06% Scandinavian5 0.05% British5 0.05% Northern European
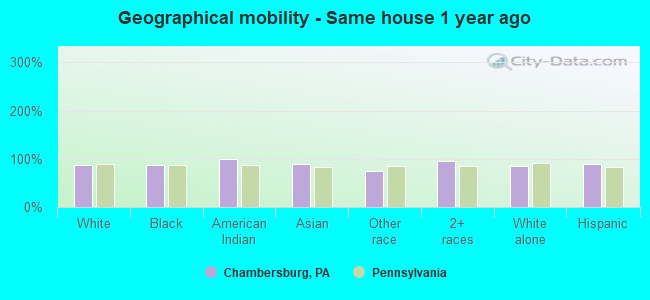
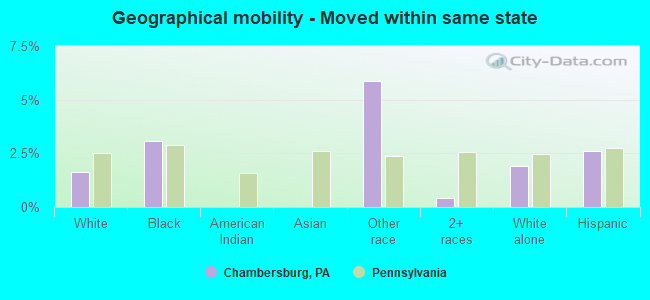
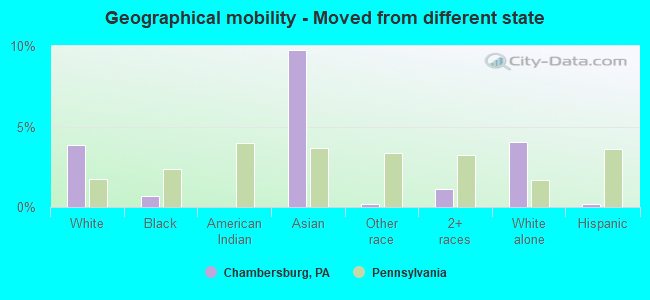
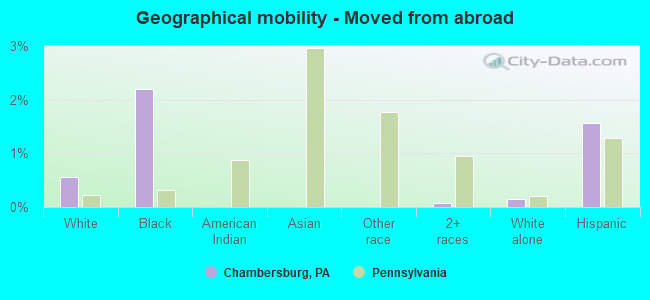
Geographical mobility in Chambersburg Same house 1 year ago 13,744 87.2% White (Caucasian)1,741 86.8% Black or African American648 99.6% American Indian / Alaska Native236 89.4% Asian1,077 74.4% Other race2,283 96.4% Two or more races12,309 86.3% White alone, not Hispanic / Latino4,053 89.8% Hispanic or LatinoMoved within same county 1,124 7.1% White / Caucasian135 6.7% Black or African American221 15.3% Other race56 2.4% Two or more races1,181 8.3% White alone, not Hispanic / Latino268 5.9% Hispanic or LatinoMoved within same state 256 1.6% White / Caucasian62 3.1% Black or African American85 5.9% Other race10 0.4% Two or more races272 1.9% White alone, not Hispanic / Latino118 2.6% Hispanic or LatinoMoved from different state 604 3.8% White / Caucasian14 0.7% Black or African American26 9.7% Asian3 0.2% Other race26 1.1% Two or more races574 4.0% White alone, not Hispanic / Latino9 0.2% Hispanic or LatinoMoved from abroad 87 0.6% White44 2.2% Black or African American2 0.1% Two or more races21 0.1% White alone, not Hispanic / Latino70 1.6% Hispanic or Latino
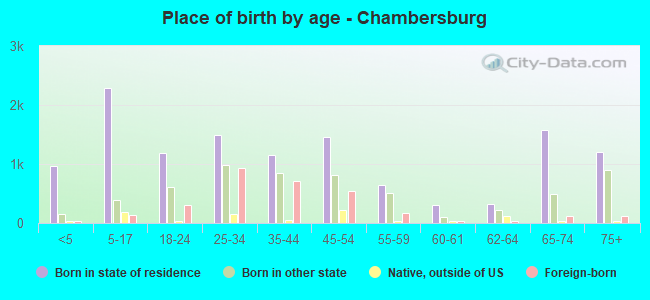
Children Nativity (place of birth) in Chambersburg
Children under 6 years - Living with two parents Both parents native 391 100.0% NativeBoth parents foreign-born 136 100.0% NativeOne native, one foreign-born parent 110 100.0% NativeChildren under 6 years - Living with one parent Native parent 304 100.0% NativeForeign-born parent 201 100.0% NativeChildren 6 to 17 years - Living with two parents Both parents native 1,086 100.0% NativeBoth parents foreign-born 414 91.3% Native39 8.7% Foreign-bornOne native, one foreign-born parent 196 71.4% Native79 28.6% Foreign-bornChildren 6 to 17 years - Living with one parent Native parent 809 92.9% Native62 7.1% Foreign-bornForeign-born parent 190 72.2% Native73 27.8% Foreign-born
Grandparents responsible for own grandchildren in Chambersburg
Grandparents (30 to 59 years) White / Caucasian 96 57.1% Responsible for grandchildren72 42.9% Not responsible for grandchildrenOther race 161 100.0% Not responsible for grandchildrenWhite alone, not Hispanic / Latino 47 39.4% Responsible for grandchildren72 60.6% Not responsible for grandchildrenHispanic or Latino 61 33.6% Responsible for grandchildren121 66.4% Not responsible for grandchildrenGrandparents (60 years and over) White / Caucasian 193 89.7% Responsible for grandchildren22 10.3% Not responsible for grandchildrenWhite alone, not Hispanic / Latino 95 81.1% Responsible for grandchildren22 18.9% Not responsible for grandchildrenHispanic or Latino 70 100.0% Responsible for grandchildren