Races in Chance-Loeb, Texas (TX) Detailed Stats
Ancestries, Foreign-born residents, place of birth
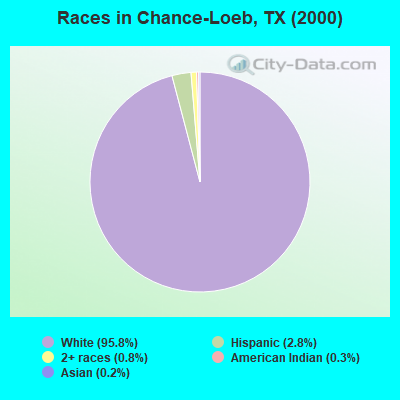
Race distribution in Chance-Loeb

- 13,26395.8%White alone
- 3852.8%Hispanic
- 1130.8%Two or more races
- 390.3%American Indian alone
- 250.2%Asian alone
- 110.08%Other race alone
- 70.05%Black alone
- 20.01%Native Hawaiian and Other
Pacific Islander alone
2000
2022
-
- 10,933,31352.4%White alone
- 6,669,66632.0%Hispanic
- 2,364,25511.3%Black alone
- 554,4452.7%Asian alone
- 230,5671.1%Two or more races
- 68,8590.3%American Indian alone
- 19,9580.10%Other race alone
- 10,7570.05%Native Hawaiian and Other
Pacific Islander alone

-
- 12,070,64240.2%Hispanic
- 11,683,43038.9%White alone
- 3,508,70611.7%Black alone
- 1,608,1735.4%Asian alone
- 956,5603.2%Two or more races
- 125,7630.4%Other race alone
- 47,0230.2%American Indian alone
- 29,2750.10%Native Hawaiian and Other
Pacific Islander alone

Income and house value in Chance-Loeb
- Median household income in 2022
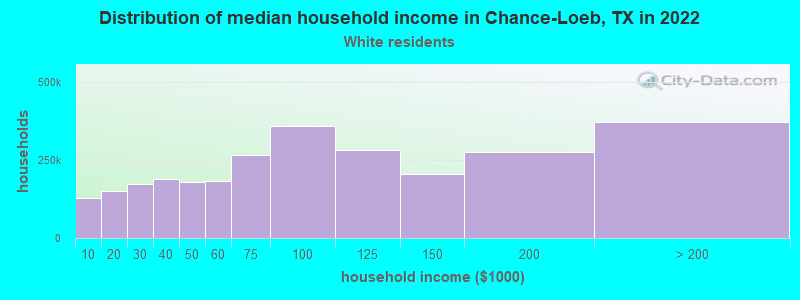
- $74,037White non-Hispanic householders
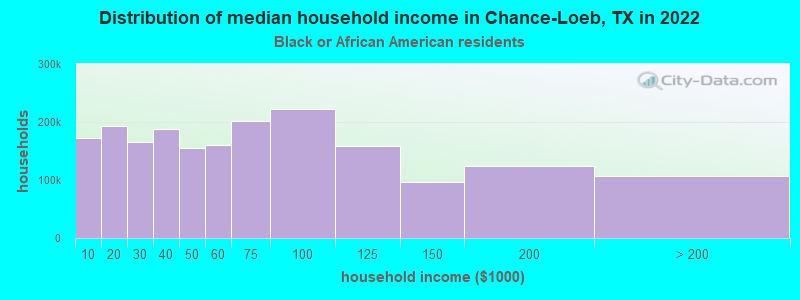
- $159,296Black householders
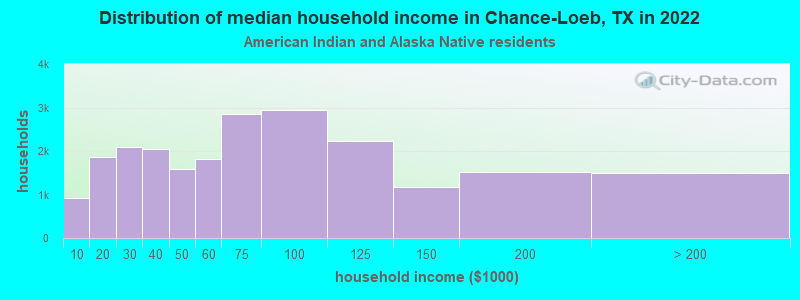
- $35,316American Indian and Alaska Native householders
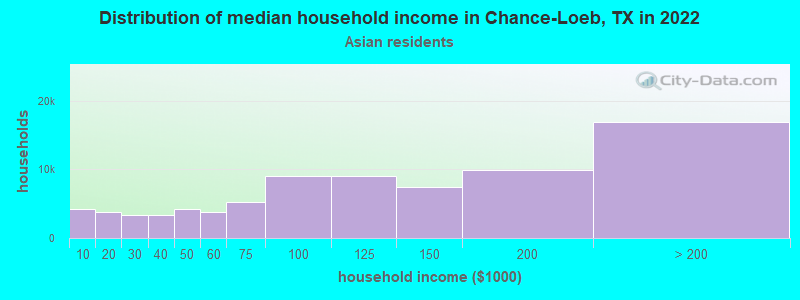
- $29,750Asian householders
- $55,351Some other race householders
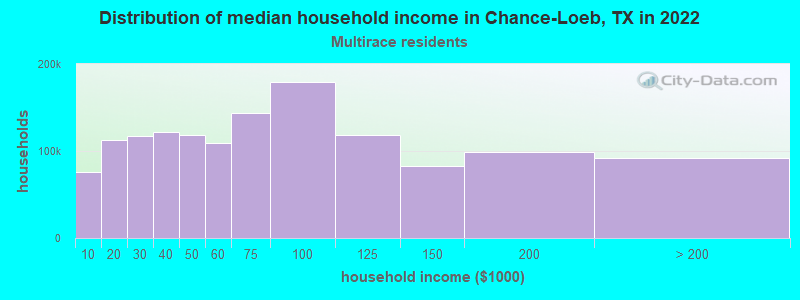
- $78,158Two or more races householders
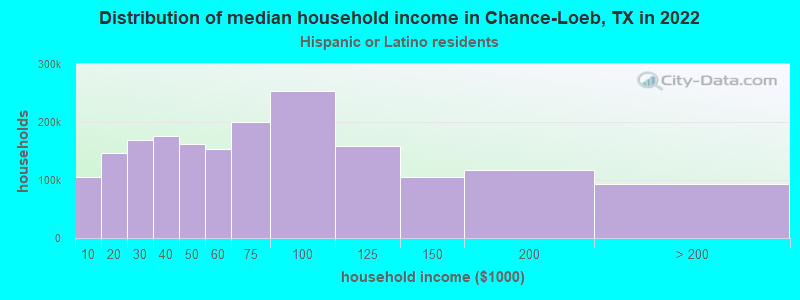
- $60,798Hispanic or Latino race householders
- Median 2022 house value
- $292,526White Non-Hispanic householders
- $106,462Black or African American householders
- $368,524Asian householders
- $180,167Some other race householders
- $199,167Two or more races householders
- $270,251Hispanic or Latino householders
Household income for White non-Hispanic householders
Household income for Black householders
Household income for American Indian and Alaska Native householders
Household income for Asian householders
Household income for Two or more races householders
Household income for Hispanic or Latino race householders
Zip code: 77657